Analysts' Ideas of the Week - Slow Rollout of Vaccines to Delay Economic Recovery - Baystreet.ca
←
→
Page content transcription
If your browser does not render page correctly, please read the page content below

Analysts' Ideas of the Week
Slow Rollout of Vaccines to Delay Economic Recovery

                  January 4, 2021
               www.researchfrc.com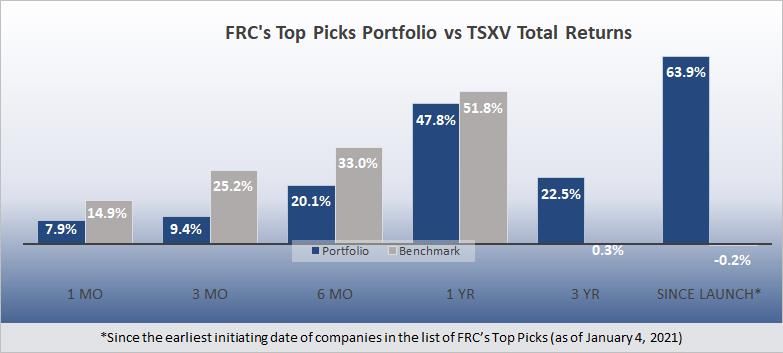
Page 2

                                             FRC Top Picks
Happy New Year! All of us at FRC wish you a healthy and successful year of investing!
We look forward to continuing to assist you in your due diligence by providing unique
insights and investment ideas. Please continue to follow our research, as we have
several exciting initiatives planned for the year.

Since the Canadian stock markets were closed on December 28, 2020, we are not
presenting WoW performance of our top picks. Our top picks were up 63.9%, on
average, since initiation of coverage vs the benchmark’s -0.2%.

                                         Performance by Sector

                                                  Source: FRC

A complete list of top picks (updated weekly) can be viewed here.

   ©2021 Fundamental Research Corp. “17+ Years of Bringing Undiscovered Investment Opportunities to the Forefront”
                    Click here to view FRC’s complete list of top picks
      PLEASE READ THE IMPORTANT DISCLOSURES AT THE BACK OF THIS REPORT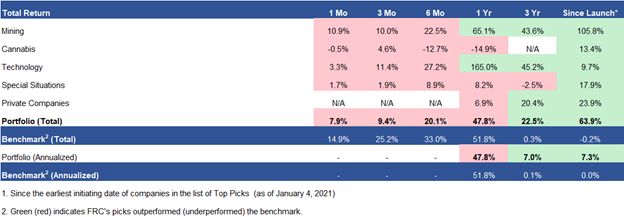
Page 3

                                  Weekly Mining Commentary
Despite the continued surge in COVID-19 cases, four of the seven global equity indices
we track were up WoW.

                                            Source: FRC / Various

Except India and Russia, most of the hardest hit nations reported a surge in cases in
the past week.

                          Source: https://www.worldometers.info/coronavirus/

   ©2021 Fundamental Research Corp. “17+ Years of Bringing Undiscovered Investment Opportunities to the Forefront”
                    Click here to view FRC’s complete list of top picks
      PLEASE READ THE IMPORTANT DISCLOSURES AT THE BACK OF THIS REPORT
Page 4
The rollout of vaccines has been much slower than expected. Only 1.38% of the
U.S. population has received vaccinations. This compares to 0.3% for Canada, and
1.39% for the U.K. Israel leads the pack at 14%. Although Israel is a significantly
smaller country with a population of under nine million, sources indicate that the
country’s centralized government, and early negotiations with drug makers are driving
this successful rollout.
Source: https://ourworldindata.org/
The World Health Organization’s Chief Scientist recently stated that although the
approved vaccines have been tested to prevent recipients from becoming seriously sick,
there is no evidence that they can prevent transmission. We believe this factor, and
the slow rollout of vaccines amid rising cases, imply that restrictions are unlikely
to be relaxed until there is a significant decline in new cases.
Globally, 13M vaccines were administered yesterday (Source: Ourworldindata.org). At
this rate (assuming two doses per individual), we estimate it will take approximately
10 months to vaccinate 25% of the global population. We will be closely monitoring
the above shown vaccine rollout data, as it will help us predict the timing of an economic
recovery.
Except zinc, all the mainstream metals reported gains in the past week due to a weaker
US$ amid rising inflationary expectations. In the charts below, note the increase in
inflationary expectations, and a corresponding decline in the US$ since March
2020.
©2021 Fundamental Research Corp. “17+ Years of Bringing Undiscovered Investment Opportunities to the Forefront”
Click here to view FRC’s complete list of top picks
PLEASE READ THE IMPORTANT DISCLOSURES AT THE BACK OF THIS REPORTPage 5
Source: https://www.marketwatch.com/
Valuations of gold and base metals producers also increased slightly.
©2021 Fundamental Research Corp. “17+ Years of Bringing Undiscovered Investment Opportunities to the Forefront”
Click here to view FRC’s complete list of top picks
PLEASE READ THE IMPORTANT DISCLOSURES AT THE BACK OF THIS REPORTPage 6
©2021 Fundamental Research Corp. “17+ Years of Bringing Undiscovered Investment Opportunities to the Forefront”
Click here to view FRC’s complete list of top picks
PLEASE READ THE IMPORTANT DISCLOSURES AT THE BACK OF THIS REPORTPage 7
Inventory levels of copper declined on the LME, but increased on the SHFE
(Shanghai), and do not provide any specific insights.
As restrictions are unlikely to be relaxed until there is a decline in new cases, we expect
base metal prices to be under pressure. We expect the US$ to stabilize at current levels
as we believe the chance of another stimulus package in Q1 is low. That said, the
Biden government is likely to push for one once they take office later this month.
We expect gold prices to remain volatile in Q1. The consensus forecast for gold in 2021
is US$1,800 to US$1,900/oz. Our commodity price forecasts (unchanged) are shown
below:
©2021 Fundamental Research Corp. “17+ Years of Bringing Undiscovered Investment Opportunities to the Forefront”
Click here to view FRC’s complete list of top picks
PLEASE READ THE IMPORTANT DISCLOSURES AT THE BACK OF THIS REPORTPage 8
In the following section, we review companies that announced key developments in the
past week.
Mining / Exploration
Company Ticker Current Share FRC Fair Value Date of PR:
Name: Symbol Price: Estimate:
Cornerstone TSXV: CGP $5.09 $7.44 Dec 29, 2020
Capital
Resources Inc.
PR Content FRC Opinion
After spending US$1.1M and Positive – We are pleased to see the
completing its initial minimum work company advancing its non-core assets. We
commitment on the Miocene project in continue to believe that CGP’s flagship asset
Chile (potential for epithermal gold- (Cascabel) is an excellent acquisition target,
silver and porphyry gold-copper and would not be surprised if BHP (ASX:
deposits), Newcrest Mining (TSX: NCM) BHP) or Newcrest / ASX: NCM (who are also
has elected to move to the next stage of significant shareholders of SolGold / LSE:
exploration. Newcrest has an option to SOLG) have a go at SOLG and CGP at the
earn up to a 75% interest in the project. same time. A Pre-feasibility Study (PFS) on
The next stage of exploration is only the project is ongoing.
planned for later in the year due to the
pandemic.
©2021 Fundamental Research Corp. “17+ Years of Bringing Undiscovered Investment Opportunities to the Forefront”
Click here to view FRC’s complete list of top picks
PLEASE READ THE IMPORTANT DISCLOSURES AT THE BACK OF THIS REPORTPage 9
Company Ticker Current Share FRC Fair Value Date of PR:
Name: Symbol Price: Estimate:
Mammoth TSXV: MTH $0.12 $0.27 Dec 21, 2020
Resources
PR Content FRC Opinion
Received approval from the second of Positive – In our previous report in
two communities (ejidos) in the region for November 2020, we had mentioned that
a two-year surface access agreement to obtaining surface access agreements is
conduct exploration at MTH’s Tenoriba key. MTH’s shares are up 60% since our
gold-silver project. The company had report. The company is awaiting a permit to
announced approval from the other ejido drill up to 139 holes. MTH also expects to
in November 2020. announce results of a project review
recently conducted by a third-party geologist
with expertise in high sulphidation
epithermal systems. MTH is evaluating
options to fund the drill program, including a
capital raise, attracting a JV partner, or
merging with a cash-rich junior. Tenoriba is
only partially tested, and has characteristics
associated with high sulphidation epithermal
precious metal systems over a large 15 sq.
km area.
©2021 Fundamental Research Corp. “17+ Years of Bringing Undiscovered Investment Opportunities to the Forefront”
Click here to view FRC’s complete list of top picks
PLEASE READ THE IMPORTANT DISCLOSURES AT THE BACK OF THIS REPORTPage 10
Special Situations
Company Ticker Current Share FRC Fair Value Date of PR:
Name: Symbol Price: Estimate:
Elys Game NASDAQ: $5.51 $6.78 Dec 30, 2020
Technology ELYS
Corp.
PR Content FRC Opinion
Announced dual listing on the NEO Positive – ELYS is trading at 2.5x revenue.
exchange. The company is currently awaiting its first
sports betting license, and expects to
The online gambling space has seen a launch operations in Q1-2021. ELYS
number of M&A activities recently. U.K. already has arrangements with two
based gambling and sports betting operators in the U.S. to use its platform. We
company, Entain (LSE: ENT), rejected a are projecting revenue of $37M in FY2020E,
US$11B takeover offer by MGM (NYSE: and $50M in FY2021E (unchanged). We
MGM). MGM’s bid reflected an Enterprise expect ELYS to be an acquisition target
Value to Revenue ratio of 2.6x. We once it is able to demonstrate the value of
believe the bid was well below the sector its platform with its first few clients.
average (comprising select companies
exposed to online betting, casinos, and
gambling-related technology) of 7.3x,
which justifies why Entain rejected the
offer. Another significant transaction in
the space was Apollo Global
Management’s acquisition of Great
Canadian Gaming (TSX: GC) for $2.9B,
reflecting a 6x EV/Revenue multiple.
©2021 Fundamental Research Corp. “17+ Years of Bringing Undiscovered Investment Opportunities to the Forefront”
Click here to view FRC’s complete list of top picks
PLEASE READ THE IMPORTANT DISCLOSURES AT THE BACK OF THIS REPORTPage 11
Company Ticker Current Share FRC Fair Value Date of PR:
Name: Symbol Price: Estimate:
European TSX: ERE.UN $4.15 $4.91 Dec 15, 2020
Residential
REIT
PR Content FRC Opinion
Entered into an agreement to acquire a Positive – We were pleased with the
98-unit multi-residential property (98% acquisition price, as the implied cap rate of
leased) in the Netherlands for €12.25 4.1% is 5% higher than the portfolio average
million, reflecting a cap rate of 4.1%. cap rate of 3.9%. ERES’ trailing 12-month
The company has made four yield is 3.8%, which is higher than the
acquisitions in H2-2020 totaling €81 average of both European (3.2%) and
million. ERES currently owns 138 multi- Canadian REITs (2.8%). We are projecting a
residential properties, consisting of dividend yield of 3.9% in the next 12 months.
5,949 units in the Netherlands, and two As with most multi-family REITs, ERES’
office properties; one each in Germany occupancy rates and rent collections have not
and Belgium. been impacted by the pandemic. CAPREIT,
(TSX: CAR.UN/market cap – C$9 billion/the
largest residential REIT in Canada) owns
approximately 66% of ERES.
Weekly Cannabis Commentary
Cannabis Industry Performance
December 31, 2020
Company YTD 1-Week 1-Year
Aphria Inc. 35% 0% 30%
Aurora Cannabis Inc. -66% -6% -68%
Canopy Growth Corp. 20% -3% 15%
Cronos Group Inc. -7% -6% -11%
Tilray Inc. -50% -5% -52%
HEXO Corp. -45% -10% -44%
Organigram Holdings Inc. -45% -6% -47%
The Supreme Cannabis Co., Inc. -76% -3% -75%
AVERAGE -29% -5% -32%
MIN -76% -10% -75%
MAX 35% 0% 30%
Indexes YTD 1-Week 1-Year
HMMJ -8% -4% -10%
MCAN 5% -4% 7%
XCAN -33% -5% NA
Source: TMX Money, FRC
©2021 Fundamental Research Corp. “17+ Years of Bringing Undiscovered Investment Opportunities to the Forefront”
Click here to view FRC’s complete list of top picks
PLEASE READ THE IMPORTANT DISCLOSURES AT THE BACK OF THIS REPORTPage 12
Over the past week, the Horizons Marijuana Life Sciences ETF (TSX: HMMJ / “HMMJ”),
the Standard & Poor’s/MX International Cannabis Index (“MCAN”), and the Standard &
Poor’s/TSX Cannabis Index (“XCAN”) generated returns of -4%, -4%, and -5%,
respectively. There were no noteworthy developments in the industry in the past week.
Valuation of Select Canadian LPs
The following chart shows the average Enterprise Value to Revenue (“EV/R”) ratio of
the Canadian cannabis companies we track.
Average EV/R (October 2019 – December 2020)
Dec 24, 2020 Dec 31, 2020
Company Ticker TEV/Revenue TEV/EBITDA TEV/Revenue TEV/EBITDA
Aphria Inc. TSX: APHA 4.8 37.5 4.7 36.1
Aurora Cannabis Inc. TSX: ACB 8.0 NM 7.5 NM
Canopy Growth Corp. TSX: WEED 24.0 NM 22.7 NM
Cronos Group Inc. TSX: CRON 57.0 NM 50.1 NM
Tilray Inc. NASDAQ: TLRY 8.2 NM 7.9 NM
HEXO Corp. NYSE: HEXO 6.0 NM 5.4 NM
Organigram Holdings Inc. TSX: OGI 5.4 NM 5.0 NM
The Supreme Cannabis Co., Inc. TSX: FIRE 3.5 NM 3.4 NM
AVERAGE 14.6 NM 13.3 NM
MEDIAN 7.0 NM 6.4 NM
MINIMUM 3.5 NM 3.4 NM
MAXIMUM 57.0 NM 50.1 NM
Source: S&P Capital IQ, FRC
The average EV/R, as of December 31, 2020, was 13.3x – a WoW decrease from 14.6x.
The average EV/R, from October 7, 2019 to December 31, 2020, was 11.9x.
©2021 Fundamental Research Corp. “17+ Years of Bringing Undiscovered Investment Opportunities to the Forefront”
Click here to view FRC’s complete list of top picks
PLEASE READ THE IMPORTANT DISCLOSURES AT THE BACK OF THIS REPORTPage 13
Canadian Retail Cannabis Pricing
Province (As of 2021/1/4) Average Price per Gram Average Price per Gram THC Average Price per Gram CBD # of Products Min. Price Max. Price
B.C. $ 10.07 $ 10.15 $ 8.42 279 $ 3.93 $ 80.29
Ontario $ 9.73 $ 9.94 $ 8.08 311 $ 4.00 $ 23.98
Quebec $ 9.24 $ 9.21 $ 9.55 217 $ 4.85 $ 15.06
Alberta $ 11.41 $ 11.41 $ 11.39 329 $ 3.93 $ 22.00
N.B. $ 9.66 $ 9.90 $ 7.58 166 $ 3.50 $ 16.28
P.E.I. $ 9.81 $ 9.83 $ 9.49 161 $ 2.20 $ 23.30
Newfoundland $ 10.12 $ 10.08 $ 10.36 155 $ 4.46 $ 15.40
Yukon $ 14.98 $ 15.07 $ 13.95 12 $ 10.49 $ 16.15
N.S. $ 10.39 $ 10.44 $ 9.82 177 $ 5.36 $ 42.85
Nunavut $ 11.69 $ 11.80 $ 12.41 34 $ 5.19 $ 17.91
Northwest Territories $ 11.54 $ 11.54 3 $ 12.08 $ 13.00
Manitoba $ 11.52 $ 11.48 $ 11.62 323 $ 4.90 $ 20.43
Saskatchewan $ 12.80 $ 12.85 $ 12.08 179 4.95 38.50
CANADA $ 11.00 $ 11.05 $ 10.40
Province (As of 2020/12/28) Average Price per Gram Average Price per Gram THC Average Price per Gram CBD # of Products Min. Price Max. Price
B.C. $ 10.06 $ 10.14 $ 8.42 276 $ 3.93 $ 80.29
Ontario $ 9.79 $ 9.99 $ 8.08 312 $ 4.00 $ 23.98
Quebec $ 9.20 $ 9.16 $ 9.55 214 $ 4.85 $ 14.55
Alberta $ 11.40 $ 11.39 $ 11.39 324 $ 3.93 $ 22.00
N.B. $ 9.68 $ 9.92 $ 7.58 166 $ 3.50 $ 16.28
P.E.I. $ 9.81 $ 9.83 $ 9.49 161 $ 2.20 $ 23.30
Newfoundland $ 10.13 $ 10.09 $ 10.36 153 $ 4.46 $ 15.40
Yukon $ 14.98 $ 15.07 $ 13.95 12 $ 10.49 $ 16.15
N.S. $ 10.40 $ 10.45 $ 9.82 176 $ 5.36 $ 42.85
Nunavut $ 11.69 $ 11.80 $ 12.41 34 $ 5.19 $ 17.91
Northwest Territories $ 11.54 $ 11.54 3 $ 12.08 $ 13.00
Manitoba $ 11.53 $ 11.50 $ 11.62 320 $ 4.90 $ 20.43
Saskatchewan $ 12.85 $ 12.91 $ 12.08 176 4.95 38.50
CANADA $ 11.00 $ 11.06 $ 10.40
Source: Online Provincial Cannabis Stores, FRC
The average retail price per gram remained unchanged week-over-week at $11.
The below chart shows Canadian retail dried cannabis flower pricing since we initiated
price coverage.
Canadian Retail Dried Cannabis Flower Pricing
Source: Online Provincial Cannabis Stores, FRC
Canadian Retail Cannabis Stores
As of January 4, 2021, there are 1,421 retail cannabis stores, a week-over-week
increase of 37 stores across Canada; all new stores came from B.C. We note that, due
©2021 Fundamental Research Corp. “17+ Years of Bringing Undiscovered Investment Opportunities to the Forefront”
Click here to view FRC’s complete list of top picks
PLEASE READ THE IMPORTANT DISCLOSURES AT THE BACK OF THIS REPORTPage 14
to the holidays, store count data was not updated on most provincial websites. We
expect to get a more precise update next week.
Nationwide Store Count
Dec-21-2020 Dec-28-2020 Jan-4-2021
Geographic Region Store Count Store Count Store Count Population Population / Store
Alberta 547 547 547 4,428,247 8,096
B.C. 300 300 337 5,120,184 15,193
Manitoba 38 38 38 1,379,121 36,293
N.B. 20 20 20 780,890 39,045
N.S. 20 20 20 978,274 48,914
Newfoundland 27 27 27 520,437 19,275
Northwest Territories 5 5 5 44,982 8,996
Nunavut n/a n/a n/a 39,486 N/A
Ontario 312 322 322 14,745,040 45,792
P.E.I. 4 4 4 158,717 39,679
Quebec 45 46 46 8,552,362 185,921
Saskatchewan 50 50 50 1,181,987 23,640
Yukon 5 5 5 41,293 8,259
CANADA 1,373 1,384 1,421 37,971,020 26,721
Source: Provincial Websites, FRC
©2021 Fundamental Research Corp. “17+ Years of Bringing Undiscovered Investment Opportunities to the Forefront”
Click here to view FRC’s complete list of top picks
PLEASE READ THE IMPORTANT DISCLOSURES AT THE BACK OF THIS REPORTPage 15
Disclaimers and Disclosure
The opinions expressed in this report are the true opinions of the analyst(s) about any companies and industries mentioned. Any
“forward looking statements” are our best estimates and opinions based upon information that is publicly available and that we
believe to be correct, but we have not independently verified with respect to truth or correctness. There is no guarantee that our
forecasts will materialize. Actual results will likely vary. Certain companies mentioned in pages 8-11 are covered by FRC under an
issuer paid model. FRC or companies with related management, and Analysts, may hold shares in some companies mentioned in
this report. Distribution procedure: our reports are distributed first to our web-based subscribers on the date shown on this report
then made available to delayed access users through various other channels for a limited time.
To subscribe for real-time access to research, visit https://www.researchfrc.com/website/subscribe for subscription options.
This report contains "forward looking" statements. Forward-looking statements regarding the Company, industry, and/or stock’s
performance inherently involve risks and uncertainties that could cause actual results to differ from such forward-looking statements.
Factors that would cause or contribute to such differences include, but are not limited to, continued acceptance of the Company's
products/services in the marketplace; acceptance in the marketplace of the Company's new product lines/services; competitive
factors; new product/service introductions by others; technological changes; dependence on suppliers; systematic market risks and
other risks discussed in the Company's periodic report filings, including interim reports, annual reports, and annual information forms
filed with the various securities regulators. By making these forward-looking statements, Fundamental Research Corp. and the
analyst/author of this report undertakes no obligation to update these statements for revisions or changes after the date of this
report.
Fundamental Research Corp DOES NOT MAKE ANY WARRANTIES, EXPRESSED OR IMPLIED, AS TO RESULTS TO BE
OBTAINED FROM USING THIS INFORMATION AND MAKES NO EXPRESS OR IMPLIED WARRANTIES OR FITNESS FOR A
PARTICULAR USE. ANYONE USING THIS REPORT ASSUMES FULL RESPONSIBILITY FOR WHATEVER RESULTS THEY
OBTAIN FROM WHATEVER USE THE INFORMATION WAS PUT TO. ALWAYS TALK TO YOUR FINANCIAL ADVISOR BEFORE
YOU INVEST. WHETHER A STOCK SHOULD BE INCLUDED IN A PORTFOLIO DEPENDS ON ONE’S RISK TOLERANCE,
OBJECTIVES, SITUATION, RETURN ON OTHER ASSETS, ETC. ONLY YOUR INVESTMENT ADVISOR WHO KNOWS YOUR
UNIQUE CIRCUMSTANCES CAN MAKE A PROPER RECOMMENDATION AS TO THE MERIT OF ANY PARTICULAR
SECURITY FOR INCLUSION IN YOUR PORTFOLIO. This REPORT is solely for informative purposes and is not a solicitation or an
offer to buy or sell any security. It is not intended as being a complete description of the company, industry, securities or
developments referred to in the material. Any forecasts contained in this report were independently prepared unless otherwise
stated, and HAVE NOT BEEN endorsed by the Management of the company which is the subject of this report. Additional
information is available upon request. THIS REPORT IS COPYRIGHT. YOU MAY NOT REDISTRIBUTE THIS REPORT WITHOUT
OUR PERMISSION. Please give proper credit, including citing Fundamental Research Corp and/or the analyst, when quoting
information from this report. The information contained in this report is intended to be viewed only in jurisdictions where it may be
legally viewed and is not intended for use by any person or entity in any jurisdiction where such use would be contrary to local
regulations or which would require any registration requirement within such jurisdiction.
©2021 Fundamental Research Corp. “17+ Years of Bringing Undiscovered Investment Opportunities to the Forefront”
Click here to view FRC’s complete list of top picks
PLEASE READ THE IMPORTANT DISCLOSURES AT THE BACK OF THIS REPORTYou can also read