Applying the economic concept of profitability to leaves - Nature
←
→
Page content transcription
If your browser does not render page correctly, please read the page content below
www.nature.com/scientificreports
OPEN Applying the economic concept
of profitability to leaves
Rafael Villar1*, Manuel Olmo1, Pedro Atienza2, Antonio J. Garzón2, Ian J. Wright3,
Hendrik Poorter3,4 & Luis A. Hierro2
Economic principles can be extended to biological organisms as they optimize the use of resources,
but their use in biology has been limited. We applied concepts from traditional economics to the
main production unit of plants, the leaf. We quantified the profitability (profit/cost of investment) of
leaves from seven biomes worldwide and compared those to the profitability of companies. Here we
demonstrate for the first time key similarities and differences between leaf and human economics.
First, there was a weak, but positive relationship between profitability and size, both for leaves and
companies. Second, environment has a strong effect on profitability, with high values in leaves from
biomes with short growth periods and, for companies associated with innovation. Third, shorter
longevity of productive units was related to higher profitability. In summary, by comparing economic
behaviours of plants and humans there is potential to develop new perspectives on plant ecological
strategies and plant evolution.
There are various definitions of economy, which generally revolve around three basic concepts: wealth, exchange
and scarcity. Originally, classical economists defined the economy according to the object of study: wealth, its
origin1, its growth2 and its d
istribution3. Most classical economists proposed free trade as the ideal system for
achieving greater wealth and a more adequate distribution of it. This gives rise to the second concept that has
been used for the definition of economy, exchange. According to B oulding59 “The world of economics is organized
fundamentally by exchange. This relationship, by which each of two parties gives something to the other and receives
something in return, is indeed a powerful social organizer”. Finally, the third concept on which the definitions
of economics have been built is scarcity. In this perspective, economics is “…the science which studies human
behaviour as a relationship between ends and scarce means which have alternative uses”4.
So, to what extent can these concepts be applied fruitfully to plants, to understand their evolution and behav-
iours? A plant acquires its main resources (water, nutrients, light, C O2) in order to ensure growth, survival and
ultimately, reproduction. There have been attempts to understand the economic nature of plant functioning.
Bloom et al.5 introduced the idea to consider the carbon budget of a leaf or plant from an economic perspective,
analysing the commonalities between plants and companies from a theoretical perspective. But so far, there
have been few attempts to take this approach further, despite the widespread use of economic analogies in plant
ecology6–14. In this work we revisit this issue, focusing on scarcity (and the related concept of profitability)—
reporting a comparison of leaf and company economic features, based on a global leaf dataset, and company
data from Spain.
In our view it is the scarcity element that best allows the possibility of assimilating certain plant activities to
economic behaviour. Robbins’ concept cited above proposes that we talk of economics when we refer to human
behaviours guided by an optimizing goal in the use of scarce resources. Our objective is to demonstrate the
feasibility of applying economic concepts to biological processes of plants, not only from a theoretical point
of view, as has already been p roposed5,15, but from an empirical point of view. For this we focus on one of the
most fundamental economic parameters, profitability. In economics, the relevance of profitability is especially
clear. In essence, all economic behaviour is based on the maximization of profit and therefore on p rofitability1,
which is nothing other than relative benefit. It is assumed that any business decision is guided by the objective
of maximizing profitability: investments, changes in the organization of production, actions aimed at reducing
costs or increasing revenue, etc.
In this work we explore the analogies that exist between companies and the simplest productive unit of plants,
the leaf, based on similarities in their structure and f unction5. The company can be analysed from multiple per-
spectives. Bloom et al.5 analysed the analogy plant/company, but considering the perspective of scarcity, the leaf/
1
Area de Ecología, Dpto de Botánica, Ecología y Fisiología Vegetal, Facultad de Ciencias, Universidad de
Cordoba, Cordoba, Spain. 2Departamento de Economía e Historia Económica, Universidad de Sevilla, Sevilla,
Spain. 3Department of Biological Sciences, Macquarie University, North Ryde, NSW 2109, Australia. 4Plant
Sciences (IBG‑2), Forschungszentrum Jülich GmbH, 52425 Jülich, Germany. *email: rafael.villar@uco.es
Scientific Reports | (2021) 11:49 | https://doi.org/10.1038/s41598-020-79709-w 1
Vol.:(0123456789)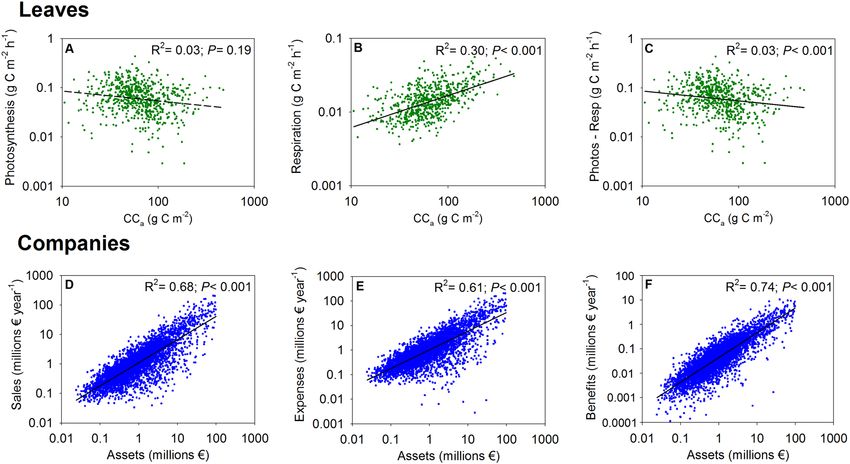
www.nature.com/scientificreports/
Figure 1. Scheme of general economic functioning of leaves and companies. (A) Leaves show similar behaviour
to companies. A leaf acquires different resources (CO2, light, nutrients and water) to synthesize carbohydrates
(C gains) which can be used for maintenance (C expenses) or stored and/or exported to be used in various
ways (transport of compounds to other organs, construction of new organs, etc.) (C investments). The carbon
profit of the leaf will be then the difference between the carbon gains and the carbon expenses. (B) A company
acquires the resources (work, capital and natural resources) through financial investment in activities (expenses)
to make different products that are sold, resulting in gains (sales revenue). The overall financial profit of these
activities will be the difference between the sales and the expenses.
company analogy is also valid (see Supplementary File S1 online for a detailed explanation). Under this perspec-
tive, companies (or leaves) present themselves as organizing entities of production, using the available resources
efficiently for production with the objective to obtain maximum production at minimum cost, maximizing profit
and, consequently, the return on capital invested in it. We must also point out that the use of the leaf/company
analogy for empirical analysis is the most feasible one. The empirical study of the plant/company analogy in
the manner of Bloom et al.5 is difficult because there are so few plant datasets with the necessary whole-plant
information. Fortunately, the versatility of the company concept makes possible the analysis of the leaf/company
analogy since there are extensive databases for both objects of study. We have relatively many leaf-level data
on carbon investments, gains and expenses across their lifetime based on the global data set of leaf economics
spectrum (LES)13. For company data we rely on the ‘Annual Iberian Balance Sheet System’ (SABI) database for
Spanish companies. In summary, as production units there is an analogy between leaves and companies (Fig. 1,
Supplementary Table S1 online).
A company acquires the resources (work, capital and natural resources, including the payments for obtaining
resources and the expenses for assets, such as machinery) through financial investment in activities (expenses) to
make different products that are sold obtaining financial gains (sales revenue). The profit of these activities will be
the difference between the sales and the expenses. Similarly, a leaf acquires different resources (CO2, light, nutri-
ents and water) to synthesize carbohydrates (C gains) which can be used for maintenance (C expenses) or stored
and/or used in various ways (transport of compounds, construction of new organs, etc.)16. The carbon profit of
the leaf will then be the difference between the carbon gains and the carbon expenses. At the very least, leaves
need to assimilate enough carbon during their life time to payback their own investment in construction15,17,18;
and, presumably more than that, payback some proportion of the construction and maintenance costs of stems
and roots19. Further profits are required to ensure positive plant growth, for defence, feeding root symbionts
(which aid in nutrient uptake), and reproduction.
For our analysis we determined the economic profitability of leaves, which is the percentage of investment
in leaf construction obtained as surpluses that can be used to manufacture other leaves or other plant organs,
whether to maintain plant metabolism or to invest in reproduction. In short, it is the profit/cost ratio of invest-
ment. We know of only one study that uses the term “leaf profitability”20, and after that the term has not been
used. Several studies15,21–23 have evaluated the leaf payback time or the minimum leaf longevity, which is the time
that a leaf requires to amortize its construction costs, calculated as the leaf construction cost divided by the leaf ’s
average net daily carbon fixation. Thus, the payback time is similar to the inverse of profitability.
We have used published leaf data for a broad range of species (630 species) covering a wide range of the leaf
economic spectrum (LES13). Wright et al.13 found that leaves with high leaf mass per area (LMA, leaf dry mass per
unit leaf area) have a lower photosynthetic rate per unit leaf mass, but longer leaf l ifespans13,15. We calculated leaf
benefits (photosynthesis) and expenses (maintenance respiration) across the leaf life time. Then, the leaf profit-
ability was calculated as the ratio of profit to cost of investment. Next, we show the estimates of leaf profitability
in relation to leaf size, different environments (biomes) and leaf durability and compare these patterns with those
relative to companies. The comparison with companies is carried out with the purpose to see how the concept
of profitability behaves in the economic reality of the leaf and to verify that there are similarities that allow us to
shed light on a future potentiality of this concept.
Scientific Reports | (2021) 11:49 | https://doi.org/10.1038/s41598-020-79709-w 2
Vol:.(1234567890)
www.nature.com/scientificreports/
We consider that the fundamental advantage of studying leaf profitability with respect to other metrics (pay-
back time, lifetime C balance of a leaf, etc.) is that profitability is a basic concept in economy. The profitability
that we have calculated is an economic concept applied to a biological process, which allows us to determine
a surplus of carbon produced, and which is expressed in relative terms and therefore suitable for comparison.
Nonetheless, we note that this is an initial step; in principle the analysis could be extended to other parts of the
plant, to a plant as a whole, or to each species of a biome or geographic area. The calculation of a relative mag-
nitude such as profitability provides a pathway to asking new research questions, for example: If profitability is
related to biological success or survival, how will environmental changes such as increasing temperatures and
atmospheric CO2 concentration, or altered growing season, affect leaf-level profitability? How much will this vary
between species with different growth forms or phenologies? What are the implications for vegetation composi-
tion and biome boundaries? Introducing an economic approach can provide answers to questions relevant to
biology and allows us to capture part of the methodological arsenal developed by the economy. Obviously, if we
want to apply economic principles to plants it is necessary to calculate the variables that economic models use.
This is a first step to identify variables associated with economic behaviour in plants, facilitating the application
of economic models to plants in future studies.
In summary, the main objective of this study is to know if the concept of profitability can be applied to the
economic reality of the leaf and to verify that there are similarities with companies that allow us to demonstrate
future potential for this approach. For that, we calculated the economic profitability of leaves and companies
and analysed the patterns in relation to size, environment and durability (longevity, lifespan). We hypothesised
that the size of a production unit can influence profitability. For example, a larger size may imply a higher cost
associated with structure; therefore, the changes in profitability will depend on how gains and expenses vary with
size. We also expect that the environment may also have a strong influence on the gains, expenses and profits
of leaves. We also seek to unravel the effect of durability on profitability. It is expected that the longevity of the
systems could have an influence on the economic profitability. Finally, we would like to know which factors can
explain the differences in economic profitability, for example if gains, expenses or assets are related to profitability.
Material and methods
Leaf database and leaf profitability calculations. We have used published leaf-level data for a broad
range of species covering the leaf economic spectrum (LES)13. We focus on four functional leaf traits: (1) leaf
dry mass per area (LMA); (2) photosynthetic rate per leaf area measured under optimal conditions; (3) respi-
ration rate per leaf area; and (4) leaf longevity (LL). Of the 2548 species cases in the LES, only 274 had avail-
able data for all four functional traits. The variable with the lowest number of data was the respiration rate. To
increase the number of cases, we relied on the overall relationship observed between leaf respiration and leaf N
concentration13. Respiration rate per mass was calculated using the following regression equation: Respirationmass
(nmol CO2 g−1 s−1) = 5.43092 + 1.86629 × [Nmass (%)]2 (R2 = 0.65; P < 0.0001) obtained for data of LES where respi-
ration rates and leaf N concentration was measured. Then, respiration per leaf area was calculated by multiplying
respiration rate per mass and LMA. The final database obtained in this way contains 630 species-cases. Leaf size
of the majority of the species was taken from a recently published global dataset24. Here the species were grouped
into seven biomes (alpine, grassland, temperate forest, tropical seasonal forest, tropical rain forest, tundra, and
woodland). The boreal biome was not considered because of the low number of data (only 3). Woody species
were classified according to leaf phenology (deciduous or evergreen).
Leaf benefits (photosynthesis) and expenses (maintenance respiration) during their life time can be calculated
very simply or using more complex calculations, where additional assumptions need to be made (see Supplemen-
tary File S2 online), with the effect of deriving more realistic values of leaf profitability. We present the results
following the more complex approach. In these calculations we considered the changes in benefit and expense
rates depending on the leaf age or changes in environmental c onditions25. Then, the profitability was calculated
as the Internal Rate of Return (IRR) (calculated with the formula of IRR in Excel; see Supplementary File S3
online), defined as the ratio of profit to cost of investment, considering the profit as the difference between life-
time photosynthetic gains and life-time maintenance respiration expenses; and the cost of investment as the leaf
construction costs. We calculated leaf profitability following several different approaches (different age-related
changes in physiological rates or using maximum rates; Supplementary File S2 online) and we found the conclu-
sions were very similar (Supplementary File S4 online). Falster et al.26 also found that the general patterns for
lifetime return of C per unit C invested obtained from simple trait measurements are reliable and commensurate
with those obtained from more detailed modelling of lifetime revenue.
The rate of photosynthesis (CO2-fixation) and respiration (CO2-efflux) were converted to C equivalents and
integrated over 24 h to provide the daily C-gain and C-expense of the leaves, as we explain next. We calculated
the C gain (photosynthesis) and C expenses (respiration) over the lifetime of the leaf, considering a linear decline
of leaf photosynthesis and respiration rates with leaf a ge15,19 and the growing season and daylight hours for the
different biome types (similar to17). To calculate the C gain and C expenses of leaves, we need to know the dura-
tion of photosynthesis within a year that depends of two components: (a) the duration within a day or mean labor
time (m), and (b) the duration of the seasonal period favourable for growth (f)19. We estimate both components
for the different biome types (Supplementary File S2 online). We defined the favorable period as being the set of
consecutive months that satisfied the following conditions: (1) monthly mean 24-h temperature ≥ 5 °C; and (2)
monthly rainfall/evapotranspiration ≥ 0.05, following24. To calculate monthly mean rainfall, temperature and
evapotranspiration of each biome we selected different coordinates (at least 10) along the geographical range of
each biome. Climatic data were obtained using the geovisualization tool for broadcasting climatic data Global Cli-
mate Monitor (http://www.globalclimatemonitor.org), which is based on the CRU TS3.21 version of the Climate
Research Unit (University of East Anglia) database for 1951–2012. In general, favorable period varies strongly
Scientific Reports | (2021) 11:49 | https://doi.org/10.1038/s41598-020-79709-w 3
Vol.:(0123456789)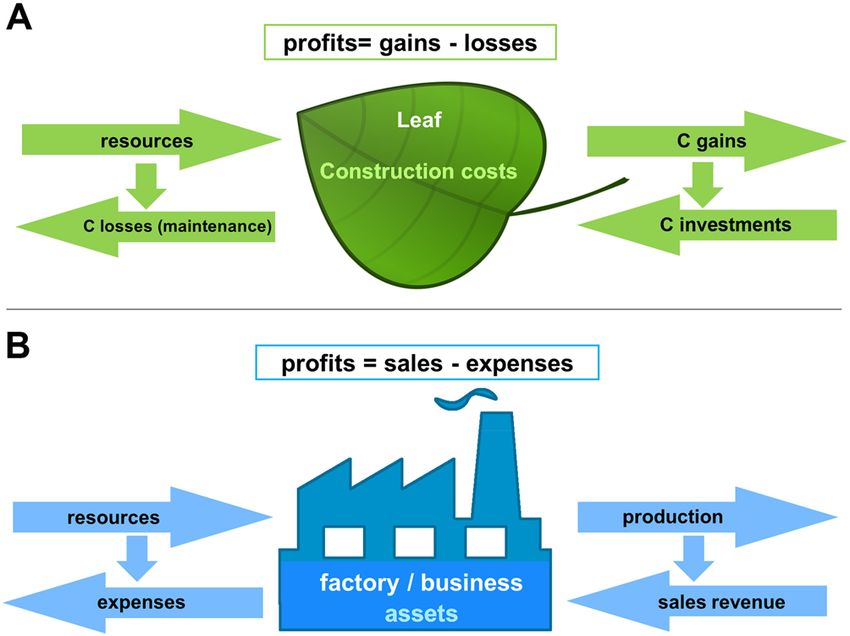
www.nature.com/scientificreports/
with latitude with values of around 90 days for tundra to 364 days for tropical rain forest (Supplementary File
S2 online, Supplementary Table S1 online). The favorable and non-favorable period was calculated as the sum
of days of favorable and non-favorable days, respectively.
The C gains (photosynthesis) and C expenses (respiration) accumulated across the leaf life-span were calcu-
lated following the Eqs. (1 and 2). Kikuzawa15 described a linear decline of leaf photosynthesis and respiration
rates with leaf age. To satisfy this assumption, averages of photosynthesis and respiration rate were calculated
considering it was 50% of the maximum rate. Alternative assumptions of decrease in photosynthetic rate or
respiration rate with leaf age did not change the main conclusions (see Supplementary File S4 online)
(1)
Photosynthesis_Integrated (g C m−2 ) = A g C m−2 h−1 × m h day−1 × f day
(2)
Respiration_Integrated g C m−2 = R g C m−2 h−1 × mr h day−1 × LL
A and R were the rates of photosynthesis and respiration considering 50% of the maximum value to account for
the declining of the rate with the leaf age, m is the duration of the time favorable for photosynthesis within a day
or mean labor time, and f is the duration of favorable period. The number of hours per day for respiration (mr)
was calculated as in Supplementary File S2 online.
The profit accumulated through whole the life of a typical leaf was calculated as the lifetime photosynthetic
gains minus lifetime respiration expenses (Eq. 3). The mean daily profit was calculated as the total profit accu-
mulated divided by the leaf longevity (Eq. 4)
Profit_Integrated (g C m−2 ) = Photosynthesis_Integrated (g C m−2 )−Respiration_Integrated (g C m−2 ) (3)
(4)
Daily profit (g C m−2 day−1 ) = Profit_Integrated (g C m−2 )/leaf longevity day
The internal rate of return (IRR) or profitability of the leaf was calculated with the formula of IRR in Excel (see
Supplementary File S3 online) but it can be simplified in many cases as 100 × daily profit/[C investment in the
construction of the leaf per unit leaf area (CCa)]. The construction cost per unit leaf area is based on the inver-
sion of leaf dry mass per unit leaf area (leaf mass per area, LMA) and the chemical composition of the l eaf27. Leaf
construction cost was calculated based on its known, solid relationship with L MA18. Leaf C
Ca (g glucose m−2) was
calculated as − 8.0105 + 1.6035 × LMA (R2 = 0.97; P < 0.001). Leaf CCa was converted to g C m−2 by multiplying
the g glucose by 0.40 (72 g C in 180 g glucose).
The leaf profitability or internal rate of return (IRR) and the payback time to recover the C investment in the
leaf were calculated as:
Profitability (% day−1 ) = 100 × daily profit (g C m−2 day−1 )/CCa (g C m−2 ) (5)
(6)
Payback time day = CCa (g C m−2 )/Daily profit (g C m−2 day−1 )
To see if our results were affected by our assumptions (specifically, the decline of leaf photosynthetic and
respiration rates with leaf age) we calculated the mean daily profit in different ways (Supplementary File S2
online). We found that these assumptions did not affect the main conclusions (see Supplementary File S4 online).
We calculated the economic profitability of leaves and analysed the patterns in relation to leaf size (one-sided
surface area), environment (biomes) and durability (longevity). We analysed the relationships between variables
with linear regression after log transforming the data. We compared the leaf profitability between biomes and leaf
habits (deciduous and evergreens) using one way analysis of variance. The statistical analyses were performed
using Statistica (v 8.028).
Companies’ database and profitability calculations. Data for companies were obtained from
the ‘Sistema Anual de Balances Ibéricos’ (SABI) database (https://sabi.bvdinfo.com/version-2018119/Login
.serv?Code=InvalidIpAddress&LoginParamsCleared=True&LoginResult=nc&product=sabineo&RequestPat
h=home.serv?product=SabiNeo). The SABI database includes information on book records, descriptive infor-
mation on the company such as size, ownership structure, and financial variables (sales revenue, expenses,
assets, etc.) of 14 years (from 2002 to 2015). We specifically focused on three variables: (1) sales revenue, (2)
profits (EBIT: Earnings Before Interest and Taxes), and (3) assets. The annual expenses were calculated as the
difference between sales revenue and profits. We use this specific database so as not to mix companies from dif-
ferent countries with different accounting systems, as that may affect the results. From this database we selected
the active Spanish companies with data for all the years of the series (88,100 companies). From this population
we extracted a random sample of 7000 companies (the maximum allowable data extraction from this database).
Then, we calculated the mean values of three variables for the 2002–2015 period: (1) sales revenue, (2) expenses,
and (3) assets. Following the definitions of SABI, the annual profit or result of exploitation was calculated as the
difference between mean sales revenue and mean expenses per year. We also use data of NASDAQ and Dow
Jones companies to compare companies with different longevity.
The economic profitability (IRR) was calculated (see Supplementary File S3 online) with the formula of
Internal Rate of Return (IRR) in Excel but it can be simplified in many cases as 100 × annual profit/assets (Eq. 7)
Economic profitability % year−1 = 100×result of exploitation EUR year−1 /total assets(EUR) (7)
Scientific Reports | (2021) 11:49 | https://doi.org/10.1038/s41598-020-79709-w 4
Vol:.(1234567890)www.nature.com/scientificreports/
Subsequently, we eliminated companies with negative economic profitability and companies with extreme
values as identified by a procedure in the SPSS Statistics program (v.24). The extreme values (VE) are those that
meet the following condition: Q 1—3RQ > VE > Q3 + 3RQ, Q1 and Q 3 being the quartiles 1 and 3, respectively, of
the distribution of a sample, and RQ being the interquartile range (RQ = Q3—Q1). From the initial sample of 7000
companies, 2200 companies were eliminated since part of the sample years included the global economic crisis,
during which many companies showed losses and, therefore, negative economic profitability.
The statistical analyses were done for all the companies, and also separately for those with assets lower than
100 × 106 €, as these comprise the majority of companies (99.7%) and to avoid bias from considering the bigger
companies. In any case, the results were very similar.
For the comparison between NASDAQ and Dow Jones companies in relation to different longevity we roughly
estimated the profitability of the two types of companies by calculating the average growth rate of the value of
each of the stock indices for the period 1971–2015 in real terms (i.e. by deducting the growth of prices every
year). For that we log-transform the data and calculate the slope of the relationship of Log (stock indices) versus
time, giving values of relative growth rate (Supplementary File S6 online).
We analysed the relationships between variables by linear regression after log transforming the data. We
compared the profitability of companies of (a) different economic sectors and (b) being NASDAQ or Dow Jones,
using one factor analysis of variance. The statistical analyses were performed using Statistica (v 8.028) and IBM
SPSS Statistics (v.24).
Results and discussion
Leaf profitability. We calculated the economic profitability of leaves and analysed the patterns in relation
to leaf size, environment and durability (longevity). There was wide variation in leaf profitability with a mean
value (± SD) of 3.4 ± 3.5% day−1 and 5th/95th percentile range of 0.29–10.3% day−1. There are no previous stud-
ies reporting leaf profitability values for direct comparison, but they can be re-calculated based on published
values for leaf payback time. For example, Williams et al.21 reported payback time values in several Piper species
from a Mexican rainforest, corresponding to leaf profitability values between 0.01 and 33% day−1. Poorter et al.23
calculated payback times corresponding to leaf profitability values of 1.25–50% day−1 , depending on species
type, light environment, and growth conditions (very high values were observed for seedlings grown under
non-limiting, hydroponic conditions). The mean values of our study are lower, but in line with values calculated
from payback time of Kikuzawa and L echowicz25 (2.2 ± 2% day−1), because they consider the mean labour time
and the favourable period length, as we also applied in our calculations (see “Methods” and Supplementary File
S2 online).
One factor that could influence profitability is the size of a production unit. For example, a large leaf may
imply a higher cost required for structural support; therefore, the changes in profitability will depend on how
gains and expenses vary with size. As it turned out, we found that leaf profitability was positively related to leaf
size (Fig. 2A), but the percentage of variance explained was not especially high ( R2 = 0.07, P < 0.001).
Higher benefits have been suggested for species with large leaves, for example species with larger leaves tend
to deploy branches with a higher ratio of leaf area to stem dry m ass29, which itself could be associated with a
higher growth rate24,30 and therefore profitability. However, there are also disadvantages for species with large
leaves, for example, higher within-leaf support costs reflected in their higher leaf mass per area (LMA)29,31,32,
and more structural and less metabolic t issue32,33, or an increased risk of overheating or frost d amage24. Con-
34
sidering global data of many species, Diaz et al. did not find a strong relationship between leaf size and either
LMA or leaf N concentration, both of which are related to photosynthetic gain13,34, suggesting that there is no
general advantage for a bigger leaf size (but see35). Here we assessed the issue more directly, concluding that a
meaningful benefit is evident.
The environment may also have a strong influence on the gains, expenses and profits of leaves16. We found
that leaf profitability varied among biomes (which differ in environmental conditions), with maximum values
in the alpine and grasslands biomes and minimum in the woodland biome (Fig. 2B). The high profitability of
alpine and grasslands could be related to the short period the leaf is functionally active, thus leaves must be highly
profitable to payback the construction cost. Also, most species from alpine and grasslands are herbs and grasses
with high photosynthetic rates and low LMA13,36, and this may explain the higher profitability. In the case of
the woodlands and tropical rain forest the main cause of their low leaf profitability could be the more constant
environment that favors evergreen s pecies15 which generally have higher LMA and lower photosynthetic r ates13,36.
We also wanted to unravel the effect of durability on profitability. It is expected that the longevity of the sys-
tems could have an influence on the economic profitability. We expect that entities with short longevity should
have a higher economic profitability. For example, leaves with a short longevity (e.g. deciduous leaves) have
high photosynthetic gains per unit of leaf dry mass and low L MA13,36,37 together with a low construction cost
18,27
per leaf area that could result in higher profitability compared with evergreens. Indeed, we found that leaf
profitability was significantly related to the leaf durability, with higher profitability for deciduous compared with
evergreen leaves (Fig. 2C). Eamus38 also found a lower payback time for deciduous compared with evergreens,
which indicates a higher profitability of the deciduous leaf habit.
Finally, we want to know which factors can explain the differences in leaf economic profitability, for example if
gains (photosynthesis), expenses (maintenance respiration) or assets (investment in construction) are related to
profitability. Our results indicate that leaf profitability was strongly positively related to C-gain by photosynthesis
(R2 = 0.75, P < 0.001; Fig. 3A) and negatively related to the leaf construction cost per leaf area (CCa, R2 = 0.51,
P < 0.001; Fig. 3C).
Comparing leaves that developed in either low or high light, Poorter et al.23 found that the variable having
strongest impact on payback time (the inverse of leaf profitability) was LMA, which is directly related to the
Scientific Reports | (2021) 11:49 | https://doi.org/10.1038/s41598-020-79709-w 5
Vol.:(0123456789)www.nature.com/scientificreports/
Figure 2. Profitability of leaves and companies in relation to size, environment and durability. For leaves,
(A) relationships of profitability and leaf size, (B) comparison of leaf profitability in different biomes and
(C) leaf profitability of two different leaf habits (deciduous, short leaf life-span and evergreen, long leaf life-
span). Biomes: Alpine, Grasslands, Tundra, Tropical seasonal forest (Trop. F.), Temperate forest (Temp. F.),
Tropical rain forest (Trop. RF.), Woodland. For companies, (D) relationships of profitability and company size
(number of employees), (E) comparison of profitability of the different economic sectors (see codes below)
and (F) average growth rates (similar to profitability) between different types of companies according to
technology: NASDAQ companies (technology companies, short-term longevity); and Dow Jones companies
(traditional companies, high longevity). Growth rates were calculated as the slope of the trend of market value
(see Supplementary File S6 File). Economic sectors: Education, health and social services (Ed., H. & Soc.),
Professional, scientific and technical activities (Sci. & Technol.), Artistic, recreational activities and other
services (Art. & Recr.), Information and communication and financial and insurance activities (Financ.),
Administrative activities and auxiliary services (Admin.), Transportation and storage (Transpt.), Real estate
activities (R.E.), Hostelry (Host.), Manufacturing, extractive industries and energy and water supply (Mnfg.
& extr.), Retail and wholesale trade and repair of motor vehicles (Motor), Primary (Primary), Construction
(Constr.). The box in each plot shows the median and the lower and upper quartile, and the whiskers show the
10 and 90th percentiles.
construction cost per a rea18. Also, leaf profitability was negatively related to the C expenses due to maintenance
respiration (R2 = 0.03, P < 0.001; Fig. 3B), but notably more weakly than were assets (CCa) or photosynthetic
gains. Therefore, the predictions of K ikuzawa15 related to the effects of C gains and C costs on payback time (the
inverse of profitability) are confirmed by our results.
The high variability in leaf profitability between different species leads us to ask why species with high leaf
profitability are not more abundant. First, there is the question whether leaf profitability is related to whole-
plant profitability. From the scarce data available (24 species, from9,39) we calculated the profitability of whole
plants considering the expenses on construction and maintenance of stems and roots and found that it was
lower (20 ± 7.3% day−1) compared to profitability of leaf (40 ± 11.4% day−1), but both profitabilities were strongly
correlated (R2 = 0.74, P < 0.001, Supplementary File S5 online) and also positively correlated to relative growth
rate (RGR) ( R2 = 0.53, P < 0.0001 for leaf profitability; R
2 = 0.83, P < 0.001 for plant profitability, Supplementary
File S5 online). Therefore, we consider our values of leaf profitability to be a reliable indicator of profitability in
a broad sense. One reason why there is a wide variation in leaf profitability may be that high profitability only
is possible under certain conditions, which are very constrained in space or time—e.g. biomes with very short
Scientific Reports | (2021) 11:49 | https://doi.org/10.1038/s41598-020-79709-w 6
Vol:.(1234567890)www.nature.com/scientificreports/
Figure 3. Factors related to leaf and company profitability. For leaves, relationships of profitability with (A)
photosynthesis gains; (B) respiration expenses and (C)construction cost per leaf area ( CCa). For companies,
relationships of profitability with (D) sales; (E) expenses and (F) assets.
growth season (alpine, tundra); deciduous leaf strategies; etc. The high potential profitability of leaves from
arctic and alpine regions may be seen not only as insurance for high probability of suboptimal conditions for
the photosynthesis but also necessity for accumulation of storage for winter survival. Also, among co-occurring
species, time-discounting11 equalises different LMA strategies when considered over the life of the investment.
Other reasons could be the existence of trade-offs which may also imply that a high leaf profitability has some
disadvantages as for example, leaves with high profitability (low LMA, high leaf N, etc.) tend to suffer higher
erbivory36 or operate at higher risk under drought40.
rates of h
Comparisons between leaf and company. Are the results of the leaf profitability analyses similar to
those of companies? To answer this question, we conducted a similar analysis for a reference group of 4722 com-
panies in Spain from ‘Sistema de Análisis de Balances Ibéricos’ (SABI)-database and we also use data of NASDAQ
and Dow Jones companies to unravel the effect of different longevity. We calculated the economic profitability
of companies and analysed the patterns in relation to company size, environment (type of sector) and durability,
just as we did for leaves.
Mean values of company profitability were 5.3 ± 5.8% year−1 with a range of 0.41–15.5% year−1 (percentile 5
and 95%, respectively). It is noteworthy that the values of company profitability are much lower (average values
of 5% year−1) than those for leaves (average values around 3.4% day−1) (please note that profitability for com-
panies is by year, but for leaves is by day). The high values of leaf profitability can be due to the fact that they
have to bear the costs of construction and maintenance of stems and r oots41 and since the proportion of leaves
respect to total biomass is usually low (around 5% under field conditions)42, leaves should be highly profitable
to maintain the plant expenses.
We found a weak positive relationship between profitability and company size (measured by number of
employees; Fig. 2D). Preliminary studies43,44 found that size (measured by assets or sales volume) had a posi-
tive influence on profitability, which they attributed to the market power of larger companies. However, later
studies45,46 considered that intrinsic factors of the company predominantly explained the differences in profit-
ability and that size is not relevant.
Whereas we analysed plant data with respect to biomes, in the case of companies we used sector type as a
proxy for the environment, since it describes the market conditions in which companies must survive. As in the
case of leaves, there were differences by economic sector (Fig. 2E), as previously reported by S chmalenesee47 and
Wernerfelt and M ontgomery48. The sectors of education, health, social and the scientific and technical sector had
higher profitability (around 7% year−1), whereas the construction and primary industry sectors had the lowest.
This difference is related to the role of i nnovation49–52 and the use of human c apital53–55, and it is due to higher
sales margins (they sell at higher prices). The innovator has a period of monopolistic gain before the imitators
enter the market, and while they get e stablished56.
Scientific Reports | (2021) 11:49 | https://doi.org/10.1038/s41598-020-79709-w 7
Vol.:(0123456789)www.nature.com/scientificreports/
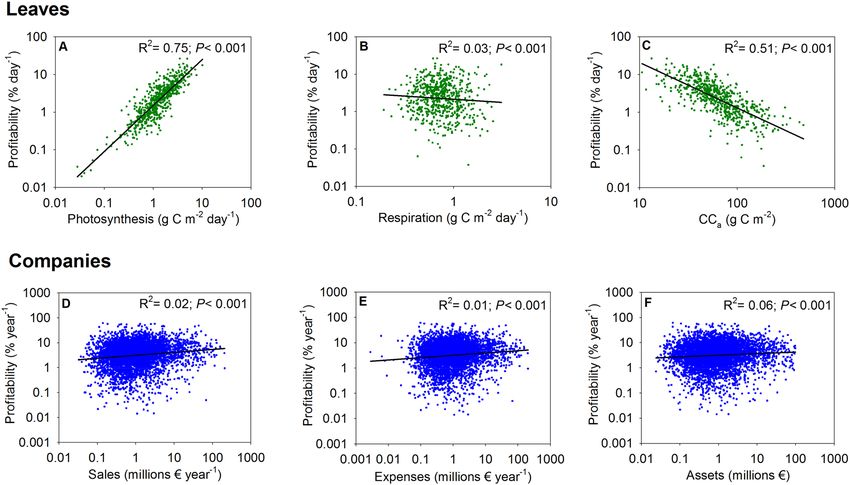
Figure 4. Relationships of (A) photosynthesis, (B) respiration and (C) benefits (photosynthesis-respiration)
with construction cost per unit leaf area (CCa) for leaves. Relationships of (D) sales, (E) expenses and (F)
benefits with assets for companies.
It is difficult to find a mechanism to compare plants and companies in relation to longevity. Companies,
unlike leaves, do not have a genetically predetermined longevity; therefore, they are not classifiable according
to intrinsic factors such as life-span. Since technology companies have a shorter longevity57, we could draw a
parallel between NASDAQ companies (technology companies) and deciduous leaves, and between Dow Jones
companies and evergreens leaves, to establish a comparison. We calculated the relative growth rate of the stock
market capitalization for both types of companies (Supplementary File S6 online). We found that NASDAQ
companies, like deciduous leaves, showed a higher profitability (measured as stock market capitalization rate)
than those of Dow Jones (Fig. 2F), as a consequence of the greater risk that the investor supports58.
Unlike the case of the leaves, company profitability was not well explained by any of the other variables con-
sidered: sales ( R2 = 0.02, P < 0.001; Fig. 3D), expenses ( R2 = 0.01, P < 0.001; Fig. 3E) or assets (R2 = 0.06, P < 0.01;
Fig. 3F).
Statistically, the different results between leaves and companies can be understood because for leaves
photosynthetic gains were unrelated to construction cost per leaf area ( CCa) (Fig. 4A), whereas respiration
expenses were positively related to C Ca (Fig. 4B), meaning that overall benefits (photosynthetic gains—respira-
tory expenses) were negatively related to C Ca (Fig. 4C). Thus, leaf profitability was negatively related to assets
(CCa) (Fig. 3C). However, in the case of the companies there is a direct relationship between benefits and assets
(with a slope of 1), since sales and expenses vary proportionally in similar amounts with the volume of assets
(Figs. 4D–F). Therefore, the ratio of benefits/assets (profitability) became very constant and it is not well cor-
related with assets (R2 = 0.06, Fig. 3F).
The disparity between the results of the leaf economy and the companies is surprising a priori. However,
from an economic point of view, this disparity can be understood as logical. In human economics, the resources
migrate constantly from the less profitable companies to the more profitable ones3. Markets are in a permanent
process of adjusting to equilibrium at a single rate of return through exchange, but they are also affected by a
permanent innovative process of the companies that separate them from that e quilibrium56. Conversely, it is
not feasible for a plant to transfer part of its resources to another that is more productive (except for example for
clonal plants). Leaf profitability depends, in addition to the available resources, on its genetically predetermined
structure. There is no exchange and there is no adjustment towards a single rate of return. This difference may
explain the contrasting results (Fig. 3A–C compared with Figs. 3D–F).
Boulding59 states that "The world of economics is fundamentally organized by exchange". This role of exchange,
typical of the social facet of the human being, will always make a difference between plants and human beings.
However, the plants are optimizing subjects and have economic behaviours in the sense of the Robbins definition.
Therefore, identifying measurable variables of these processes, as we do in this work, broadens our perspective
and may open unexplored paths in our study on issues in which the optimizing behaviour of plants is evident,
e.g. accumulation of resources, growth, and limits to growth, etc. In the age of breaking of disciplinary l imits60,
we think that it is possible to extract advances in knowledge if we analyse the economic behaviour of plants.
Scientific Reports | (2021) 11:49 | https://doi.org/10.1038/s41598-020-79709-w 8
Vol:.(1234567890)www.nature.com/scientificreports/
We argue that the calculation and use of profitability at leaf and plant level can be a useful tool for understand-
ing plant strategies, the success in certain environments and plant evolution. Profitability at the level of human
economics is an essential and indisputable variable for understanding the economy and applying economic mod-
els. We have used the analogy between the company and the leaf and we have analysed similar trends that arise
in relation to size, environment and durability. Therefore, the application of this variable in the context of plant
functioning will facilitate conceptual advances and new understanding of plant evolution and ecological function.
Data availability
The datasets generated and analysed during the current study are available from the corresponding author on
reasonable request.
Received: 13 August 2020; Accepted: 7 December 2020
References
1. Smith, A. An Inquiry Into the Nature and Causes of the Wealth of Nations. (W. Strahan & T. Cadell, London, 1776).
2. Malthus, T. An Essay on the Principle of Population; or, a View of Its Past and Present Effects on Human Happiness; with an Enquiry
into our Prospects Respecting the Future Removal or Mitigation of the Evils Which it Occasions. (J. Johnson, London, 1798).
3. Ricardo, D. On the Principles of Political Economy and Taxation (John Murray, London, 1817).
4. Robbins, L. An Essay on the Nature and Significance of Economic Science (MacMillan & Co. Ltd., London, 1932).
5. Bloom, A. J., Chapin, F. S. III. & Mooney, H. A. Resource limitation in plants-an economic analogy. Annu. Rev. Ecol. Syst. 16,
363–392 (1985).
6. Givnish, T. J. On the Economy of Plant Form and Function Vol. 6 (Cambridge University Press, Cambridge, 1986).
7. Harper, J. L. The value of a leaf. Oecologia 80, 53–58 (1989).
8. Chapin, F. S. III., Schulze, E. D. & Mooney, H. A. The ecology and economics of storage in plants. Annu. Rev. Ecol. Syst. 21, 423–447
(1990).
9. Poorter, H., Remkes, C. & Lambers, H. Carbon and nitrogen economy of 24 wild species differing in relative growth rate. Plant
Physiol. 94, 621–627 (1990).
10. Atkin, O. K., Botman, B. & Lambers, H. The relationship between the relative growth rate and nitrogen economy of alpine and
lowland Poa species. Plant. Cell Environ. 19, 1324–1330 (1996).
11. Westoby, M., Warton, D. & Reich, P. B. The time value of leaf area. Am. Nat. 155, 649–656 (2000).
12. Wright, I. J., Reich, P. B. & Westoby, M. Least-cost input mixtures of water and nitrogen for photosynthesis. Am. Nat. 161, 98–111
(2002).
13. Wright, I. J. et al. The worldwide leaf economics spectrum. Nature 428, 821–827 (2004).
14. Prentice, I. C., Dong, N., Gleason, S. M., Maire, V. & Wright, I. J. Balancing the costs of carbon gain and water transport: Testing
a new theoretical framework for plant functional ecology. Ecol. Lett. 17, 82–91 (2014).
15. Kikuzawa, K. A cost-benefit analysis of leaf habit and leaf longevity of trees and their geographical pattern. Am. Nat. 138, 1250–1263
(1991).
16. Lambers, H., Chapin, F. S. III. & Pons, T. L. Plant Physiological Ecology (Springer Science & Business Media, New York, 2008).
17. Givnish, T. J. Adaptation to sun and shade: A whole-plant perspective. Funct. Plant Biol. 15, 63–92 (1988).
18. Villar, R. & Merino, J. Comparison of leaf construction costs in woody species with differing leaf life-spans in contrasting ecosys-
tems. New Phytol. 151, 213–226 (2001).
19. Kikuzawa, K., Seiwa, K. & Lechowicz, M. J. Leaf longevity as a normalization constant in allometric predictions of plant produc-
tion. PLoS ONE 8, e81873 (2013).
20. Jurik, T. W. & Chabot, B. F. Leaf dynamics and profitability in wild strawberries. Oecologia 69, 296–304 (1986).
21. Williams, K., Field, C. B. & Mooney, H. A. Relationships among leaf construction cost, leaf longevity, and light environment in
rain-forest plants of the genus Piper. Am. Nat. 133, 198–211 (1989).
22. Sobrado, M. A. Cost-benefit relationships in deciduous and evergreen leaves of tropical dry forest species. Funct. Ecol. 5, 608–616
(1991).
23. Poorter, H. et al. Construction costs, chemical composition and payback time of high-and low-irradiance leaves. J. Exp. Bot. 57,
355–371 (2005).
24. Wright, I. J. et al. Global climatic drivers of leaf size. Science 357, 917–921 (2017).
25. Kikuzawa, K. & Lechowicz, M. J. Toward synthesis of relationships among leaf longevity, instantaneous photosynthetic rate, lifetime
leaf carbon gain, and the gross primary production of forests. Am. Nat. 168, 373–383 (2006).
26. Falster, D. S. et al. Lifetime return on investment increases with leaf lifespan among 10 Australian woodland species. New Phytol.
193, 409–419 (2012).
27. Poorter, H. & Villar, R. The fate of acquired carbon in plants: chemical composition and construction costs. In Plant Resource
Allocation (eds Bazzaz, F. A. & Grace, J.) 39–72 (Academic Press, San Diego, 1997).
28. Statsoft, I. N. C. STATISTICA (data analysis software system). Version 8 (Tulsa, USA, 2007).
29. Pickup, M., Westoby, M. & Basden, A. Dry mass costs of deploying leaf area in relation to leaf size. Funct. Ecol. 19, 88–97 (2005).
30. Gray, E. F. et al. Leaf: Wood allometry and functional traits together explain substantial growth rate variation in rainforest trees.
AoB Plants 11, plz024 (2019).
31. Shipley, B. Structured interspecific determinants of specific leaf area in 34 species of herbaceous angiosperms. Funct. Ecol. 9,
312–319 (1995).
32. Milla, R. & Reich, P. B. The scaling of leaf area and mass: the cost of light interception increases with leaf size. Proc. R. Soc. B Biol.
Sci. 274, 2109–2115 (2007).
33. Niinemets, Ü., Portsmuth, A. & Tobias, M. Leaf size modifies support biomass distribution among stems, petioles and mid-ribs
in temperate plants. New Phytol. 171, 91–104 (2006).
34. Díaz, S. et al. The global spectrum of plant form and function. Nature 529, 167–171 (2016).
35. Niklas, K. J. et al. “Diminishing returns” in the scaling of functional leaf traits across and within species groups. Proc. Natl. Acad.
Sci. 104, 8891–8896 (2007).
36. Poorter, H., Niinemets, Ü., Poorter, L., Wright, I. J. & Villar, R. Causes and consequences of variation in leaf mass per area (LMA):
A meta-analysis. New Phytol. 182, 565–588 (2009).
37. Givnish, T. J. Adaptive significance of evergreen vs. deciduous leaves: Solving the triple paradox. Silva Fenn. 36, 703–743 (2002).
38. Eamus, D. Ecophysiological traits of deciduous and evergreen woody species in the seasonally dry tropics. Trends Ecol. Evol. 14,
11–16 (1999).
39. Poorter, H. & Remkes, C. Leaf area ratio and net assimilation rate of 24 wild species differing in relative growth rate. Oecologia 83,
553–559 (1990).
Scientific Reports | (2021) 11:49 | https://doi.org/10.1038/s41598-020-79709-w 9
Vol.:(0123456789)www.nature.com/scientificreports/
40. Bongers, F. J., Olmo, M., Lopez-Iglesias, B., Anten, N. P. R. & Villar, R. Drought responses, phenotypic plasticity and survival of
Mediterranean species in two different microclimatic sites. Plant Biol. 19, 386–395 (2017).
41. Kikuzawa, K. & Ackerly, D. Significance of leaf longevity in plants. Plant Species Biol. 14, 39–45 (1999).
42. Poorter, H. et al. Biomass allocation to leaves, stems and roots: Meta-analyses of interspecific variation and environmental control.
New Phytol. 193, 30–50 (2012).
43. Simon, L. J. Size, strength and profit. Proc. Casualty Actuar Soc. Casualty Actuar. Soc. Arlington VA 49, 41–48 (1962).
44. Hall, M. & Weiss, L. Firm size and profitability. Rev. Econ. Stat. 49, 319–331 (1967).
45. Rumelt, R. P. How much does industry matter?. Strateg. Manag. J. 12, 167–185 (1991).
46. McGahan, A. M. & Porter, M. E. How much does industry matter, really?. Strateg. Manag. J. 18, 15–30 (1997).
47. Schmalensee, R. Do markets differ much?. Am. Econ. Rev. 75, 341–351 (1985).
48. Wernerfelt, B. & Montgomery, C. A. Tobin’s q and the importance of focus in firm performance. Am. Econ. Rev. 78, 246–250 (1988).
49. Geroski, P. & Machin, S. Do innovating firms outperform non-innovators?. Bus. Strateg. Rev. 3, 79–90 (1992).
50. Wheelwright, S. C. & Clark, K. B. Revolutionizing Product Development: Quantum Leaps in Speed, Efficiency, and Quality (Simon
and Schuster, New York, 1992).
51. Brown, S. L. & Eisenhardt, K. M. Product Innovation as Core Capability: The Art of Dynamic Adaptation (Stanford University,
Stanford, 1995).
52. Geroski, P. & Machin, S. Think again: Do innovating firms outperform non-innovators?. Bus. Strateg. Rev. 24, 82–86 (2013).
53. Bontis, N. Intellectual capital: An exploratory study that develops measures and models. Manag. Decis. 36, 63–76 (1998).
54. Bontis, N., Keow, W. C. C. & Richardson, S. Intellectual capital and business performance in Malaysian industries. J. Intellect. Cap.
1, 85–100 (2000).
55. Cabrita, M. R. & Bontis, N. Intellectual capital and business performance in the Portuguese banking industry. Int. J. Technol. Manag.
43, 212–237 (2008).
56. Schumpeter, J. A. The theory of economic development. Trans. Publ. New Brun Swick New Jersey 117, 118 (1912).
57. Audretsch, D. B. Innovation, growth and survival. Int. J. Ind. Organ. 13, 441–457 (1995).
58. Knight, F. H. Risk, Uncertainty and Profit (Houghton-Mifflin, Boston, 1921).
59. Boulding, K. E. Towards a pure theory of threat systems. Am. Econ. Rev. 53, 424–434 (1963).
60. Gowdy, J. M. & Carbonell, A. F. Toward consilience between biology and economics: The contribution of Ecological Economics.
Ecol. Econ. 29, 337–348 (1999).
Acknowledgements
This study was funded by the Spanish MEC coordinated project DIVERBOS (CGL2011-30285-C02-01 and C02-
02), ECO-MEDIT (CGL2014-53236-R), the Life + Biodehesa Project (11/BIO/ES/000726), the project Ecología
funcional de los bosques andaluces y predicciones sobre sus cambios futuros (For-Change) (UCO-27943) by Junta
de Andalucía (Spain), the project Funcionalidad y servicios ecosistémicos de los bosques andaluces y normarroquíes:
relaciones con la diversidad vegetal y edáfica ante el cambio climático by Ayudas a la I+D del Plan Andaluz de
Investigación, Desarrollo e Innovación (PAIDI 2020), Junta de Andalucía (Spain) and European FEDER funds.
IJW acknowledges the support of the Australian Research Council (DP170103410).
Author contributions
R.V., L.A.H., M.O., P.A., I.W. and H.P. designed the study. M.O., P.A. and R.V. performed the data analyses.
All authors interpreted the results. R.V., L.A.H. and M.O. drafted the manuscript. All authors reviewed the
manuscript.
Competing interests
The authors declare no competing interests.
Additional information
Supplementary Information The online version contains supplementary material available at https://doi.
org/10.1038/s41598-020-79709-w.
Correspondence and requests for materials should be addressed to R.V.
Reprints and permissions information is available at www.nature.com/reprints.
Publisher’s note Springer Nature remains neutral with regard to jurisdictional claims in published maps and
institutional affiliations.
Open Access This article is licensed under a Creative Commons Attribution 4.0 International
License, which permits use, sharing, adaptation, distribution and reproduction in any medium or
format, as long as you give appropriate credit to the original author(s) and the source, provide a link to the
Creative Commons licence, and indicate if changes were made. The images or other third party material in this
article are included in the article’s Creative Commons licence, unless indicated otherwise in a credit line to the
material. If material is not included in the article’s Creative Commons licence and your intended use is not
permitted by statutory regulation or exceeds the permitted use, you will need to obtain permission directly from
the copyright holder. To view a copy of this licence, visit http://creativecommons.org/licenses/by/4.0/.
© The Author(s) 2021
Scientific Reports | (2021) 11:49 | https://doi.org/10.1038/s41598-020-79709-w 10
Vol:.(1234567890)You can also read