April 2021 - Gay-Lussac Gestion

Page created by Alexander Stevenson
 
CONTINUE READING
April 2021 - Gay-Lussac Gestion
MONTHLY
REPORTING

   April 2021
April 2021 - Gay-Lussac Gestion
Gay-Lussac Microcaps
                                                                                                                                                                                    April 2021
GENERAL INFORMATIONS
                                                                                                  Performances and statistics on the 31 of March 2021
Custodian                                Société Générale
Cut off                        Subscriptions/redemptions            400                                                                                                                                            +290,6%
ISIN code (A share)                        FR0010544791                                             Gay-Lussac Smallcaps                              MSCI Europe Micro TR - Base 100
                                                                    370
ISIN code (I share)                         FR0011672757                1
                                                                    340
ISIN code (H share)                         FR0013392115             0,9
                                                                    310
ISIN code (R share)                        FR0013430550              0,8
                                                                    280                                                                                                                                            +167,3%
Valuation                                              Daily         0,7
                                                                    250
Management fees A share              2,34% of Net assets            220
                                                                     0,6
Management fees I and H               1,20% of Net assets           190
shares                                                               0,5
                                                                    160
Management fees R share                1.60%of Net assets            0,4
                                                                    130
Performance fees (High            12% including tax of the           0,3
                                                                    100
Water Mark)                          annual perf over 7%             0,2
                                                                     70
Entry fees                                   2% maximum              40
                                                                      0,1                                                                                                                              0,0
                                                                                                                                                                                                       0,0
Exit fees (UCITS acquired)                            None             12/07    12/08     12/09     12/10     12/11     12/12      12/13      12/14        12/15    12/16         12/17     12/18       12/19      12/20
NAV (A share)                                    585,93€               0

                                                                           janv.-00
                                                                           janv.-00
                                                                           janv.-00
                                                                           janv.-00
                                                                           janv.-00
                                                                           janv.-00
                                                                           janv.-00
                                                                           janv.-00
                                                                           janv.-00
                                                                           janv.-00
                                                                           janv.-00
                                                                           janv.-00
                                                                           janv.-00
                                                                           janv.-00
                                                                           janv.-00
                                                                           janv.-00
                                                                           janv.-00
                                                                           janv.-00
                                                                           janv.-00
                                                                           janv.-00
                                                                           janv.-00
                                                                           janv.-00
                                                                           janv.-00
                                                                           janv.-00
                                                                           janv.-00
                                                                           janv.-00
                                                                           janv.-00
                                                                           janv.-00
                                                                           janv.-00
                                                                           janv.-00
                                                                           janv.-00
                                                                           janv.-00
                                                                           janv.-00
                                                                           janv.-00
                                                                           janv.-00
                                                                           janv.-00
                                                                           janv.-00
                                                                           janv.-00
                                                                           janv.-00
                                                                           janv.-00
                                                                           janv.-00
                                                                           janv.-00
                                                                           janv.-00
                                                                           janv.-00
                                                                           janv.-00
                                                                           janv.-00
                                                                           janv.-00
                                                                           janv.-00
                                                                           janv.-00
                                                                           janv.-00
                                                                           janv.-00
                                                                           janv.-00
                                                                           janv.-00
                                                                           janv.-00
                                                                           janv.-00
                                                                           janv.-00
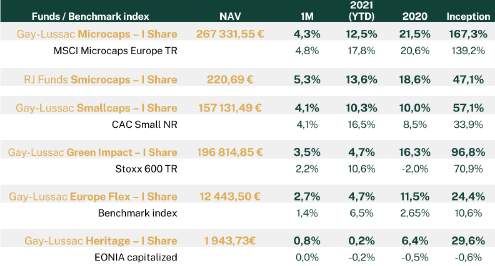
NAV (I share)                                267 331,55€                              Gay-Lussac Microcaps - A Share - Index 100                                    MSCI Europe Micro TR - Index 100
NAV (H share)                                $ 164 195,06
NAV (R share)                                      145,11€                                 1M        2021       2020        2019        2018          2017         2016          2015           2014        Inception
Inception date (A share)                        17-dec-07
Inception date (I share)                         31-dec-13                 A Share        4,2%       12,2%      20,6%      21,7%       -12,1%         21,2%        16,8%         14,7%          6,0%        290,6%
Inception date (H share)                          4-feb-19
                                                                        MSCI Europe
Inception date (R share)                            1-jul-19              Micro
                                                                                          4,6%       17,4%      19,4%      18,2%      -14,3%          17,5%        10,7%         14,5%          0,9%         102,3%
Net assets                                     109,98 M€                MSCI Europe
                                                                                          4,8%       17,8%      20,6%      20,4%       -12,9%         19,4%        12,7%         16,4%          2,5%         155,4%
                         Gay-Lussac                                      Micro TR
                                         MSCI MICRO
                          Microcaps
    Volatility 3Y           12,13%          19,00%                         I Share        4,3%       12,5%      21,5%      23,1%       -11,1%        22,4%         17,9%         16,1%          6,6%         167,3%
                                                                        MSCI Europe
 Max Drawdown 3Y            -26,99%         -37,16%                       Micro
                                                                                          4,6%       17,4%      19,4%      18,2%      -14,3%          17,5%        10,7%         14,5%          0,9%         113,1%

        Beta                 0,72              ---                      MSCI Europe
                                                                                          4,8%       17,8%      20,6%      20,4%       -12,9%         19,4%        12,7%         16,4%          2,5%         139,2%
                                                                         Micro TR
  Sharpe Ratio 3Y            0,96              ---                    * Benchmark: MSCI Europe Microcap after 27/01/2011, CAC SMALL before

   Tracking Error            10,12             ---

         Grade average E*                                6,69/10
         Grade average S*                                6,60/10
         Grade average G*                                 6,18/10
         Portfolio grade overall ESG**                   6,49/10
                                                                                                                                                                     b

                                                                                                                                                                                                            …

COUNTRY BREAKDOWN                                                                                                                                INDUSTRY BREAKDOWN (on total invested)
      Norway
        2%                                                                                                                                                               2,9%                               Gay-Lussac
                            Cash                        THE FUND’S WEEKLY AVERAGE ON ↗ AND ↘*                                                Telecommunication
                                                                                                                                                                             5,6%                           Microcaps
                            12%                                                                               *since inception                          Energy
                                                                                                              lancement                                              2,3%                                   MSCI Europe
               Italy                                                                                                                                                       4,8%                             Micro
                                                                                                                                                   Health Care
               24%                                       2%                                                                                                                                13,6%

                                                                     1,02%1,19%                                                              Basic consumption                           11,6%
                                                                                                                                                                          3,9%

                                                         1%                                                                         Discretionnary consumption                       11,3%
                                                                                                                                                                                  8,8%
   Germany
     4%                                                                                                                                                      IT                                                         31,5%
                                                                                                                                                                                                    18,4%
                        France                           0%
                                                                                                                                                    Real Estate          3,5%
                         58%                                                                                                                                                     7,9%
                                                                                                                                                                     2,7%
                                                        -1%                                                                                            Finance
                                                                                                                                                                                        11,4%

                                                                                                  -1,14%                                              Materials
                                                                                                                                                                             6,3%
                                                        -2%                                            -1,62%                                          Industry                                    17,4%
                                                                                                                                                                                                           21,2%

                                                               Gay-Lussac Microcaps              MSCI Europe Micro                                            0%                10%               20%              30%
April 2021 - Gay-Lussac Gestion
Gay-Lussac Microcaps
                                                                                                                                          April 2021

                                                             Macroeconomic review
      April was marked by an increase in equity indexes in Europe and the United States: CAC 40 +3.33%, S&P 500 +5.24%, STOXX 600 +1.81%.

      In Europe, the lifting of health restrictions remains very heterogeneous depending on the country. While some states such as France, Italy and
      Belgium are gradually relaxing the measures, others such as Germany remain very cautious by opting for more targeted actions. Vaccination
      on the continent is accelerating, with more than 21% of the population having received at least one dose. However, Europe's health
      backwardness will weigh on the pace of recovery in 2021. GDP in the euro zone is in fact expected to grow by around 3% over the year, which
      is low relative to the global growth expected at approximately 5%. The ECB remained cautious at its last meeting, keeping its tools and
      communication unchanged. Asset buybacks are thus maintained at a high level until at least the next meeting in June.

      In the United States, growth figures for the first quarter showed the sharp acceleration in activity, driven by the lifting of health constraints
      and exceptional budget support. Over the period, GDP ends up in line with expectations, up 6.4% on an annualized quarter-on-quarter basis.
      The latter could grow by approximately 6% over the year, twice that of the euro zone. Recent earnings release have clearly illustrated this
      rebound by regularly beating analysts' estimates. Regarding the fiscal stimulus, Joe Biden specified his timetable but above all the financing
      of his measures, which should involve an increase in taxes of corporates and wealthy individuals. Inflation is expected to last longer than
      expected, due to supply constraints and rising commodity prices. The President of the FED considers the improvement of the economic
      situation still insufficient and the institution aims not to penalize the improvement of the labor market. It will therefore take several months
      of rapid growth and job creation before considering any reduction in monetary support.

KEY RATIOS                                                TOP FIVE POSITIONS                                   BREAKDOWN BY MARKET CAPS

Investment rate (direct lines)           87,73%      90,51%                                                               Name                   % Net asset
Number of lines                               57           60     Name                  % net asset                  More than 300M€                44,23%
Monthly performance A Share               4,19%       2,57%                                                         From 100 to 300M€
                                                                                            5,80%                                                   45,64%
Monthly performance I Share               4,27%       2,66% IGE + XAO
Monthly performance H Share               4,44%       2,77%                                                           Less than 100M€                6,13%
                                                            DIGITAL VALUE SPA               5,07%
Monthly performance R Share               4,25%       2,62%                                                       Average Capitalisation
                                                                                            4,88%                                                   354,50
PER median 2021                            18,64       19,66      PRECIA                                                  (M€)
VE/CA median 2021                           1,28         1,22                                                     Median Capitalisation
                                                          GERARD PERRIER ELECTRIC           4,69%                                                    232,61
VE/EBIT median 2021                        13,89        14,51                                                             (M€)
                                                           PHARMANUTRA SPA                  4,05%

                                                          Management review
     Regarding purchases, we have reinforced ourselves in several stocks with strong conviction: Argan, ABC Arbitrage and Pattern. The French
     real estate company specializing in the development and management of logistics warehouses, Argan, had its share price suffering from the
     rise in long term rates. We seized this opportunity to strengthen ourselves in this stock, whose long-term growth vectors, in particular e-
     commerce, remain solid. Financial market arbitrage strategies specialist ABC Arbitrage has suffered from a stock market correction after an
     exceptional year in 2020 in terms of volatility. However, we consider that this decline is exaggerated considering the solid fundamentals and
     a market environment that stays attractive in the medium term. The gradual resumption of fashion shows should also support the course of
     Italian fashion designer, Pattern.
     We sold our Adesso and Delfingen shares, and reduced our online presence in Samse. We took some profits on German IT consulting firm
     Adesso following a strong year 2020. In our view, the price currently reflects the intrinsic value of the company. After 2020 results far above
     consensus, automotive power cable protection expert Delfingen hit a price that we found in line with its fundamentals. Finally, we have
     streamlined our line in Samse in connection with our risk budget management process.

     MAIN MOVEMENTS OF THE MONTH                          STOCK OF THE MONTH

               Buy                    Sell               Founded Acquired by Yves Revol, currently Chairman of the Board of Directors, in 1982, Clasquin
                                                         specializes in international transport and logistics. The group takes advantage of the complexity of
              Argan                  Adesso              supplies around the world. Clasquin is the only French multinational in the Freight Forwarding and
                                                         Overseas Logistics sector. This unique positioning allows it to offer end-to-end global solutions by air,
         ABC Arbitrage             Delfingen             sea and road. Thanks to its proximity to customers, Clasquin has developed an offer combining
             Pattern                 Samse               creativity and responsiveness that differs from the standardized solutions of industry giants such as
                                                         Kühne + Nagel. In a market severely disrupted by the health crisis which created a major disruption of
                                                         global logistics chains, the group was able to manage the sharp variations in volumes during the year.
                                                         This strong resilience reinforced the leaders in their strategy. In terms of development, the priority
                                                         remains the establishment of new internal growth engines and through targeted acquisitions, which
                                                         should allow the company to benefit from the market rebound. Regarding the 2021 outlook, the group
                                                         announced to outperform its reference market, which is itself expected to increase by 8% (in volume).
                                                         Clasquin seems to have started 2021 very well with a strong recovery in activity in all sectors and
                                                         freight rates being maintained at very high levels. We therefore believe that 2021 will be a good year
                                                         for the group whose potential for improving margins remains significant but does not seem to us to
                                                         justify the discount regarding the competitors. We are particularly confident in the outlook for the
                                                         group.
RJ Funds – Gay-Lussac Smicrocaps
                                                                                                                                                                                                             April 2021
 GENERAL INFORMATIONS
                                                                                                                                   Performances and statistics on the 30 of April 2021
Custodian                                                           Société Générale
ISIN code (P share)                                                   LU2022049022
ISIN code (I share)                                                   LU2022049295                                                                                                                                                   +47,1%
                                                                                                          150
Valuation                                                                       Daily
Management fees A share                                              2% of Net assets                     140
Management fees I and D
                                                                      1% of Net assets                    130
shares
Performance fees (High                                    12% including tax of the
                                                                                                          120
Water Mark)                                                  annual perf over 7%                                                                                                                                                      +12,0%
Entry fees                                                          2% maximum                            110
Exit fees (UCITS acquired)                                                   None
NAV (P share)                                                                     217,22 €                100
NAV (I share)                                                                     220,69 €
                                                                                                          90
Inception date (P share)                                                         27 aug 19
Inception date (I share)                                                         27 aug 19                80
Net assets                                                                       28,56 M€                  08/19           10/19     12/19        02/20         04/20     06/20        08/20        10/20        12/20       02/21       04/21

                                                                  RJ Funds
                  Risk indicator (P Share)
                                                                 Smicrocaps                                             RJ Funds Smicrocaps - P Share - Index 100                 Investment objective (7% annualized) - Index 100
                           Volatility 1Y                             14,30%
                        Max Drawdown                                 -6,01%
                                                                                                                                                           1M           2021       2020         2019*          Inception
                          Ajusted Beta                                 0,55
                          Sharpe Ratio                                 4,29                                            P Share                            5,2%          13,2%      17,4%          8,9%           44,8%

           (Bloomberg data)                                                                                            I Share                            5,3%          13,6%      18,6%          9,3%           47,1%

 PORTFOLIO EXTRA-FINANCIAL ANALYSE
 Grade average E*                                                                         6,81/10
 Grade average S*                                                                         6,81/10                                                                                         Gay-Lussac Gestion est signataire des Principes
 Grade average G*                                                                         6,71/10                                                                                         des   Nations   Unies   pour   l’Investissement
 Portfolio grade overall ESG**                                                            6,78/10                                                                                         Responsable (UN-PRI) depuis 2010
 *proportion of the fund’s investments for which non-financial data are available and used to
 complement fondamental analysis.** Qualitative scores calculated using the internal ESG analysis
 modelTaux de couverture : 96%

COUNTRY BREAKDOWN                                                                              THE FUND’S WEEKLY AVERAGE ON ↗ AND ↘*                                      INDUSTRY BREAKDOWN
                                                                                                                                             *since inception

    Sweden            0,59%                                                                                                                                                              Health Care          3,8%                RJF Smicrocaps
                                                                                                                                                                                                                     13,5%
    Belgium           0,61%
                                                                                                                                                                                                                                  MSCI Europe Micro
Netherlands           0,74%                                                                                                                                                        Basic consumption             7,6%             TR
                                                                                                                                                                                                             3,7%
     Austria          1,03%
                                                                                                    2%                     1,72%
      Ireland          1,24%                                                                                       1,18%                                                                                                  17,6%
                                                                                                                                                                           Discretionnary consumption
                                                                                                                                                                                                                         16,0%
                                                                                                    1%
Switzerland             1,83%
      Poland            1,92%                                                                       0%                                                                                             IT                                 30,0%
                                                                                                                                                                                                                            19,8%
    Portugal            2,12%                                                                       -1%
     Norway              2,20%                                                                                                                                                                                4,1%
                                                                                                    -2%                                                                                      Finance
                                                                                                                                             -1,71%                                                                        19,1%
   Germany                      6,14%                                                               -3%
   Danmark                       6,52%                                                                                                                                                      Materials             9,0%
                                                                                                    -4%                                             -3,26%                                                     5,4%
     Finland                           9,58%
                                                                                                                RJF Smicrocaps       MSCI Europe Micro TR                                                                 17,7%
        Cash                            10,17%                                                                                                                                               Industry
                                                                                                                                                                                                                         16,4%
         Italy                                                    23,40%
      France                                                                    31,92%                                                                                                                  0%     10%       20%       30%       40%

                 0%               10%                20%                 30%

                                                                                                                INVESTMENT OBJECTIVE
Gay-Lussac Smicrocaps
                                                                                                                                April 2021

                                                             Macroeconomic review
     April was marked by an increase in equity indexes in Europe and the United States: CAC 40 +3.33%, S&P 500 +5.24%, STOXX 600 +1.81%.

     In Europe, the lifting of health restrictions remains very heterogeneous depending on the country. While some states such as France, Italy and
     Belgium are gradually relaxing the measures, others such as Germany remain very cautious by opting for more targeted actions. Vaccination
     on the continent is accelerating, with more than 21% of the population having received at least one dose. However, Europe's health
     backwardness will weigh on the pace of recovery in 2021. GDP in the euro zone is in fact expected to grow by around 3% over the year, which
     is low relative to the global growth expected at approximately 5%. The ECB remained cautious at its last meeting, keeping its tools and
     communication unchanged. Asset buybacks are thus maintained at a high level until at least the next meeting in June.

     In the United States, growth figures for the first quarter showed the sharp acceleration in activity, driven by the lifting of health constraints
     and exceptional budget support. Over the period, GDP ends up in line with expectations, up 6.4% on an annualized quarter-on-quarter basis.
     The latter could grow by approximately 6% over the year, twice that of the euro zone. Recent earnings release have clearly illustrated this
     rebound by regularly beating analysts' estimates. Regarding the fiscal stimulus, Joe Biden specified his timetable but above all the financing
     of his measures, which should involve an increase in taxes of corporates and wealthy individuals. Inflation is expected to last longer than
     expected, due to supply constraints and rising commodity prices. The President of the FED considers the improvement of the economic
     situation still insufficient and the institution aims not to penalize the improvement of the labor market. It will therefore take several months
     of rapid growth and job creation before considering any reduction in monetary support.

KEY RATIOS                                               TOP FIVE POSITIONS                              BREAKDOWN BY MARKET CAPS
                                                                                                         ………….
Investment rate (direct lines)            89,83                   Name               % net asset                 Name         % Net asset
Number of lines                              50            DIGITAL VALUE SPA            4,51%               More than 500M€     32,23%
PER median 2021                           20,35              SICIT GROUP SA             4,28%               From 150 to 500M€            54,40%
VE/CA median 2021                          1,97                                                              Less than 150M€             13,27%
                                                          PHARMANUTRA SPA              3,95%
VE/EBIT median 2021                       16,87                                                           Average Capitalisation
                                                              ROBERTET SA              3,95%                                             452,98
                                                                                                                  (M€)
                                                               SIDETRADE               3,43%              Median Capitalisation
                                                                                                                                         360,68
                                                                                                                  (M€)

                                                         Management review
     This month, we have strengthened ourselves in Uniphar, Livechat and Sicit. Uniphar is a diversified health services company providing services
     to multinational manufacturers of pharmaceuticals and medical technologies. The group benefited in particular from the strong growth of its
     Product Access division, driven by the good momentum in the orphan drugs segment. The Polish company specializing in chatbot solutions
     (automated digital customer communication), Livechat, posted a very good first quarter. Turnover is up around 40% and management
     announced the signing of 943 new clients. The Italian company specialized in the production of biostimulants from leather residues, Sicit, is
     currently the subject of a takeover bid by the majority shareholder at € 16 per share. At this price we will not bring our shares.
     On the sales side, we sold our Marr and Uponor shares. The Italian leader in food delivery for catering professionals, Marr, has had an excellent
     stock market performance. We believe that the price is currently representative of the fundamentals of the company. After excellent 2020
     results and a further upward revision of targets, we have become more cautious on Uponor, whose margins will be impacted by the rise in
     commodity prices.

                                                        MAIN MOVEMENTS OF THE MONTH

                                                               Buy                    Sell
                                                             Uniphar                  Marr
                                                             Livechat                Uponor
                                                               Sicit
Gay-Lussac Smallcaps
                                                                                                                                                                                                 April 2021

GENERAL INFORMATIONS                                                                                             Performances and statistics on the 30 of April 2021
Custodian                                         Société Générale              220                                    GL Smallcaps - Part A - Base 100                                      CAC Small TR - Base 100
                                                                               220                                                                                                                                                +105,2
Cut off                                  Subscriptions/redemptions
                                                                                200
Code ISIN (A Share)                                  FR0011759299
                                                                               200                                                                                                                                                   196,9
Code ISIN (I Share)                                 FR0013228327                180                                                                                                                                                +76,9%
Valuation                                                    Daily
                                                                               180
                                                                                160
Management fees A Share                            2,20% of Net assets
                                                                                                                                                                                                                                       167,5
Management fees I Share                             1,10% of Net assets         140
                                                                               160
Performance fees                                                None
Entry fees                                               2% maximum             120
                                                                               140
Exit fees (UCITS acquired)                                      None
                                                                                100
NAV (A Share)                                                307,76€           120
NAV (I Share)                                             157 131,49€            80
                                                                                        03/14     09/14     03/15    09/15   03/16     09/16      03/17     09/17     03/18       09/18      03/19     09/19     03/20    09/20      03/21
Inception date (A Share)                                    31-mar-14          100
Inception date (I Share)                                    30-dec-16
                                                                                                             Gay-Lussac Smallcaps - A Share - Index 100                                         CAC Small TR - Index 100
Net assets                                                  28,18 M€               80
                                                                                    mars-14 août-14 janv.-15 juin-15 nov.-15 avr.-16 sept.-16 févr.-17 juil.-17 déc.-17 mai-18 oct.-18 mars-19 août-19 janv.-20 juin-20 nov.-20

                                   Gay-Lussac                                                             YTD       2021      2020         2019           2018       2017          2016         2015           2014      Inception
                                                    MSCI MICRO
                                   Smallcaps
        Volatilité 3Y               15,40%             22,72%                           A Share           4,0%      9,9%      8,8%        21,7%       -15,5%        21,8%         16,8%        14,7%           6,0%       105,2%

                                                                                     CAC Small            3,9%      16,3%     7,2%        15,2%       -26,8%         21,1%        10,7%        14,5%           0,9%       62,4%
    Max Drawdown 3Y                 -31,30%           -38,30%
                                                                                    CAC Small TR          4,1%      16,5%     8,5%        17,2%       -26,0%        22,1%         12,7%        16,4%           2,5%       76,9%
              Beta                    0,77

      Sharpe Ratio 3Y                 0,56                                              I Share           4,1%      10,3%     10,0%       23,1%          -14,5%     23,1%                                                 57,1%

       Tracking Error                11,99                                           CAC Small            3,9%      16,3%     7,2%        15,2%       -26,8%         21,1%                                                27,4%

                                                                                    CAC Small TR          4,1%      16,5%     8,5%        17,2%       -26,0%        22,1%                                                 33,9%

         Grade average E*                                          7,12/10
         Grade average S*                                          7,08/10
         Grade average G*                                          6,52/10
         Portfolio grade overall ESG**                             6,91/10
                                                                                                                                                                                    b

                                                                                                                                                                                                         …

COUNTRY BREAKDOWN                                                                                                                                            INDUSTRY BREAKDOWN (on total invested)
                                                                                                                                                                            Real Estate           4,8%                    Gay-Lussac
 Belgium          0,92%                                                      THE FUND’S WEEKLY AVERAGE ON ↗ AND ↘*                                                             Utilities
                                                                                                                                                                                               2,0%                       Smallcaps
                                                                                                                                                                                             0,9%
  Ireland         1,05%                                                                                                               *since inception                                                                    CAC Small TR
                                                                                                                                                                    Telecommunications         1,9%
                                                                                                                                                                                              1,4%
  Finland         1,67%                                                                              1,58%                                                                      Energy
                                                                             2%                                                                                                                3,8%
   Spain          1,70%
                                                                                          1,20%                                                                            Health Care             6,5%
                                                                                                                                                                                                               10,8%
                                                                             1%                                                                                                                  4,3%
  Austria         2,19%                                                                                                                                              Basic consumption
                                                                                                                                                                                                3,8%
                                                                             0%                                                                                                                                10,1%
 Netherl…          4,22%                                                                                                                                     Discretionnary consumption
                                                                                                                                                                                                                       15,0%
                                                                                                                                                                                     IT                                                24,6%
Germany              6,19%                                                   -1%                                                                                                                                               19,7%
                                                                                                                                                                               Finance        1,8%                         18,6%
     Italy            9,00%                                                                                                  -1,18%
                                                                             -2%                                                                                              Materials                           13,4%
    Cash                  10,08%                                                                                                  -1,90%                                                             6,6%
                                                                                                                                                                                                                                20,5%
                                                                          -3%                                                                                                  Industry
                                                                                                                                                                                                                               19,5%
  France                                                       62,98%
             0%             20%              40%         60%                        Gay-Lussac Smallcaps                      CAC Small NR                                              0%              10%               20%
Gay-Lussac Smallcaps
                                                                                                                               April 2021

                                                     Macroeconomic review
 April was marked by an increase in equity indexes in Europe and the United States: CAC 40 +3.33%, S&P 500 +5.24%, STOXX 600 +1.81%.

 In Europe, the lifting of health restrictions remains very heterogeneous depending on the country. While some states such as France, Italy and
 Belgium are gradually relaxing the measures, others such as Germany remain very cautious by opting for more targeted actions. Vaccination
 on the continent is accelerating, with more than 21% of the population having received at least one dose. However, Europe's health
 backwardness will weigh on the pace of recovery in 2021. GDP in the euro zone is in fact expected to grow by around 3% over the year, which
 is low relative to the global growth expected at approximately 5%. The ECB remained cautious at its last meeting, keeping its tools and
 communication unchanged. Asset buybacks are thus maintained at a high level until at least the next meeting in June.

 In the United States, growth figures for the first quarter showed the sharp acceleration in activity, driven by the lifting of health constraints
 and exceptional budget support. Over the period, GDP ends up in line with expectations, up 6.4% on an annualized quarter-on-quarter basis.
 The latter could grow by approximately 6% over the year, twice that of the euro zone. Recent earnings release have clearly illustrated this
 rebound by regularly beating analysts' estimates. Regarding the fiscal stimulus, Joe Biden specified his timetable but above all the financing
 of his measures, which should involve an increase in taxes of corporates and wealthy individuals. Inflation is expected to last longer than
 expected, due to supply constraints and rising commodity prices. The President of the FED considers the improvement of the economic
 situation still insufficient and the institution aims not to penalize the improvement of the labor market. It will therefore take several months
 of rapid growth and job creation before considering any reduction in monetary support.

KEY RATIOS                                            TOP FIVE POSITIONS                                  BREAKDOWN BY MARKET CAPS

Investment rate (direct lines)          89,92%                Name               % net asset                           Name                 % net asset
Number of lines                              43
                                                    STEF                               5,58%                     More than 800M€                39%
Monthly performance A Share              4,05%
Monthly performance I Share              4,14%      SALCEF SPA                         4,86%                   From 400 to 800M€                43%
PER median 2021                           20,05     AXWAY SOFTWARE SA                   4,23%                    Less than 400M€                 18%
VE/CA median 2021                          1,85
                                                    SAMSE SA                            4,23%              Average Capitalisation (M€)         1 060,15
VE/EBIT median 2021                       16,09
                                                    ROBERTET SA                         4,10%              Median Capitalisation (M€)          803,13

                                                           Management review
 Regarding portfolio management in April, we strengthened our position in Esker, the software developer for dematerialization and automation
 of the payment process. We are confident in the success of Esker’s strategy and in the continued growth momentum through its innovative
 solutions. In addition, we have strengthened our position in Wavestone, the French consulting firm specializing in business transformation that
 has published very encouraging perspectives with its large order book that gives the group good visibility. Regarding disposals, after a very good
 stock performance, we took profits by selling our Akwel shares. Indeed, the group achieved an exceptional year 2020 but the margins achieved
 will not be sustainable for the 2021 financial year. In addition, we have reduced our position in Samse in order to respect our risk management
 process. Finally, we sold our shares in Befesa, which achieved a very good performance stock market performance thanks to the sharp rise in
 the price of zinc. This in no way calls into question the fundamental qualities of these companies.

MAIN MOVEMENTS OF THE MONTH                          STOCK OF THE MONTH
                                                     Founded in 1990, Wavestone is a management and digital consulting firm, one of the
                                                     independent leaders in Europe. Its two co-founders, Pascal IMBERT and Michel DANCOISNE are
       Buy                       Sell
                                                     still involved, being respectively Chairman of the Management Board, Chairman of the
       Esker                  Akwel                  Supervisory Board and significant shareholders.
                                                     This month, Wavestone published resilient 2020/21 revenue, down 1%. The publication reflects a
    Wavestone                Befesa                  good recovery at the end of the year, with a fourth quarter growth of 7%. Management
                             Samse                   anticipates an operating margin at around 12.5%, including a provision of € 3.2 million linked to
                                                     the reimbursement of indemnities received under partial activity mechanisms and in a moderate
                                                     decline compared to last year (13.2%). The firm is observing an acceleration of major
                                                     transformation projects among its clients, bringing its order backlog to more than 4 months
                                                     compared to 3.5 months the previous year. Turnovers for this new financial year are thus
                                                     expected to grow by almost 8% to reach around € 450 million and the operating margin should
                                                     come back to approximately 13% excluding acquisitions.
                                                     With € 32 million in net cash and good visibility for this new financial year, we believe that
                                                     Wavestone’s activity should grow in a context of strong demand for consulting from companies.
Gay-Lussac Green Impact
                                                                                                                                                                                                         April 2021
                                                                                                                                 Signatory of the UN-PRI
                                                                                                                                 since 2010

   GENERAL INFORMATIONS                                                                                                     Performances and statistics on the 30 of april 2021
                                                                                         185                                                                                                                                       +96,8%
   Custodian                                                 Société Générale            175
   Cut off                                         Subscriptions/redemptions             165
   ISIN code (A share)                                         FR0010178665                                                                                                                                                   +70,9
   ISIN code (I share)                                         FR0010182352              155
   ISIN code (R share)                                         FR0014000EI9              145
   Valuation                                                              Daily
                                                                                         135
   Management fees A share                               2,32% of Net assets
   Management fees I share                               0,96% of Net assets             125
   Management fees R share                                1.40%of Net assets              115
   Performance fees (High Water                      20% including tax of the
   Mark)                                            annual perf over the index           105
   Entry fees                                                    2% maximum               95
   Exit fees (UCITS acquired)                                             None
                                                                                          85
   NAV (A share)                                                      392,42€
   NAV (I share)                                                  196 814,85€
   NAV (R share)                                                      159,75€
   Inception date (A share)                                            3 jun 05                                          Gay-Lussac Green Impact - I Share - Index 100                      Stoxx 600 TR - Index 100
   Inception date (I share)                                          11-apr-07
   Inception date (R share)                                          18 dec.20
   Net assets                                                       32,36 M€
                                                                                                                          1M        2021      2020         2019      2018        2017       2016     2015      2014    Inception
                                                    Gay-Lussac
         Risk indicator (A Share)                                                                     A Share            3,4%       4,2%      14,8%        22,0%     -14,3%      9,6%       -0,2%    17,7%     -4,5%    161,6%
                                                   Green Impact
               Volatility 3Y                            17,91%                                        Stoxx 600          1,8%       9,6%      -4,0%        23,2%     -13,2%      7,7%       -1,2%    6,8%      4,3%     61,9%

                                                                                                      Stoxx 600 TR       2,2%      10,6%      -2,0%        26,8%     -10,8%     10,6%       1,7%     9,6%      7,2%     151,4%
           Max Drawdown 3Y                             -30,73%

                     Beta                                 0,86                                        I Share            3,5%       4,7%      16,3%        23,7%     -13,1%      11,1%      1,1%     19,4%     -3,2%    96,8%

                                                                                                      Stoxx 600          1,8%       9,6%      -4,0%        23,2%     -13,2%      7,7%       -1,2%    6,8%      4,3%     14,4%
            Sharpe Ratio 3Y                               2,86
                                                                                                      Stoxx 600 TR       2,2%      10,6%      -2,0%        26,8%     -10,8%     10,6%       1,7%     9,6%      7,2%     70,9%
              Tracking Error                              10,87

EXTRA FINANCIAL PORTFOLIO ANALYSIS                                                     VALUES RATING BREAKDOWN                                              ESG RATING VS BECHMARK INDEX

                                                                                                                     B                                                               E
                                                  Gay-Lussac            Benchmark                               BB 2%
                                              Green Impact /10            Index /10                             7%         AAA                                                       8
                                                                                                                           20%
  Grade average E*                                       7,93/10                7,17                   BBB
                                                                                                       13%                                                                           7                                 Gay-Lussac Green
  Grade average S*                                       7,31/10                6,86                                                                                                                                   Impact
                                                                                                                                                                                                                       Benchmark Index
  Grade average G*                                       5,20/10                2,90                                                                           10 7
                                                                                                                                                              Total             6             7     8 S10
  Portfolio grade overall ESG**                          7,22/10                5,66                                             AA                                                                                    Highest Grade (/10)
                                                                                                           A                    27%                                                  3
* proportion of the fund’s investments for which non-financial data are available                         31%                                                                        5
and used to complement fondamental analysis.
** Qualitative scores calculated using the internal ESG analysis model
(Weighting in the overall grade: Grade E - 60%; Grade S - 20%; Grade G - 20%)                                                                                                        G
                                                                                                                                                                                     10

   SECTORS BREAKDOWN                                                                                                            COUNTRY BREAKDOWN

              Automobiles and Parts                         0,4%
                Telecommunications                             2,2%                                                              50%               46%
                         Real Estate                           2,4%                                                                                                                                                     41%
                           Insurance                            3,1%                                                              40%
                   Financial Services                            3,9%
                         Health Care                              4,2%                                                            30%
     Personal Care, Drug and grocery…                              4,5%
                                                                                                                                               19%
        Food, Beverage and Tobacco                                  5,3%                                                          20%                                                                                         17%
                                                                                                                                                                                    15%                         15%
          Construction and Materials                                 5,9%
                              Utilities                                7,3%                                                                                                                    9%            9%
                                                                                                                                  10%                          6% 4%            7%
                          Chemicals                                    7,5%                                                                                                                         3%
     Consumer products and services                                      8,7%
                         Technology
                                                                                                                                    0%
                                                                           9,9%                                                                Others             Spain       Switzerland     Danmark        Germany    France
       Industrial Goods and Services                                                                            24,7%
                                                                                                                                                             Gay-Lussac Green Impact                 Stoxx 600
                                                       0%                       10%             20%
Gay-Lussac Green Impact
                                                                                                                                                                                                                           April 2021

                                                                                                                  Macroeconomic review
                April was marked by an increase in equity indexes in Europe and the United States: CAC 40 +3.33%, S&P 500 +5.24%, STOXX 600 +1.81%.

                In Europe, the lifting of health restrictions remains very heterogeneous depending on the country. While some states such as France, Italy and Belgium are
                gradually relaxing the measures, others such as Germany remain very cautious by opting for more targeted actions. Vaccination on the continent is
                accelerating, with more than 21% of the population having received at least one dose. However, Europe's health backwardness will weigh on the pace of
                recovery in 2021. GDP in the euro zone is in fact expected to grow by around 3% over the year, which is low relative to the global growth expected at
                approximately 5%. The ECB remained cautious at its last meeting, keeping its tools and communication unchanged. Asset buybacks are thus maintained at a
                high level until at least the next meeting in June.

                In the United States, growth figures for the first quarter showed the sharp acceleration in activity, driven by the lifting of health constraints and exceptional
                budget support. Over the period, GDP ends up in line with expectations, up 6.4% on an annualized quarter-on-quarter basis. The latter could grow by
                approximately 6% over the year, twice that of the euro zone. Recent earnings release have clearly illustrated this rebound by regularly beating analysts'
                estimates. Regarding the fiscal stimulus, Joe Biden specified his timetable but above all the financing of his measures, which should involve an increase in
                taxes of corporates and wealthy individuals. Inflation is expected to last longer than expected, due to supply constraints and rising commodity prices. The
                President of the FED considers the improvement of the economic situation still insufficient and the institution aims not to penalize the improvement of the
                labor market. It will therefore take several months of rapid growth and job creation before considering any reduction in monetary support.

                      KEY RATIOS                                                                                                                              BREAKDOWN BY MARKET CAPS
                     Investment rate (direct lines)                                              90,09%                                                                                 Name                             % net asset
                     Number of lines                                                                  45
                                                                                                                                                               More than 5 Mds €                                                 62,62%
                     Monthly Performances A Share                                                 3,40%
                     Monthly Performances I Share                                                 3,52%                                                        From 1 to 5 Mds €                                                 26,97%
                     Monthly Performances R Share                                                 3,48%                                                        Less than 1 Mds €                                                   10,41%
                     Median PER 2021                                                               26,66                                                       Average Capitalisation (Mds €)                                       38,54
                                                                                                                                                               Median Capitalisation (Mds €)                                         16,44

CARBON INTENSITY                                                                                 GREENFIN GREEN INTENSITY                                                               ALIGNMENT WITH THE PARIS AGREEMENTS
(tCO2/M€ invested, Scopes 1+2)                                                                                                                                                          (Scenario +2°C)

                                                                  116,53                                                                                                                                                                               47,73%
           Moyenne                                                                                                                                                                                    Moyenne
                                                                                   177,10                    23%                                                                                                                              34,94%
                                                                                                                                                      Type 1 (> 50% du CA)

                                                                                                                                     61%              Type 2 (10 à 50% du
                                                                      130,03                                                                          CA)                                                                                            44,36%
Moyenne pondérée
                                                                                                          16%                                         Type 3 (
Gay-Lussac Europe Flex
                                                                                                                                                                          April 2021

 GENERAL INFORMATIONS                                                                              Performances and statistics on the 30 of april 2021

   Custodian                                      Société Générale                                                                                                                                     +24,4%

   Cut off                             Subscriptions/redemptions           122
   ISIN Code (A share)                                FR0013280211         117
   ISIN Code(I share)                                FR0013280237                                                                                                                                      +11,6%
                                                                           112
   Valuation                                                     Daily
                                                                           107
   Management fees A share                      1,50% of Net assets
                                                                           102
   Management fees I share                     0,80% of Net assets
   Performance fees (High                   12% including tax of the       97
   Water Mark)                                 annual perf over 5%
                                                                            92
   Entry fees                                         2% maximum
                                                                           87
   Exit fees (UCITS acquired)                                    None
   NAV (A share)                                             182,36 €      82
                                                                              09/17    12/17   03/18   06/18   09/18   12/18   03/19    06/19    09/19    12/19       03/20 06/20 09/20 12/20          03/21
   NAV (I share)                                           12 443,50 €                         Gay-Lussac Europe Flex - I Share - Index 100                     Benchmark index - Index 100
   Inception date (A share)                                  29-sep-17
   Inception date (I share)                                  29-sep-17
                                                                                                                2021
   Net assets                                                42,57 M€                               1M                          2020               2019               2018             Inception*
                                                                                                                (YTD)

   Risk indicator (I Share)        Gay-Lussac Europe Flex                        A Share           2,6%          4,7%           11,0%             12,1%               -6,8%              21,6%

         Volatilité 3Y                       7,34 %                              I Share           2,7%          5,0%           11,5%             12,9%               -6,1%              24,4%
       Max Drawdown                         -16,54 %
                                                                              * Since the launch of the Fund on 29/09/2017
                Beta                          0,48                            ** Benchmark index: 50% EONIA (EONCALP7 Index) + 16.66% Stoxx 600 TR + 16.66% CAC
                                                                              Mid&Small TR +
      Sharpe Ratio 3Y                         1,00                            16.66% MSCI EMU Microcaps TR

COUNTRY BREAKDOWN                                                   BREAKDOWN BY INVESTMENT THEME                                 INDUSTRY BREAKDOWN (on the invested share)
(on the invested share)
                                                                                       Special                                                        Real Estate         4,2%
   Sweden           0,7%                                                              Situations     European
                                                                                          7%         Surprise                                             Utilities      2,1%
     Spain          0,8%
                                                                                                       12%
   Portugal         1,2%                                                                                                                     Telecommunications          2,3%

   Belgium          1,8%                                                                                                                              Health Care               8,4%

    Finland         1,9%
                                                                                                                                                Basic consumption               8,4%
  Germany            2,6%                                                                              Digital & Energy
                                                                                                          Transition                   Discretionnary consumption                9,8%
Netherlands          2,8%                                                Accommodating                       33%
       USA            5,2%                                               Monetary Policies                                                                      IT                     15,6%
                                                                              48%
   Denmark            6,4%                                                                                                                                Finance               8,1%

       Italy               8,6%                                                                                                                          Materials                 12,6%
        UK                 10,1%
                                                                                                                                                          Industry                             28,5%
    France                                            57,5%
               0%            20%      40%            60%                                                                                                          0%               20%           40%
Gay-Lussac Europe Flex
                                                                                                                                   April 2021

                                                           Macroeconomic review
       April was marked by an increase in equity indexes in Europe and the United States: CAC 40 +3.33%, S&P 500 +5.24%, STOXX 600 +1.81%.

       In Europe, the lifting of health restrictions remains very heterogeneous depending on the country. While some states such as France, Italy
       and Belgium are gradually relaxing the measures, others such as Germany remain very cautious by opting for more targeted actions.
       Vaccination on the continent is accelerating, with more than 21% of the population having received at least one dose. However, Europe's
       health backwardness will weigh on the pace of recovery in 2021. GDP in the euro zone is in fact expected to grow by around 3% over the year,
       which is low relative to the global growth expected at approximately 5%. The ECB remained cautious at its last meeting, keeping its tools
       and communication unchanged. Asset buybacks are thus maintained at a high level until at least the next meeting in June.

       In the United States, growth figures for the first quarter showed the sharp acceleration in activity, driven by the lifting of health constraints
       and exceptional budget support. Over the period, GDP ends up in line with expectations, up 6.4% on an annualized quarter-on-quarter basis.
       The latter could grow by approximately 6% over the year, twice that of the euro zone. Recent earnings release have clearly illustrated this
       rebound by regularly beating analysts' estimates. Regarding the fiscal stimulus, Joe Biden specified his timetable but above all the financing
       of his measures, which should involve an increase in taxes of corporates and wealthy individuals. Inflation is expected to last longer than
       expected, due to supply constraints and rising commodity prices. The President of the FED considers the improvement of the economic
       situation still insufficient and the institution aims not to penalize the improvement of the labor market. It will therefore take several months
       of rapid growth and job creation before considering any reduction in monetary support.

 KEY RATIOS                                         TOP FIVE POSITIONS                                     BREAKDOWN BY MARKET CAPS
Gross Equity Exposure                  66,29%                                                                       Name             % net asset
Futures & Options                      -18,97%
                                                              Name              % net asset
Net Equity Exposure                    47,32%            BERKSHIRE                                           More than 4 Mds €         34,96%
Bonds                                   3,17%         HATHAWAY INC-CL B            2,94%
                                                                                                             From 500 M€ to 4
Arbitrage / Takeover bid               10,08%                                                                                          28,54%
                                                              STEF                 2,93%                          Mds €
Liquidities, money market              20,46%
Monthly performance - A Share           2,56%               INFOTEL                2,59%                     Less than 500 M€           36,51%
Monthly performance - I Share           2,67%                                                                     Average
                                                          ROBERTET SA              2,30%                                                26 805
Number of lines                             60                                                               Capitalisation (M€)
Median PER 2021                          21,42           UNILEVER PLC              2,28%                          Median
Median EV/Sales 2021                      2,45                                                                                           1 763
                                                                                                             Capitalisation (M€)
Median EV/EBIT 2021                      18,26

                                                               Management review

     Regarding purchases, we have put Ferrari and Digia in the spotlight. The Italian luxury carmaker Ferrari is expected to benefit
     from several catalysts in the medium term. In particular, we have high expectations of the new SF90 model, the new CEO, and
     a more ambitious target for 2022 once the CEO will be appointed. Finnish IT services company Digia has a resilient growth
     profile. The company has a solid history of recurring organic growth (around 15% per year since 2016) and has managed to
     achieve a growth rate of 5% in 2020 despite the COVID-19 crisis.
     On the contrary, we sold our Linde and Christian Dior shares. The world leader in industrial gas, Linde, benefited in 2020 from
     its expertise and from a particularly dynamic year for its medical activity. We believe that the stock is well valued today and
     that the momentum could slow down in the short-term. The iconic luxury group, with more than 97% owned by Bernard
     Arnault's holding company, Christian Dior, started this year very well and will continue to benefit from the gradual reopening
     of economies. However, the excellent stock market performance prompted us to take profits.
You can also read