ARE WE IN A HOUSING BUBBLE? - MARK ZANDI, CHIEF ECONOMIST CRIS DERITIS, DEPUTY CHIEF ECONOMIST TODD METCALFE, SENIOR ECONOMIST - MOODY'S ANALYTICS
←
→
Page content transcription
If your browser does not render page correctly, please read the page content below

Are We in A Housing Bubble?

Mark Zandi, Chief Economist
Cris DeRitis, Deputy Chief Economist   June 2021
Todd Metcalfe, Senior Economist

1 Housing Is Hot
House Prices Sizzle…
Single family house prices by price tier, index: 2000 = 100
400
           Less than 75% of Median
350        75%-99.9% of Median
           100% - 124.9% of Median
300
           125% of Median and Greater
250

200

150

100
      00                     05                10             15       20
Sources: CoreLogic, Moody’s Analytics

                                                                   June 2021   3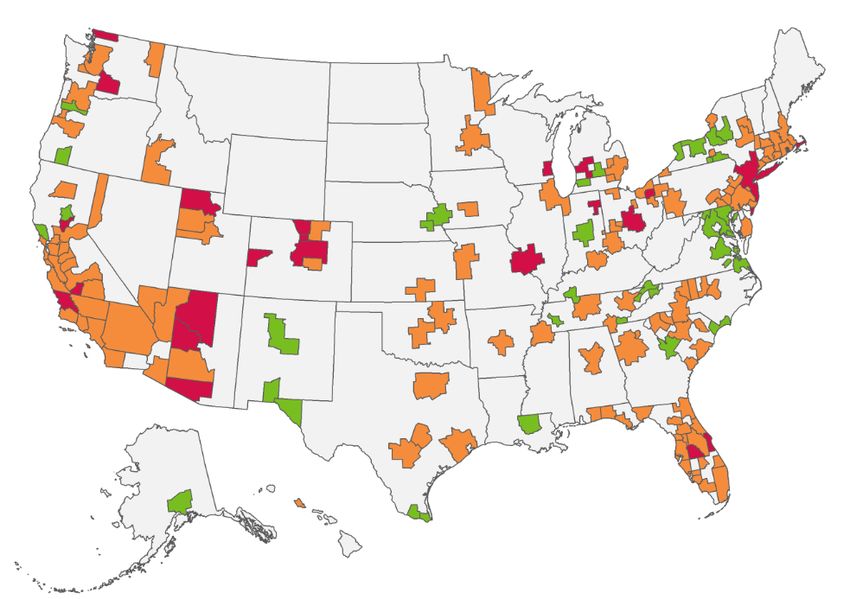
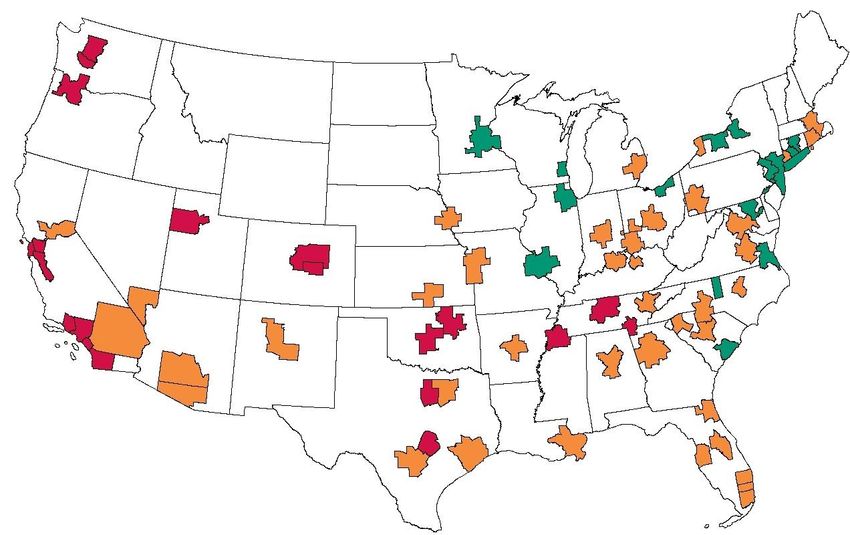
…Across the Country
Single family house prices, % yr ago, April 2021

  Fastest
                                                               US growth:
  Growth:
  Idaho                                                        13.2%

                                                   Slowest
                                                   Growth:
Sources: CoreLogic, Moody’s Analytics              Louisiana
                                                                       June 2021   4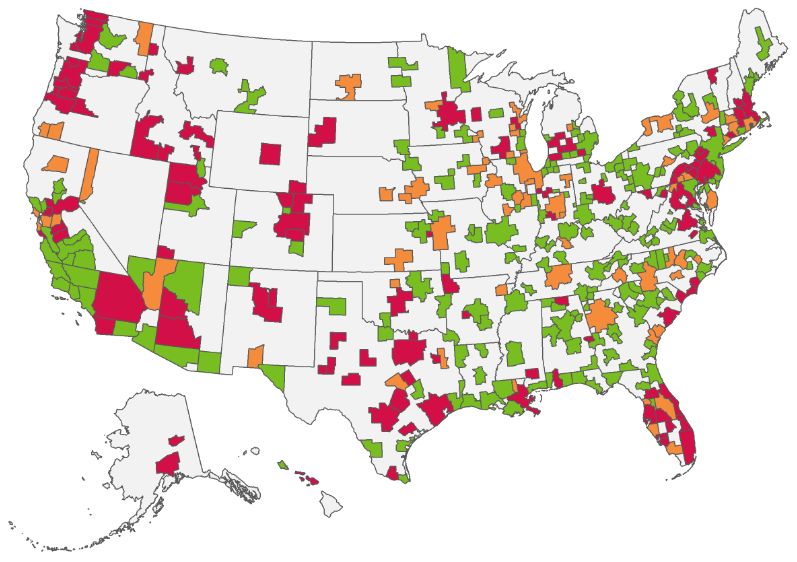
2 Housing Will Cool Off
Interest Rates Are Set To Normalize…
10-year Treasury yield decomposed, %
  2.75
                       Inflation Expectations
  2.25
                       Real Rates
  1.75
  1.25
                                  10-yr T-yield has risen 100 bp since low in August 2020,
  0.75                            of which 80 bps is due to higher inflation expectations
  0.25                            and 20 bps to higher real rate.
  -0.25
  -0.75
  -1.25
      Jan-20    Mar-20     May-20      Jul-20   Sep-20   Nov-20   Jan-21 Mar-21      May-21
Sources: Federal Reserve, Moody’s Analytics

                                                                                         June 2021   6
…Pushing Mortgage Rates Higher
%
18
16
14 Nominal potential GDP growth
10-yr yield, 4-qrt MA
12
Fixed mortgage rate, 4-qrt MA
10
8
6
4 Nominal GDP growth and 10-yr Treasury
2 yields have averaged 6.2% since 1970
0
70 75 80 85 90 95 00 05 10 15 20
Sources: BLS, Moody’s Analytics
June 2021 7Forbearance Cliff Comes Into View
First mortgage loan accommodations, % of loan balances, May 2021
Less than 3%
3.1 – 4.0%
4.1 – 5.0%
More than 5%
Sources: Equifax, Moody’s Analytics
June 2021 8House Price Valuations Are Stretched
House price valuation based on ratio of prices to rents
Undervalued
Overvalued
Seriously
overvalued
Sources: CoreLogic, REIS, Moody’s Analytics
June 2021 93 Not a Bubble
Housing Is in Short Supply…
Vacancy rate, homes for sale and rent, 4 qtr MA, %
   5.0

   4.5

   4.0

   3.5

   3.0

   2.5

   2.0
         65 68 71 74 77 80 83 86 89 92 95 98 01 04 07 10 13 16 19
Sources: Census Bureau, Moody’s Analytics

                                                           June 2021   11
…Across Much Of the Country
Based on 2019 vacancy rate vs historical average, %
Adequately Supplied
Undersupplied
Severely Undersupplied
Sources: Census Bureau, Moody’s Analytics
June 2021 12Pent-up Demand As Millennials Enter Their 30s
Population estimate by single age cohort for 2019, mil
5
4
3
2
1
0
0 5 10 15 20 25 30 35 40 45 50 55 60 65 70 75 80 85 90 95 100
Sources: Census Bureau, Moody’s Analytics
June 2021 13Homeowners Have A Lot of Equity
Owners’ equity, % of household real estate
90
85
80
75
70
65
60
55
50
45
40
52 55 58 61 64 67 70 73 76 79 82 85 88 91 94 97 00 03 06 09 12 15 18 21
Sources: Federal Reserve, Moody’s Analytics
June 2021 14Home Flips Remain Low…
Total number of home flips (L), % of total sales (R)
100,000
90,000 Total Flips (L) 19
80,000 Flips as Percent of Repeat Sales (R) 17
70,000 15
60,000
50,000 13
40,000 11
30,000 9
20,000
10,000 7
0 5
03 04 05 06 07 08 09 10 11 12 13 14 15 16 17 18 19 20 21
Source: Moody’s Analytics Calculated
June 2021 15…In Most Markets
Flips as a % of sales compared to long-run average
Low flip rate
Typical flip rate
High flip rate
Source: Moody’s Analytics Calculated
June 2021 164 Sanguine (But Risky) Outlook
Modest HPI Growth, But No Price Declines…
FHFA Purchase-only House Price Index and Trend, 100=1991Q1
600

500                     FHFA House Price Index

400                     FHFA HPI Trend

300

200

100

  0
      91   94    97    00    03    06    09   12   15   18   21   24   27   30     33
Sources: FHFA, Moody’s Analytics

                                                                                 June 2021   18
…But There Are Alternative Scenarios
Case-Shiller home price index, % year ago
20
Baseline (50%ile) Alt. Scenario 0 (4%ile)
15 Alt. Scenario 1 (10%ile) Alt. Scenario 2 (75%ile)
Alt. Scenario 3 (90%ile) Alt. Scenario 4 (96%ile)
10
5
0
-5
-10
-15
05 06 07 08 09 10 11 12 13 14 15 16 17 18 19 20 21F22F23F24F25F
Sources: Corelogic, Moody’s Analytics
June 2021 19Contact Us:
Mark Zandi
Chief Economist
Moody’s Analytics
help@economy.com
Cris deRitis
Deputy Chief Economist
Moody’s Analytics
help@moodys.com
Todd Metcalfe
Senior Economist
Moody’s Analytics
help@economy.comContact Us: Economics & Business Analytics Offices
West Chester, EBA-HQ London Prague Singapore
+1.610.235.5299 +44.20.7772.5454 +420.22.422.2929 +65.6511.4400
121 North Walnut Street, Suite 500 One Canada Square Washingtonova 17 6 Shenton Way
West Chester PA 19380 Canary Wharf 110 00 Prague 1 #14-08 OUE Downtown 2
USA London E14 5FA Czech Republic Singapore 068809
United Kingdom
New York, Corporate-HQ Sydney Shanghai
+1.212.553.1653 Toronto +61.2.9270.8111 +86.21.6101.0172
7 World Trade Center, 14th Floor 416.681.2133 Level 10 Unit 2306, Citigroup Tower
250 Greenwich Street 200 Wellington Street West, 15th Floor 1 O'Connell Street 33 Huayuanshiqiao Road
New York, NY 10007 Toronto ON M5V 3C7 Sydney, NSW, 2000 Pudong New Area, 200120
USA Canada Australia China
help@economy.com moodysanalytics.com© 2021 Moody’s Corporation, Moody’s Investors Service, Inc., Moody’s Analytics, Inc. and/or their licensors and affiliates (collectively, “MOODY’S”). All To the extent permitted by law, MOODY’S and its directors, officers, employees, agents, representatives, licensors and suppliers disclaim liability for any
rights reserved. direct or compensatory losses or damages caused to any person or entity, including but not limited to by any negligence (but excluding fraud, willful
misconduct or any other type of liability that, for the avoidance of doubt, by law cannot be excluded) on the part of, or any contingency within or beyond the
CREDIT RATINGS ISSUED BY MOODY'S INVESTORS SERVICE, INC. AND/OR ITS CREDIT RATINGS AFFILIATES ARE MOODY’S CURRENT control of, MOODY’S or any of its directors, officers, employees, agents, representatives, licensors or suppliers, arising from or in connection with the
OPINIONS OF THE RELATIVE FUTURE CREDIT RISK OF ENTITIES, CREDIT COMMITMENTS, OR DEBT OR DEBT-LIKE SECURITIES, AND information contained herein or the use of or inability to use any such information.
MATERIALS, PRODUCTS, SERVICES AND INFORMATION PUBLISHED BY MOODY’S (COLLECTIVELY, “PUBLICATIONS”) MAY INCLUDE SUCH
CURRENT OPINIONS. MOODY’S INVESTORS SERVICE DEFINES CREDIT RISK AS THE RISK THAT AN ENTITY MAY NOT MEET ITS NO WARRANTY, EXPRESS OR IMPLIED, AS TO THE ACCURACY, TIMELINESS, COMPLETENESS, MERCHANTABILITY OR FITNESS FOR ANY
CONTRACTUAL FINANCIAL OBLIGATIONS AS THEY COME DUE AND ANY ESTIMATED FINANCIAL LOSS IN THE EVENT OF DEFAULT OR PARTICULAR PURPOSE OF ANY CREDIT RATING, ASSESSMENT, OTHER OPINION OR INFORMATION IS GIVEN OR MADE BY MOODY’S IN ANY
IMPAIRMENT. SEE MOODY’S RATING SYMBOLS AND DEFINITIONS PUBLICATION FOR INFORMATION ON THE TYPES OF CONTRACTUAL FORM OR MANNER WHATSOEVER.
FINANCIAL OBLIGATIONS ADDRESSED BY MOODY’S INVESTORS SERVICE CREDIT RATINGS. CREDIT RATINGS DO NOT ADDRESS ANY
OTHER RISK, INCLUDING BUT NOT LIMITED TO: LIQUIDITY RISK, MARKET VALUE RISK, OR PRICE VOLATILITY. CREDIT RATINGS, NON - Moody’s Investors Service, Inc., a wholly-owned credit rating agency subsidiary of Moody’s Corporation (“MCO”), hereby discloses that most issuers of debt
CREDIT ASSESSMENTS (“ASSESSMENTS”), AND OTHER OPINIONS INCLUDED IN MOODY’S PUBLICATIONS ARE NOT STATEMENTS OF securities (including corporate and municipal bonds, debentures, notes and commercial paper) and preferred stock rated by Moody’s Investors Service, Inc.
CURRENT OR HISTORICAL FACT. MOODY’S PUBLICATIONS MAY ALSO INCLUDE QUANTITATIVE MODEL-BASED ESTIMATES OF CREDIT RISK have, prior to assignment of any credit rating, agreed to pay to Moody’s Investors Service, Inc. for credit ratings opinions and services rendered by it fees
AND RELATED OPINIONS OR COMMENTARY PUBLISHED BY MOODY’S ANALYTICS, INC. AND/OR ITS AFFILIATES. MOODY’S CREDIT RATINGS, ranging from $1,000 to approximately $2,700,000. MCO and Moody’s investors Service also maintain policies and procedures to address the independence
ASSESSMENTS, OTHER OPINIONS AND PUBLICATIONS DO NOT CONSTITUTE OR PROVIDE INVESTMENT OR FINANCIAL ADVICE, AND of Moody’s Investors Service credit ratings and credit rating processes. Information regarding certain affiliations that may exist between directors of MCO
MOODY’S CREDIT RATINGS, ASSESSMENTS, OTHER OPINIONS AND PUBLICATIONS ARE NOT AND DO NOT PROVIDE RECOMMENDATIONS and rated entities, and between entities who hold credit ratings from Moody’s Investors Service and have also publicly reported to the SEC an ownership
TO PURCHASE, SELL, OR HOLD PARTICULAR SECURITIES. MOODY’S CREDIT RATINGS, ASSESSMENTS, OTHER OPINIONS AND interest in MCO of more than 5%, is posted annually at www.moodys.com under the heading “Investor Relations — Corporate Governance — Director and
PUBLICATIONS DO NOT COMMENT ON THE SUITABILITY OF AN INVESTMENT FOR ANY PARTICULAR INVESTOR. MOODY’S ISSUES ITS Shareholder Affiliation Policy.”
CREDIT RATINGS, ASSESSMENTS AND OTHER OPINIONS AND PUBLISHES ITS PUBLICATIONS W ITH THE EXPECTATION AND
UNDERSTANDING THAT EACH INVESTOR W ILL, WITH DUE CARE, MAKE ITS OW N STUDY AND EVALUATION OF EACH SECURITY THAT IS Additional terms for Australia only: Any publication into Australia of this document is pursuant to the Australian Financial Services License of MOODY’S
UNDER CONSIDERATION FOR PURCHASE, HOLDING, OR SALE. affiliate, Moody’s Investors Service Pty Limited ABN 61 003 399 657AFSL 336969 and/or Moody’s Analytics Australia Pty Ltd ABN 94 105 136 972 AFSL
383569 (as applicable). This document is intended to be provided only to “wholesale clients” within the meaning of section 761G of the Corporations Act
MOODY’S CREDIT RATINGS, ASSESSMENTS, OTHER OPINIONS, AND PUBLICATIONS ARE NOT INTENDED FOR USE BY RETAIL INVESTORS 2001. By continuing to access this document from within Australia, you represent to MOODY’S that you are, or are accessing the document as a
AND IT WOULD BE RECKLESS AND INAPPROPRIATE FOR RETAIL INVESTORS TO USE MOODY’S CREDIT RATINGS, ASSESSMENTS, OTHER representative of, a “wholesale client” and that neither you nor the entity you represent will directly or indirectly disseminate this document or its contents to
OPINIONS OR PUBLICATIONS WHEN MAKING AN INVESTMENT DECISION. IF IN DOUBT YOU SHOULD CONTACT YOUR FINANCIAL OR OTHER “retail clients” within the meaning of section 761G of the Corporations Act 2001. MOODY’S credit rating is an opinion as to the creditworthiness of a debt
PROFESSIONAL ADVISER. obligation of the issuer, not on the equity securities of the issuer or any form of security that is available to retail investors.
ALL INFORMATION CONTAINED HEREIN IS PROTECTED BY LAW, INCLUDING BUT NOT LIMITED TO, COPYRIGHT LAW, AND NONE OF SUCH Additional terms for Japan only: Moody's Japan K.K. (“MJKK”) is a wholly-owned credit rating agency subsidiary of Moody's Group Japan G.K., which is
INFORMATION MAY BE COPIED OR OTHERWISE REPRODUCED, REPACKAGED, FURTHER TRANSMITTED, TRANSFERRED, DISSEMINATED, wholly-owned by Moody’s Overseas Holdings Inc., a wholly-owned subsidiary of MCO. Moody’s SF Japan K.K. (“MSFJ”) is a wholly-owned credit rating
REDISTRIBUTED OR RESOLD, OR STORED FOR SUBSEQUENT USE FOR ANY SUCH PURPOSE, IN WHOLE OR IN PART, IN ANY FORM OR agency subsidiary of MJKK. MSFJ is not a Nationally Recognized Statistical Rating Organization ( “NRSRO”). Therefore, credit ratings assigned by MSFJ
MANNER OR BY ANY MEANS WHATSOEVER, BY ANY PERSON WITHOUT MOODY’S PRIOR WRITTEN CONSENT. are Non-NRSRO Credit Ratings. Non-NRSRO Credit Ratings are assigned by an entity that is not a NRSRO and, consequently, the rated obligation will not
qualify for certain types of treatment under U.S. laws. MJKK and MSFJ are credit rating agencies registered with the Japan Fi nancial Services Agency and
MOODY’S CREDIT RATINGS, ASSESSMENTS, OTHER OPINIONS AND PUBLICATIONS ARE NOT INTENDED FOR USE BY ANY PERSON AS A their registration numbers are FSA Commissioner (Ratings) No. 2 and 3 respectively.
BENCHMARK AS THAT TERM IS DEFINED FOR REGULATORY PURPOSES AND MUST NOT BE USED IN ANY WAY THAT COULD RESULT IN THEM
BEING CONSIDERED A BENCHMARK. MJKK or MSFJ (as applicable) hereby disclose that most issuers of debt securities (including corporate and municipal bonds, debentures, notes and
commercial paper) and preferred stock rated by MJKK or MSFJ (as applicable) have, prior to assignment of any credit rating, agreed to pay to MJKK or
All information contained herein is obtained by MOODY’S from sources believed by it to be accurate and reliable. Because of the possibility of human or MSFJ (as applicable) for credit ratings opinions and services rendered by it fees ranging from JPY125,000 to approximately JPY250,000,000.
mechanical error as well as other factors, however, all information contained herein is provided “AS IS” without warranty of any kind. MOODY'S adopts all
necessary measures so that the information it uses in assigning a credit rating is of sufficient quality and from sources MOODY'S considers to be reliable MJKK and MSFJ also maintain policies and procedures to address Japanese regulatory requirements.
including, when appropriate, independent third-party sources. However, MOODY’S is not an auditor and cannot in every instance independently verify or
validate information received in the rating process or in preparing its Publications.
To the extent permitted by law, MOODY’S and its directors, officers, employees, agents, representatives, licensors and suppliers disclaim liability to any
person or entity for any indirect, special, consequential, or incidental losses or damages whatsoever arising from or in connection with the information
contained herein or the use of or inability to use any suc h information, even if MOODY’S or any of its directors, officers, employees, agents, representatives,
licensors or suppliers is advised in advance of the possibility of such losses or damages, including but not limited to: (a) any loss of present or prospective
profits or (b) any loss or damage arising where the relevant financial instrument is not the subject of a particular credit r ating assigned by MOODY’S.
June 2021 22V-Shaped Recovery
Prime age employment-population ratio, %
83
81 Full employment
79
77
75 Key forecast assumptions:
- Herd immunity by July
73 - $3 trillion Build Back Better plan
71 - Fed raises rates beginning in early 2023
- Normalization of immigration (1m per annum)
69
85 90 95 00 05 10 15 20
Sources: BLS, Moody’s Analytics
June 2021 23Robust Housing Demand
Existing and new single-family home sales, mil, SAAR
7.0
6.0
5.0
4.0 Existing homes
3.0 New homes
2.0
1.0
0.0
00 01 02 03 04 05 06 07 08 09 10 11 12 13 14 15 16 17 18 19 20 21
Sources: NAR, Moody’s Analytics
June 2021 24Homebuilding Picks-Up
Single-family and multi-family residential housing permits, mil
2,000
1,800 Single-family
1,600 Multi-family
1,400
1,200
1,000
800
600
400
200
0
00 03 06 09 12 15 18 21
Sources: NAR, Moody’s Analytics
June 2021 25You can also read