11 BI TRENDS FOR 2018 - QlikTech
←
→
Page content transcription
If your browser does not render page correctly, please read the page content below

11     BI TRENDS
       FOR 2018
Data De-silofication:
The Secret to Success in the
Analytics Economy
“De-silofication”
What is it?

Many successful companies today have found                THE QUESTION IS:
their own ways of connecting data, people, and            How do we balance the move
ideas. What sets them apart is how they are taking
advantage of an unstoppable force — the increased
                                                          into an analytics economy
fragmentation of data, computing, and usage.              while maintaining privacy?
                                                          It’s about taking fragmented
Undergoing this insight-driven digital transformation
— leveraging data as a strategic asset to better inform
                                                          data, people, and ideas out
business decisions — is more popular than ever,           of their silos and connecting
and is therefore increasing the need for data literacy    them in agile, innovative, and
across an organization. But adjusting to this new         governed ways — known as
reality can be challenging. With information chaos
making headlines in 2017, the data landscape can be
                                                          the “de-silofication” of data.
challenging to navigate, prompting an increased need
for governance, security, and data quality.
We’ve identified 11 emerging trends
that will start to make this possible for
organizations in 2018, helping them to
transform their business.
Read on to find out what
they are, and how
you can help your
business make
this move.

TREND   Data literacy will gain company-wide
 1      and societal priority.

        How is it changing BI?
        Data literacy, known as the ability to read, work with, analyze, and argue
           with data, is becoming more important in today’s analytics economy.
                In fact, Gartner¹ predicts “by 2020 80% of organizations
                    initiate deliberate competency development in the field of
                        data literacy, acknowledging their extreme deficiency.” To
                           begin making this change, leading software companies
                             will begin offering these types of programs in 2018,
                               and good user organizations will take a structured
                                 approach to increasing data literacy.
                              Source: Gartner: Information as a Second Language: Enabling Data Literacy for Digital Society;
                              1

                              February 2017

                                  HOW CAN I GET STARTED?
                                  Find out how data literate you are, plus how
                                  to increase your skills.

                                      READ MORE »
50%

TREND   Hybrid multi-cloud will emerge
 2      to connect the dots.
        How is it changing BI?
        The rapid increase of cloud services will exceed even the amount that IT
        leaders think they have. But in 2018, some data will need to be moved
            out of the cloud for regulatory, security, cost, and performance
                 purposes. This, in addition to more computing at “the edge,”
                    will lead to fragmented data and application domains.

                        This means analytical architectures that can handle
                         multi-cloud, multi-platform, and hybrid environments
                           will become the new norm.

                               HOW CAN I GET STARTED?
                               Learn some of the key questions to ask a cloud
                               analytics vendor.

                                 LEARN MORE »
Currently, Netskope¹
estimates that the
average enterprise
runs approximately
1,000 different
cloud services.

Source: Netskope: Netskope Cloud Report, September 2017
1
TREND   Data gets edgy.
 3      How is it changing BI?
        There is a growing number of use cases, especially around IoT,
        offline mobile, and immersive analytics, where it’s more beneficial
        for organizations to run workloads locally instead of through
          public data centers.

                  As a result, 2018 will see a dramatic increase of
                    workloads run directly on a variety of devices —
                       as sometimes this approach is better suited for
                         latency, bandwidth, autonomy, and privacy.

                                HOW CAN I GET STARTED?
                                Understand the value of IoT, and why bringing
                                data associations together is important.

                                  LEARN MORE »
By 2019, at least 40% of

 40%
                                            IoT-created data will be stored,
                                            processed, analyzed, and acted
                                            upon close to, or at the edge
                                            of, the network.¹

                              By 2022, as a result of digital business
                              projects 75% of enterprise-generated data

75%                           will be created and processed outside
                              the traditional centralized data center or
                              cloud — an increase from less—than
                              10% generated today.²

  ¹IDC: FutureScape: Worldwide Internet of Things (IoT) 2017 Predictions
  ²Gartner: Start Moving Data Management Capabilities Toward the Edge, Ted Friedman, September 2017
TREND   Big Data, data discovery, and data
 4      science will converge.
        How is it changing BI?
        Typically, these three areas are separate because their users have
        different tools and skill sets. And while this should still be the case
              sometimes (e.g., data scientists and engineers should be the ones
                  working with algorithms and data models), now there are a lot
                     more ways to share their work with a broader audience.

                        Promising progress in machine intelligence, big data
                         indexing, and engine-to-engine integration is opening
                           new opportunities for users to fully explore many big,
                            complex, and varied data sets.

                               HOW CAN I GET STARTED?
                               Learn about On Demand App Generation,
                               which is just one of several ways to manage
                               your Big Data sets.

                                 WATCH VIDEO »
TREND Data catalogs will become the
5 next frontier for self-service.
How is it changing BI?
For a person to be truly data literate it’s important for them not only to be able to
analyze data, but also have the ability to read, work with, and argue with it. As a
result, in recent years it’s become easier to go beyond self-service analysis
into self-service data preparation in a more visually compelling way. In
2017, we’ve seen the same self-service trend emerging around data
catalogs. But they’ve still largely been for experts, applied on top
of data lakes.
In 2018, new ways of cataloging data will be more
deeply integrated with the data preparation and analysis
experience. This will help bring it to a broader audience
that is able to easily combine governed corporate data,
data lakes, and external data as a service.
HOW CAN I GET STARTED?
Find out why organizations are moving
to a self-service model:
READ MORE »TREND Need for interoperability and new
6 business models puts focus on APIs.
How is it changing BI?
As data, computing, and usage become more distributed, so do the technology
environments of corporations. Companies are no longer looking for end-to-end
solutions and single stacks as it doesn’t look like their architectures. Rather,
they look for parts that can easily be stitched together, as it’s more
important that different software systems talk to each other.
This means that analytics platforms in this new environment
need to be open and interoperable, with extensibility,
embeddability, and modern APIs. This interoperability will
shift analytics from one destination to become more
embedded in workflows, blurring the line between BI
applications as we know them today to data-driven apps
that fuel the analytics economy.
HOW CAN I GET STARTED?
Learn how the Qlik® Analytics Platform can
help you see the importance of open APIs.
LEARN MORE »TREND Blockchain hype will drive experimental
7 applications beyond cryptocurrencies.
How is it changing BI?
New techniques are emerging for processing, managing, and integrating
distributed data, making the location of data an increasingly smaller
factor in information strategies. This means ideas can be inspired
by blockchain and peer-to-peer technologies. While this is still
in the beginning stages, 2018 will see innovation move
beyond cryptocurrencies to experimental applications for
analytics and data management.
Initially, connectivity to the blockchain ledger will
have benefits. But ultimately, the value might lie in
the ability to verify lineage and authenticity of data
using blockchain technology.
HOW CAN I GET STARTED?
Help your developers become more experimental
with their apps by giving them the tools they need.
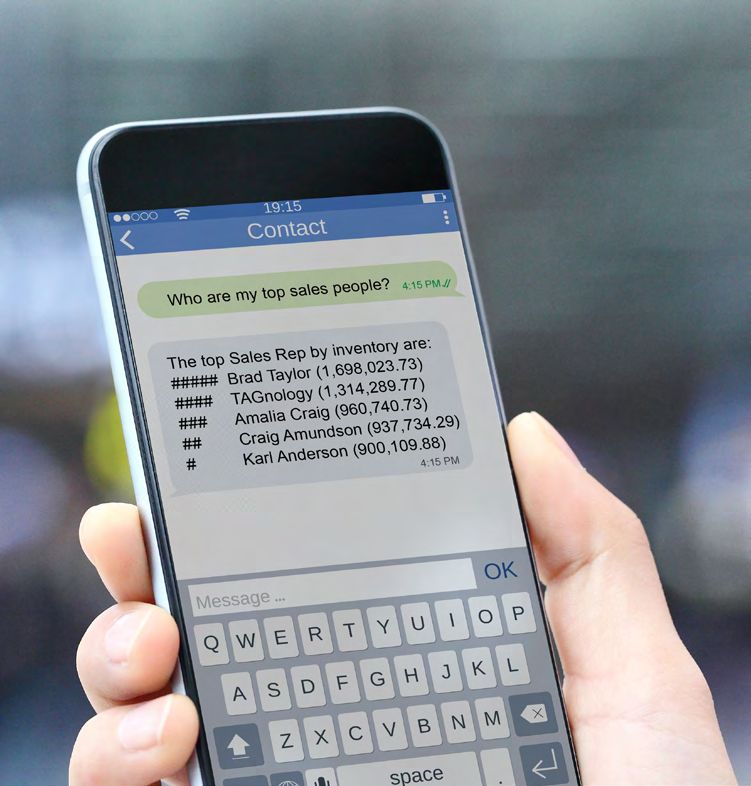
VISIT QLIK BRANCH »TREND Analytics become conversational.
8 How is it changing BI?
The use of analytics has traditionally been focused on drag-and-drop
style dashboard list boxes and/or visualization. While there continues
to be value in that, there are now more approaches available for
“conversational analytics,” simplifying the analysis, findings, and
storytelling so that users more easily get to that one crucial
data point.
This can include natural language query, processing,
and generation augmented by search and voice.
This technology, helped by virtual assistants and
chatbots through API integration, provide a new
means of interaction.
HOW CAN I GET STARTED?
Experience conversational analytics firsthand
with the Qlik® Bot.
NODE VERSION » BOT VERSION »TREND Reporting redefined.
9 This time highly contextualized.
How is it changing BI?
We realize that everyone might not be able to explore their data in detail every
time, meaning we will see users with varying levels of skillsets. This means
that in 2018, reporting will start to become redefined through providing
both analysts and participants with highly contextualized information —
inverting analytics as we know it today.
Rather than having to go to a destination to perform an
analysis, it will come to users embedded right into their work
space, getting the right information to the right people,
at the right time, in the right place, and in the right
context. And in that process, many more people will be
empowered with data and analytics than ever before.
HOW CAN I GET STARTED?
Learn how using a search-based user interface
increases productivity and efficiency.
DOWNLOAD REPORT »TREND Analytics become immersive.
10 How is it changing BI?
Given that the price of virtual reality devices remains a bit too steep for
mainstream adoption, we are still several years away from augmented
reality. The breakthroughs likely will happen in enterprise use cases,
with analytics playing a role. But immersive experiences can also
take on other formats where users become engaged from a
sensorial and social standpoint.
Through better user interfaces, large-scale displays in
digital situation rooms, better storytelling with data,
and collaborative features, more people will be
drawn to using analytics.
HOW CAN I GET STARTED?
Go beyond visualizations. Discover the secrets
of storytelling:
LEARN MORE »TREND Augmented intelligence system changes
11 users into participants and facilitators.
How is it changing BI?
Because Augmented Intelligence will be an essential component of all the trends
featured, it is the 11th trend for 2018.
In its current state, the most effective use of Artificial Intelligence (AI) is
applying it to a diverse but specific set of problems. But in 2018 and
beyond, blending AI with technologies such as intelligent agents,
bots, and automated activities, along with traditional analytical
tools such as data sets, visualization, dashboards, and reports
will make data more useful. That alone, however, isn’t
enough. Instead, a system where machine intelligence
and humans participate in a broader ecosystem, and the
exchange and learnings that happen between them, is
known as augmented intelligence.
HOW CAN I GET STARTED?
Learn how you can implement augmented
intelligence in your organization.
LEARN MORE »GOVERNANCE, SECURITY, AND DATA QUALITY are becoming more crucial initiatives in an increasingly challenging environment. But to thrive in the analytics economy, organizations need novel ways of doing that while also addressing progressively distributed environments. Leveraging a truly open platform with an ecosystem harnessing the latest emerging trends, technologies, and methods will bring together data, people, and ideas. This will lead to more data literate users, innovation, and augmented intelligence — helping to successfully integrate data into our lives.
READY TO GET STARTED?
     Qlik® can help. Take the first step to succeeding in the analytics economy by
  breaking down the silos that exist between your data, people, and ideas with Qlik’s
innovative, associative technology. Our platform enables you to bring together all your
data, letting you freely explore it in any direction, with no data left behind and no path
     uncovered. Discover your key to success with the Associative Difference™.

                          DISCOVER WHAT YOUR DATA CAN DO »
qlik.com ©2018 QlikTech International AB. All rights reserved. Qlik®, Qlik Sense®, QlikView®, QlikTech®, Qlik Cloud®, Qlik DataMarket®, Qlik Analytics Platform®, Qlik NPrinting®, Qlik Connectors®, Qlik GeoAnalytics®, Associative Difference™ and the QlikTech logos are trademarks of QlikTech International AB which have been registered in multiple countries. Other marks and logos mentioned herein are trademarks or registered trademarks of their respective owners.
You can also read