ASSESSING THE SUSTAINABILITY OF THE BELGIAN HEALTH SYSTEM USING PROJECTIONS - SUPPLEMENT: TECHNICAL SHEETS FOR INDICATORS - KCE
←
→
Page content transcription
If your browser does not render page correctly, please read the page content below

KCE REPORT 341S

ASSESSING THE SUSTAINABILITY OF THE
BELGIAN HEALTH SYSTEM USING PROJECTIONS
SUPPLEMENT: TECHNICAL SHEETS FOR INDICATORS

2021                                          www.kce.fgov.be

KCE REPORT 341S
HEALTH SERVICES RESEARCH

ASSESSING THE SUSTAINABILITY OF THE BELGIAN HEALTH
SYSTEM USING PROJECTIONS
SUPPLEMENT: TECHNICAL SHEETS FOR INDICATORS

MÉLANIE LEFÈVRE, SOPHIE GERKENS

2021                                          www.kce.fgov.be

COLOPHON
Title :                 Assessing the sustainability of the Belgian health system using projections – Supplement: technical sheets for
                        indicators
Authors :               Mélanie Lefèvre (KCE), Sophie Gerkens (KCE)
Project facilitator:    Nathalie Swartenbroekx (KCE)
External Experts :      Elise Boucq (Federal Planning Bureau), Nicole Fasquelle (Federal Planning Bureau), Joanna Geerts (Federal
                        Planning Bureau), Pieter-Jan Miermans (FOD Volksgezondheid – SPF Santé Publique), Johan Peetermans
                        (RIZIV – INAMI), Peter Willemé (Federal Planning Bureau)
Stakeholders:           The following administrations and public institutions have been consulted throughout the duration of the project.
                        At the federal level:
                        •   Representative of Minister of Health: Bernard Lange
                        •   INAMI – RIZIV: Mickaël Daubie, Marine Lutgen, Pascal Meeus
                        •   SPF Santé Publique – FOD Volksgezondheid: Lieven Deraedt, Pol Gerits, Peter Jouck, Annick Poncé,
                            Pascale Steinberg, Timmy Van Dijck, Veerle Vivet, Harun Yaras
                        •   Sciensano: Brecht Devleesschauwer, Françoise Renard
                        •   SPF Sécurité Sociale – FOD Sociale Zekerheid: Dirk Moens, Rudi Van Dam
                        At the regional level:
                        •   Vlaamse Gemeenschap (Vlaams Agentschap Zorg en Gezondheid): Erik Hendrickx
                        •   Région Wallonne (Direction générale opérationnelle des Pouvoirs locaux, de l’Action sociale et de la Santé et
                            observatoire wallon de la santé): Anouck Billiet, Dominique Dubourg
                        •   Fédération Wallonie-Bruxelles (Direction générale de la Santé): Annalisa Tancredi
                        •   Communauté Germanophone (DGOV Ministerium der Deutschsprachigen Gemeinschaft): Karin Cormann
                        •   Région Bruxelles Capitale (Observatoire de la Santé et du Social): Olivier Gillis, Elise Mendes da Costa

External Validators :   Jon Cylus (European Observatory on Health Systems and Policies), Gaetan Lafortune (OECD – Organisation for
                        Economic Cooperation and Development), Karel Van den Bosch (Federal Planning Bureau)
Acknowledgements: Irina Cleemput (KCE), Christelle Durand (SPF Santé Publique – FOD Volksgezondheid), Marijke Eyssen (KCE),
Christophe Janssens (KCE), Karin Rondia (KCE), Sabine Stordeur (KCE), Carine Van de Voorde (KCE)
Reported interests: All experts and stakeholders consulted within this report were selected because of their involvement in the topic
of projection-based indicators and/or health system performance assessment. Therefore, by definition, each of
them might have a certain degree of conflict of interest to the main topic of this report.
Layout : Ine Verhulst
Disclaimer : • The external experts were consulted about a (preliminary) version of the scientific report. Their
comments were discussed during meetings. They did not co-author the scientific report and did not
necessarily agree with its content.
• Subsequently, a (final) version was submitted to the validators. The validation of the report results
from a consensus or a voting process between the validators. The validators did not co-author the
scientific report and did not necessarily all three agree with its content.
• Finally, this report has been approved by common assent by the Executive Board.
• Only the KCE is responsible for errors or omissions that could persist. The policy recommendations
are also under the full responsibility of the KCE
Publication date 18 June 2021
Domain: Health Services Research (HSR)
MeSH : Delivery of Health Care; Forecasting; Health expenditure; Health Workforce
NLM Classification : W84
Language : English
Format : Adobe® PDF™ (A4)
Legal depot : D/2021/10.273/15
ISSN: 2466-6459
Copyright : KCE reports are published under a “by/nc/nd” Creative Commons Licence
http://kce.fgov.be/content/about-copyrights-for-kce-publications.How to refer to this document? Lefèvre M, Gerkens S. Assessing the sustainability of the Belgian health system using projections – Supplement.
Health Services Research (HSR) Brussels: Belgian Health Care Knowledge Centre (KCE). 2021. KCE Reports
341S. D/2021/10.273/15.
This document is available on the website of the Belgian Health Care Knowledge CentreKCE Report 341S Performance of the Belgian health system: projection-based indicators 1
APPENDIX REPORT
TABLE OF CONTENTS 1. SUSTAINABILITY: PROJECTION-BASED INDICATORS .................................................................. 3
1.1. PHYSICIAN WORKFORCE DEMAND (S-18)....................................................................................... 3
1.1.1. Documentation sheet .............................................................................................................. 3
1.1.2. Results .................................................................................................................................... 6
1.2. PHYSICIAN WORKFORCE SUPPLY (S-19) ...................................................................................... 14
1.2.1. Documentation sheet ............................................................................................................ 14
1.2.2. Results .................................................................................................................................. 19
1.3. PUBLIC EXPENDITURE ON HEALTH (S-20) .................................................................................... 24
1.3.1. Documentation sheet ............................................................................................................ 24
1.3.2. Results .................................................................................................................................. 26
LIST OF FIGURES Figure 1 – Structure of the projection model..................................................................................................... 5
Figure 2 – Projected number of contacts (consultations and visits) with GPs in Belgium (2020-2025) ........... 7
Figure 3 – Projected number of contacts (consultations and visits) with GPs in the three Belgian regions
(2020-2025) ...................................................................................................................................................... 8
Figure 4 – Projected number of contacts (consultations and visits) with physicians in Belgium
(2020-2025) ...................................................................................................................................................... 9
Figure 5 – Projected number of contacts (consultations and visits) with physicians in the three
Belgian regions (2020-2025) .......................................................................................................................... 10
Figure 6 – Stock-and-flow model for the projection of healthcare workforce ................................................. 16
Figure 7 – Number of GPs active in the healthcare sector, in individuals and FTEs, in Belgium and its
linguistic communities, 2016-2036 .................................................................................................................. 192 Performance of the Belgian health system: projection-based indicators KCE Report 341S
Figure 8 – Evolution in the workforce of GPs (in individuals and FTEs) between 2016 and 2036 in
Belgium and its linguistic communities ........................................................................................................... 20
Figure 9 – Number of physicians active in the healthcare sector, in individuals and FTEs, in
Belgium and its linguistic communities, 2016-2036 ........................................................................................ 21
Figure 10 – Evolution in the physician workforce (in individuals and FTEs) between 2016 and 2036 in
Belgium and its linguistic communities ........................................................................................................... 22
Figure 11 – Public expenditure on acute and long-term care (% of GDP) in Belgium (2000-2019 and
projections 2020-2070) ................................................................................................................................... 28
Figure 12 – Public expenditure on health (% of GDP) financed by the federal state or by federated
entities and local authorities (2000-2019 and projections 2020-2070) ........................................................... 29
Figure 13 – Projections of public expenditure on health (% of GDP) ............................................................. 30
Figure 14 – Public expenditure on health (% of GDP) in Belgium and EU28 (projections 2016-2070) ......... 31
Figure 15 – Public expenditure on acute and long-term care (% of GDP) in Belgium and EU28
(projections 2016-2070) .................................................................................................................................. 32
LIST OF TABLES Table 1 – Components of the projection model ................................................................................................ 5
Table 2 – Projected increase in the number of contacts with GPs and all physicians in Belgium
(2020-2025) .................................................................................................................................................... 11
Table 3 – Projected increase in the number of contacts with GPs in the three Belgian regions
(2020-2025) .................................................................................................................................................... 12
Table 4 – Projected increase in the number of contacts with physicians in the three Belgian regions
(2020-2025) .................................................................................................................................................... 13
Table 5 – Parameters used in the stock-and-flow projection model ............................................................... 17
Table 6 – Projected five year evolution of physician workforce ...................................................................... 23
Table 7 – Public expenditure on health in Belgium (2016-2019 and projections 2020-2070) ........................ 27
Table 8 – Projections of public expenditure on health in Belgium: reference and alternative scenario ......... 28KCE Report 341S Performance of the Belgian health system: projection-based indicators 3
1. SUSTAINABILITY: PROJECTION-BASED INDICATORS
1.1. Physician workforce demand (S-18)
1.1.1. Documentation sheet
Description Principal indicator: Projected number of contacts with general practitioners up to 2025.
Secondary indicator: Projected number of contacts with physicians up to 2025.
Calculation PROMES (PROjecting Medical Spending) is a microsimulation model developed by the Federal Planning Bureau, in collaboration with RIZIV – INAMI. The
model provides a detailed analytical vision of the determinants of the evolution of healthcare expenditure covered by compulsory health insurance and makes
it possible to project these in the short and medium term.
In what follows, we use the projections of care consumption (number of contacts (consultations and visits) with physicians) to quantify the evolution of the
demand for healthcare professionals.
Care consumption is modelled on the basis of micro data from the Permanent Sample (EPS) of IMA – AIM. The model consists of about 25 modules
corresponding to different expenditure groups. In what follows, the module “physicians’ fees” is used. Care consumption is modelled using a two-step model
in which the probability of use (step 1) and the volume (step 2) are explained in function of individual demographic and socio-economic characteristics,
indicators of morbidity, previous consumption and environmental factors. Projections for exogenous variables are made on the basis of a dynamic projection
model and aligned with available external data (such as demographic projections, etc.).
The model is illustrated in Figure 1. The different components of the model are described in Table 1. More details can be found in Geerts et al. (2018).1
Projections are made separately for four sub-modules: GP consultations, GP visits, medical specialist contacts and emergency specialist contacts. Results
from the first two categories are aggregated to measure the projected number of contacts with GPs (main indicator) and results from all four categories are
aggregated to measure the projected number of contacts with physicians (secondary indicator).
The following services are not included in the calculation of the number of contacts: advices, technical medical services, medical assistance during urgent
transfer by ambulance to the hospital, psychotherapies, management and renewal of the global medical file with/without MyCareNet, management and
renewal of the global medical file for patients with a chronic condition, expansion of the global medical file for patients with a chronic condition, follow-up of
patients with type 2 diabetes, care path contract for renal insufficiency, care path contract for diabetes, permanence and availability.
Results are presented for Belgium and by region (based on the patient’s place of residence).
Limitations Missing determinants of care consumption: the model uses data from the Permanent Sample, which does not contain information on some individual
characteristics that may influence demand for care: (household) income, level of education, lifestyle (diet, alcohol and tobacco consumption, physical activity,
etc.), medical background, professional situation, etc.
Quality of the projection of the exogenous variables: even if the PROMES model explains the consumption of care, it was primarily designed to carry out
projections and simulations of policies. Consequently, the quality of the results of the model depends not only on the "completeness" of the estimated model,
but also on the quality of the projection of the exogenous variables (those which are not explained by the model). Although this aspect does not play an
important role for policy simulation (where the emphases is put on the deviation from the base simulation), this is particularly important for the base projections
that are used here. One must keep in mind that the model is used here for a different purpose (i.e. projection of physician workforce demand) from the one it
was designed for.4 Performance of the Belgian health system: projection-based indicators KCE Report 341S
Medical density: in the behavioural model (see Figure 1 and Table 1), medical density is used as an explanatory variable. In addition, when results from the
behavioural model are reweighted so that they can be applied to future populations, medical density is projected using projections of supply of healthcare
professionals as described in indicator S-19. As one purpose of this indicator of future demand is to compare it to projections of future supply of healthcare
professionals (indicator S-19) one may see this as an endogeneity issue. However, medical density only plays a minor role in the behavioural model.
Nevertheless, to assess the importance of this effect, we also present results from an alternative scenario where medical density projections are maintained
artificially constant from 2020 onwards.
Consumption of care is used as a proxy for the demand of care and does not correspond to needs nor to health objectives (see for instance Cookson et al.
20132 and Benahmed et al., 20183).
Rationale Projected numbers of contacts with physicians are used as proxies for the demand for such physicians. Future trends in consumption must be analysed in
regard with future trends in supply of these health professionals in order to anticipate a potential future imbalance.
In the model of workforce projection used by the Planning Commission of medical supply (see indicator S-19), future demand is already taken into account.
Indeed, in that model, workforce density is weighted by healthcare consumption. However: (1) consumption is measured by expenditures but fees are not
proportional to the time spent with a patient and (2) basis scenario projections account only for the evolution of population but suppose consumption is
unchanged in each segment of the population. With respect to both aspects, projected numbers of contacts with physicians from the PROMES model are
better suited to estimate future demand. For that reason, projected numbers of contacts with physicians from the PROMES model are used in this report as
an indicator of future workforce demand (indicator S-18) and the indicator of future workforce supply (S-19) will be cleaned from demand effects.
Data source Federal Planning Bureau, RIZIV – INAMI, IMA – AIM
Dimension Sustainability
Related S-19 – Physician workforce supply (projections of supply of GPs, in individuals and FTEs; projections of supply of physicians, in individuals and FTEs)
indicatorsKCE Report 341S Performance of the Belgian health system: projection-based indicators 5
Figure 1 – Structure of the projection model
Table 1 – Components of the projection model
Element Explanation
Permanent Sample The Permanent Sample is a longitudinal administrative database containing data on healthcare services covered by the compulsory
health insurance for a sample of the population made up of around 1/40 of the insured persons under 65 and 1/20 of the insured persons
aged 65 and over.
Behavioural Model The estimation of the behavioural model is carried out on a sample of 50% of the Permanent Sample (n> 150 000) for the period 2010-
2017. The behavioural model, at the individual level, links consumption of care to relevant individual characteristics such as age
category, gender, health status, employment status and insured status. It allows to estimate, from specific characteristics of an individual,
the probability of using care and the volume of this care.
In particular, for consultations and visits of physicians, the probability of using care is modelled using logistic regressions including the
following exogenous characteristics (for more details, see Geerts et al., 20184):
- Demographics: age group, gender, interaction age-gender
- Individual health status: general health status indicator, chronic illness/invalidity indicator, specific chronic illness indicator
- Flu epidemic variable at the national level
- Social status: unemployment status, long-term unemployment status, isolated/cohabiting status
- Insurance status: entitlement to increased reimbursement status, global medical file, maximum billing reimbursement6 Performance of the Belgian health system: projection-based indicators KCE Report 341S
- Living environment: district, urbanisation level
- Medical density of physicians
- Co-payment (“ticket modérateur / remgeld”)
and the following endogenous characteristics representing previous care:
- Hospitalisation (t-1, t-2, t-3)
- Contacts with physicians (t-1)
The volume of care is then modelled using a truncated-Poisson model.
Reweighting Results from the behavioural models are reweighted so that they can be applied to future populations. Adjustments are made, either
using external data when available, or using a separate dynamic microsimulation model for the projection of exogenous variables (on a
yearly basis, based on the Permanent Sample 2008-2017). This dynamic projection model simulates the aging, year after year, of the
individuals in the Permanent Sample, and the undergoing transitions between the categories of the various exogenous variables. Births,
deaths, immigrations and emigrations are also simulated.
- Demographic characteristics are projected using demographic projections made by the Federal Planning Bureau and Statbel
- Individual health status characteristics are projected using the dynamic microsimulation model
- Flu epidemic variable is projected using historical data from Sciensano
- Social status characteristics are projected using the dynamic microsimulation model aligned with households and
unemployment projections made by the Federal Planning Bureau
- Insurance status characteristics are projected using the dynamic microsimulation model
- Urbanisation level is projected using the dynamic microsimulation model
- Medical densities are projected using projections of supply of healthcare professionals made by the Planning Commission of
medical supply supported by the Planning Unit for the Supply of the Health Care Professions, FPS Public Health, Food Chain
Safety and Environment
1.1.2. Results
In 2017, there were around 47.7 million contacts (consultations and visits) Between 2020 and 2025, the number of contacts with GPs in Belgium is
with GPs in Belgium. This number is expected to increase to 50.7 million in expected to increase by 7.1% (alternative scenario, Table 2). The increase
2025 which represents an average annual increase of 0.8% (base scenario, is a bit lower in Brussels (5.5%) than in Wallonia (7.0%) and Flanders (7.4%)
Figure 2). When maintaining medical density artificially constant (i.e. (alternative scenario, Figure 3 and Table 3).
neutralising potential induced demand effect), the expected increase in the
number of contacts with GPs is slightly larger, up to 51.9 million in 2025, that
is an average annual increase of 1.1% (alternative scenario, Figure 2).KCE Report 341S Performance of the Belgian health system: projection-based indicators 7 Figure 2 – Projected number of contacts (consultations and visits) with GPs in Belgium (2020-2025) Source: Federal Planning Bureau, PROMES model estimates June 2020 based on EPS 13. In the alternative scenario, medical density projections are maintained artificially constant. The peak in 2018 may be due to different factors such as the introduction of eAttest for GP consultations (GPs submit financial statements directly to the sickness fund rather than on paper to the patient) which accelerated the reimbursement and booking; a longer influenza peak in 2018; the projected values of other exogenous variables.
8                                              Performance of the Belgian health system: projection-based indicators                                 KCE Report 341S

Figure 3 – Projected number of contacts (consultations and visits) with GPs in the three Belgian regions (2020-2025)

Source: Federal Planning Bureau, PROMES model estimates June 2020 based on EPS 13. In the alternative scenario (represented by plain dots), medical density projections
are maintained artificially constant. Empty dots depict the base scenario. Region is determined by the patient’s place of residence.

For all physicians in Belgium in 2017, there were around 78.5 million                   Between 2020 and 2025, the number of contacts with physicians in Belgium
contacts (consultations and visits). The number of contacts with physicians             is expected to increase by 7.9% (alternative scenario, Table 2). The increase
is expected to increase to 85.8 million in 2025 which represents an average             is a bit lower in Brussels (6.6%) than in the two other regions (8.0%)
annual increase of 1.1% (base scenario, Figure 4). When maintaining                     (alternative scenario, Figure 5 and Table 4).
medical density artificially constant (i.e. neutralising potential induced
demand effect), the expected number of contacts in 2025 is 87.4 million,
corresponding to an average annual increase of 1.4% (alternative scenario,
Figure 4).
KCE Report 341S                                Performance of the Belgian health system: projection-based indicators                                                      9

Figure 4 – Projected number of contacts (consultations and visits) with physicians in Belgium (2020-2025)

Source: Federal Planning Bureau, PROMES model estimates June 2020 based on EPS 13. In the alternative scenario, medical density projections are maintained artificially
constant.
10                                             Performance of the Belgian health system: projection-based indicators                                 KCE Report 341S

Figure 5 – Projected number of contacts (consultations and visits) with physicians in the three Belgian regions (2020-2025)

Source: Federal Planning Bureau, PROMES model estimates June 2020 based on EPS 13. In the alternative scenario (represented by plain dots), medical density projections
are maintained artificially constant. Empty dots depict the base scenario. Region is determined by the patient’s place of residence.
KCE Report 341S                                Performance of the Belgian health system: projection-based indicators                                                  11

Table 2 – Projected increase in the number of contacts with GPs and all physicians in Belgium (2020-2025)
                                    GPs                                       Physicians
                                       Projected annual increase
                   base scenario        alternative scenario    base scenario      alternative scenario
 2020                  0.23%                  0.67%                  0.66%                 0.99%
 2021                  1.06%                  1.57%                  1.29%                 1.68%
 2022                  0.94%                  1.40%                  1.19%                 1.56%
 2023                  0.88%                  1.33%                  1.15%                 1.50%
 2024                  0.82%                  1.29%                  1.09%                 1.44%
 2025                  1.31%                  1.36%                  1.39%                 1.45%
                                      Projected five year increase
 2020-2025             5.10%                  7.14%                  6.26%                 7.87%
Source: Federal Planning Bureau, PROMES model estimates June 2020 based on EPS 13. In the alternative scenario, medical density projections are maintained artificially
constant.
12 Performance of the Belgian health system: projection-based indicators KCE Report 341S
Table 3 – Projected increase in the number of contacts with GPs in the three Belgian regions (2020-2025)
Brussels Flanders Wallonia
Projected annual increase (alternative scenario)
2020 -0.23% 0.73% 0.71%
2021 0.70% 1.59% 1.69%
2022 1.26% 1.42% 1.37%
2023 1.31% 1.33% 1.32%
2024 0.70% 1.40% 1.18%
2025 1.44% 1.42% 1.23%
Projected five year increase (alternative scenario)
2020-2025 5.52% 7.36% 6.97%
Source: Federal Planning Bureau, PROMES model estimates June 2020 based on EPS 13. In the alternative scenario, medical density projections are maintained artificially
constant. Region is determined by the patient’s place of residence.KCE Report 341S Performance of the Belgian health system: projection-based indicators 13
Table 4 – Projected increase in the number of contacts with physicians in the three Belgian regions (2020-2025)
Brussels Flanders Wallonia
Projected annual increase (alternative scenario)
2020 0.32% 1.05% 1.05%
2021 1.13% 1.70% 1.79%
2022 1.16% 1.57% 1.64%
2023 1.68% 1.49% 1.49%
2024 1.14% 1.51% 1.38%
2025 1.32% 1.47% 1.45%
Projected five year increase (alternative scenario)
2020-2025 6.60% 7.98% 7.98%
Source: Federal Planning Bureau, PROMES model estimates June 2020 based on EPS 13. In the alternative scenario, medical density projections are maintained artificially
constant. Region is determined by the patient’s place of residence.
References
[1] Geerts J, Van den Bosch K, Willemé P. PROMES – Un nouvel instrument de projection des dépenses de l’AMI pour les soins de santé. Brussels:
Bureau Fédéral du Plan; 2018.
[2] Cookson R, Sainsbury R, Glendinning C. Jonathan Bradshaw on Social Policy: Selected writings 1972-2011. York: University of York; 2013.
[3] Benahmed N, Deliège D, De Wever A, Pirson M. La planification des médecins en Europe: une revue de la littérature des modèles de projection. Revue
d'Épidémiologie et de Santé Publique. 2018;66(1):63-73.
[4] Geerts J, Van den Bosch K, Willemé P. Description et utilisation du modèle PROMES (WP 4 DC2019). Brussels: Bureau Fédéral du Plan; 2018.14 Performance of the Belgian health system: projection-based indicators KCE Report 341S
1.2. Physician workforce supply (S-19)
1.2.1. Documentation sheet
Description Projections of supply of GPs in individuals and FTEs in 2021, 2026, 2031 and 2036.
Projections of supply of all physicians in individuals and FTEs in 2021, 2026, 2031 and 2036.
Calculation Supply projections to quantify the evolution of the workforce of healthcare professionals are carried out by the Planning Commission of medical supply
supported by the Planning Unit for the Supply of the Healthcare Professions, depending on the FPS Public Health, Food Chain Safety and Environment
(hereinafter called the Planning Commission and the Planning Unit).
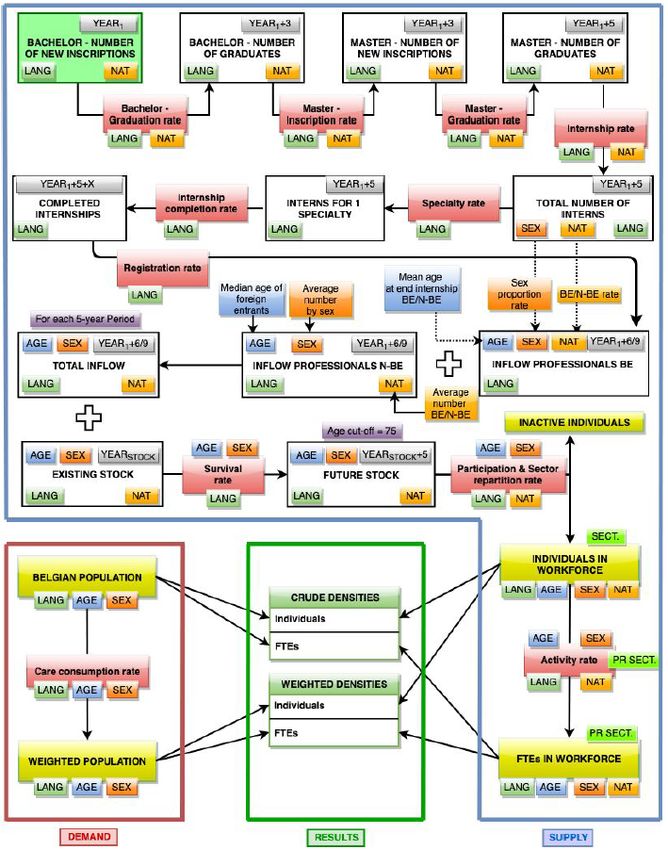
The Planning Unit uses a stock-and-flow model to quantify the evolution of healthcare professionals’ workforce. The model for physicians is illustrated by
Figure 6 where parameters are defined in Table 5. More details can be found in the report from the Planning Unit (2020).1 The number of bachelor graduates
is obtained by multiplying the number of bachelor new inscriptions (parameter #1) by the bachelor graduation rate (parameter #2). Applying the master
inscription rate (parameter #3) gives the number of master new inscriptions. Then applying the master graduation rate (parameter #4) gives the number of
master graduates. From that, the number of persons starting a training (number of interns) is obtained by applying the internship rate (parameter #5). These
calculations are made separately by linguistic community and nationality (Belgian vs non-Belgian) and are common to all medical specialists including GPs.
From there, specific calculations are made for each medical specialty. The number of persons starting each specialty training is obtained by applying the
specialty rate (parameter #6) to the number of interns. The internship completion rate (parameter #7) allows to calculate the number of completed internships
in each specialty. All these persons are supposed to be automatically registered (cadastre – kadaster) as the registration rate (parameter #8) is set equal to
1. This inflow of newly registered physicians is separated by sex and nationality (Belgian vs non-Belgian) using parameter #9. To this inflow of physicians
trained in Belgium an additional inflow of physicians trained abroad is added (parameter #10). The sum of these inflows is the total inflow of physicians who
are licensed to practice. It is calculated by age, sex, nationality and linguistic community.
The total inflow is added to the existing stock of physicians. A survival rate (parameter #11) is applied to take into account losses due to mortality. At this
step, all persons aged 75 or above are also removed in order to limit the supply forecast to those in age of working. From this future stock, only active
physicians are kept, using the participation rate (parameter #12). These are divided into four sectors (three inside the healthcare sector, one outside) using
the sector repartition rate (parameter #13). This provides us with the projected number of practising physicians (the number of individual physicians
active in the healthcare sector) that are presented below. Applying the activity rate (parameter #14) allows to calculate the number of FTEs active in the
healthcare sector that are also presented below.
One must note that the model also allows to calculate crude and weighted densities according to the evolution of the population and the application of a care
consumption rate (parameter #15). These results are not presented here but can be found in the report from the Planning Unit (2020).1
The model allows to calculate the number of individuals and FTEs in the workforce for each medical specialty separately. However, in what follows, all
physicians are aggregated together to ensure comparability with indicator S-18, for which no result per specialty was available. Projections for GPs are
presented separately.
Limitations For physicians who are active as self-employed (more than 80% of the physicians in 2016),2 the calculation of FTEs is based on the amounts reimbursed by
the sickness funds for provided care. The reference value is determined by specialty, using the observed median of the total amount paid for care provided
by the reference group. For GPs for instance one FTE corresponds to a total reimbursement amount equal to € 124 396. For surgeons, the amount isKCE Report 341S Performance of the Belgian health system: projection-based indicators 15
€ 226 520.2 This presents an important limitation, especially for medical specialists, as the amount associated with the acts is not proportional to the time
taken to perform them.3
Another important limitation comes from the aggregation of all physicians together. This aggregation may hide important differences between specialties. We
refer the interested reader to the report of the Planning Unit (2020) for more details per specialty.1
Finally, the results presented here are only based on the baseline scenarios of the Planning Commission. They aim to quantify the evolution of the medical
workforce in an unchanged policy situation. In the future, the Planning Commission will examine alternative scenarios to explore the effects of changes in
policy or other external context.
Rationale Projections of the number of physicians, both in number of individuals as well as in FTEs, are used to quantify the future workforce supply. Although the
Planning Unit model allows to take into account care consumption and to calculate crude and weighted workforce densities, these projections are not used
here because they mix both supply and demand components. Demand for healthcare workforce is projected separately (see indicator S-18).
Data source Planning Commission of medical supply supported by the Planning Unit for the Supply of the Healthcare Professions, depending on the FPS Public Health,
Food Chain Safety and Environment
Dimension Sustainability
Related S-18 – physician workforce demand (projected number of contacts with general practitioners; projected number of contacts with physicians).
indicators
A-5 – Practising physicians per 1000 inhabitants16 Performance of the Belgian health system: projection-based indicators KCE Report 341S Figure 6 – Stock-and-flow model for the projection of healthcare workforce Source: Planning Unit (2020).1
KCE Report 341S                                Performance of the Belgian health system: projection-based indicators                                                          17

Table 5 – Parameters used in the stock-and-flow projection model
 Parameter           Definition                                                                         Projection
                                         All calculations are made separately for the French and the Flemish Community
                                                                                General
 #1 Bachelor –       Number of students enrolled for the first time in a bachelor’s programme in        Average number of enrolments based on the 2 (French
 number of new       medicine (separated between Belgian and non-Belgian).                              Community) or 3 (Flemish Community) most recent academic
 inscriptions                                                                                           years for which data are available (separated between Belgian and
                                                                                                        non-Belgian).
 #2 Bachelor –       Number of bachelor diplomas obtained divided by the number of new enrolments       Average graduation rate based on the 3 most recent academic
 graduation rate     3 years earlier (separated between Belgian and non-Belgian).                       years for which data are available (separated between Belgian and
                                                                                                        non-Belgian). In the French Community, from 2020 onward, the
                                                                                                        rate is fixed at 80% for Belgian and 75% for non-Belgian students.
 #3 Master –         Number of students enrolled for the first time in a master programme in medicine   Average inscription rate based on the 3 most recent academic
 inscription rate    divided by the number of bachelor diplomas of that year (separated between         years for which data are available (separated between Belgian and
                     Belgian and non-Belgian).                                                          non-Belgian).
 #4 Master –         Number of master diplomas obtained divided by the number of new enrolments         Average graduation rate based on the 3 most recent academic
 graduation rate     3 years earlier (separated between Belgian and non-Belgian).                       years for which data are available (separated between Belgian and
                                                                                                        non-Belgian). Year 2018 counts for two years in the calculation
                                                                                                        (because in 2018, there was a double cohort of students due to the
                                                                                                        shortening of medical training from 7 to 6 years).
 #5 Internship       Number of persons who started post-graduate training (internship) divided by       The following rates are used:
 rate                the number of persons who graduate from the master programme the same              - French Community: 0.92 for Belgian graduates and 0.50 for non-
                     year.                                                                              Belgian graduates
                                                                                                        - Flemish Community: 0.95 for Belgian graduates and 0.80 for
                                                                                                        non-Belgian graduates
                                                                           For each specialty
 #6 Specialty rate   The number of persons who started the practical training for this specialty        Specialty rate for GPs is fixed at 0.42 in the French Community and
                     divided by the number of persons who started a practical training.                 0.4 in the Flemish Community. For other specialists, the average
                                                                                                        specialty rate (based on the 3 most recent academic years for
                                                                                                        which data are available) is proportionally reduced or increased
                                                                                                        accordingly.
 #7 Internship       The number of persons who successfully completed their practical training in a     Stage completion rate is fixed at 0.95.
 completion rate     given specialty (= internship) divided by the number of persons newly enrolled
                     in this training x years before, where x is the average length of the training.
18 Performance of the Belgian health system: projection-based indicators KCE Report 341S
#8 Registration The number of persons registered (cadastre – kadaster) and authorised to Registration rate is fixed at 1 (automatic registration).
rate practice as specialists (licensed-to-practice) divided by the number of persons
who have completed their post-graduate training (= internship).
#9 BE/non-BE Repartition by nationality (Belgian vs non-Belgian) of the number of persons Average distributions (based on the 5 most recent years for which
rate registered (cadastre – kadaster) and authorised to practice. data are available) in four groups (Belgian male, non-Belgian male,
Belgian female, non-Belgian female) at the start of the training x
#9 Sex Percentage of females in the persons registered (cadastre – kadaster) and
year before, where x is the average length of training.
proportion rate authorised to practice (calculated separately for Belgian and non-Belgian).
#10 Inflow Inflow of professionals who have obtained their diploma abroad (separated by Average number of professionals who have obtained their diploma
professionals N- nationality and sex). abroad in four groups (Belgian male, non-Belgian male, Belgian
BE female, non-Belgian female) based on the 3 most recent years for
which data are available.
#11 Survival rate Survival rate based on mortality tables by age and sex. In addition, all persons Survival rates of 2015-2017.
aged 75 or above are removed.
#12 Participation Repartition between professionals who are (1) active in Belgium, (2) not active Participation rates of 2016.
rate in Belgium but living in Belgium, and (3) not active and living abroad (calculated
by age, sex and nationality).
#13 Sector Repartition of active professionals between (1) active in the healthcare sector as Sector repartition rates of 2016.
repartition rate self-employed (minimum activity threshold of 5% of the median income of the
group of physicians aged 45–54 years old, defined per specialty), (2) active in
the healthcare sector with a mixed status (self-employed and salaried), (3) active
in the healthcare sector as salaried worker (at least 0.1 FTE), and (4) active
outside the healthcare sector (calculated by age, sex and nationality). The first
three groups are called practising physicians.
#14 Activity rate Activity rate calculated by age, gender, nationality and sector (only for the first Activity rates of 2016.
three sectors, i.e. only for practising physicians). For salaried workers, the rate
of activity takes into account activities for all employers of the healthcare sector.
For self-employed physicians, the activity rate is calculated using the amounts
paid by the sickness funds for performed acts. A reference full time equivalent is
determined by specialty, using the observed median of the total amount
reimbursed for care provided by the reference group.
#15 Care Consumption rate based on reimbursed fees for physician care observed over Demographic forecasts from the Federal Planning Bureau
consumption three years (2015, 2016 and 2017) in the context of the compulsory health multiplied by the observed consumption rate in 2015, 2016 and
rate insurance (calculated by age and sex of the patient). 2017 by age and sex of the patient. The consumption rate is
therefore supposed constant in each segment of the population,
only the composition of the population changes.
Source: Planning Unit (2020).1KCE Report 341S Performance of the Belgian health system: projection-based indicators 19
1.2.2. Results the Flemish Community). These numbers are expected to decrease in 2021
and 2026 before increasing in 2031 and 2036.
General practitioners Overall, in the French Community, the model predicts that the GP workforce
In 2016, there were 12 099 practising general practitioners (i.e. active in the will slightly increase between 2016 and 2036 (from 5 192 to 5 489, i.e. an
healthcare sector) in Belgium (5 192 in the French Community and 6 907 in increase of 297 individuals). This increase in the number of active individuals
the Flemish Community). This number is expected to increase to 12 525 in in the GP workforce (+5.7%) does not translate into an increase in the
2021,12 844 in 2026, 13 269 in 2031 and 13 999 in 2036, which number of FTEs for which a drop of 5.7% is expected between 2016 and
corresponds to five-year increases of respectively 3.5%, 2.6%, 3.3% and 2036.
5.5%. On Figure 7, the (projected) number of practising general practitioners In the Flemish Community, the expected increase of the number of GPs is
in Belgium is depicted by a line for Belgium (left panel) and both linguistic higher: from 6 907 to 8 510 between 2016 and 2036, which is an increase
communities (right panel). On the same figure, the bars indicate the number of 1 603 individuals. This important increase (+23.2%) only partially
of FTEs. In 2016, the equivalent of 11 977 FTEs were active as GPs in the translates into an increase in the number of FTEs (+8.5%).
healthcare sector in Belgium (4 284 in the French Community and 7 693 in
Figure 7 – Number of GPs active in the healthcare sector, in individuals and FTEs, in Belgium and its linguistic communities, 2016-2036
Source: Planning Unit.20 Performance of the Belgian health system: projection-based indicators KCE Report 341S Figure 8 depicts five-year growth rates for the number of practising general medicine (in the French Community, this share was 23.1% in 2011, rising to practitioners and their full time equivalents. The number of individuals in the 32.2% in 2015 and 41.9% in 20191; in the projections, this share is set at GP workforce is expected to increase in Belgium during the entire period 42%, see parameter #6). Regarding FTEs, a drop is expected in both 2016-2036. However, this is mainly due to a large increase in the Flemish linguistic communities between 2016 and 2021 and between 2021 and Community. The increase in the French Community is expected to be much 2026. Then, the number of GP FTEs is expected to increase by 3% between smaller and a decrease is even expected between 2026 and 2031, despite 2026 and 2031 (with still a slight decrease in the French Community) and by the large increase of the share of interns choosing to specialise in general 7.8% between 2031 and 2036 (see also Table 6). Figure 8 – Evolution in the workforce of GPs (in individuals and FTEs) between 2016 and 2036 in Belgium and its linguistic communities Source: Planning Unit.
KCE Report 341S                             Performance of the Belgian health system: projection-based indicators                                            21

All physicians                                                                     of 7 800 individuals or +43.2%). This increase in the number of active
                                                                                   individuals (partially) translates into an increase in the number of FTEs
In 2016, there were 33 891 physicians active in the healthcare sector in
                                                                                   (+26.9%). In the French Community the number of physicians is expected
Belgium (15 841 in the French Community and 18 050 in the Flemish
                                                                                   to increase only by 17.8% between 2016 and 2036 (from 15 841 to 18 656)
Community), corresponding to 35 067 FTEs in Belgium (14 209 in the
                                                                                   while the number of FTEs will stay relatively stable (from 14 209 to 14 502
French Community and 20 859 in the Flemish Community) (see Figure 9).
                                                                                   i.e. an increase of 2.1%).
The number of physicians is expected to increase to 36 357 in 2021, 39 440
in 2026, 41 799 in 2031 and 44 505 in 2036, which corresponds to five-year         One must keep in mind that these numbers hide an important variability
increases of respectively 7.3%, 8.5%, 6.0% and 6.5%.                               between specialities. Detailed results by specialty can be found in the report
                                                                                   from the Planning Unit (2020).1
In the Flemish Community, the number of physicians is projected to strongly
increase between 2016 and 2036 (from 18 050 to 25 850, i.e. an increase

Figure 9 – Number of physicians active in the healthcare sector, in individuals and FTEs, in Belgium and its linguistic communities, 2016-2036

Source: Planning Unit.
22 Performance of the Belgian health system: projection-based indicators KCE Report 341S Five-year growth rates for the number of individuals and FTEs in the especially for the periods 2026-2031 and 2031-2036. Regarding FTEs, an physician workforce are shown on Figure 10 and Table 6. The number of increase is expected in the Flemish Community during the entire considered physicians is expected to increase in Belgium during the entire period 2016- period. In the French Community however, a drop is expected for the period 2036, mainly driven by a large increase in the Flemish Community. The 2016-2021, followed by small increases. increase in the French Community is expected to be much smaller, Figure 10 – Evolution in the physician workforce (in individuals and FTEs) between 2016 and 2036 in Belgium and its linguistic communities Source: Planning Unit.
KCE Report 341S                            Performance of the Belgian health system: projection-based indicators                                       23

Table 6 – Projected five year evolution of physician workforce
                                   GPs                                    Physicians

                     Individuals          FTEs              Individuals                FTEs
 2016-2021               3.52%            -4.08%              7.28%                -0.09%
 2021-2026               2.55%            -2.95%              8.48%                    3.92%
 2026-2031               3.31%            3.04%               5.98%                    5.26%

 2031-2036               5.50%            7.83%               6.47%                    6.91%
Source: Planning Unit.

References
[1]     Cellule Planification des professions de soins de santé, Service Professions des soins de santé et pratique professionnelle. Scénario de base de
        l’évolution de la force de travail Médecins 2016-2036. Bruxelles: DG Soins de santé, SPF Santé publique, Sécurité de la chaîne alimentaire et
        Environnement; 2020.
[2]     Cellule Planification des professions de soins de santé, Service Professions des soins de santé et pratique professionnelle. PlanCad Médecins 2004-
        2016. Bruxelles: DG Soins de santé, SPF Santé publique, Sécurité de la chaîne alimentaire et Environnement; 2019.
[3]     Benahmed N, Hendrickx E, Adriaenssens J, Stordeur S. Health workforce planning and midwifery-specific data. Health Services Research (HSR).
        Brussels: Belgian Health Care Knowledge Centre (KCE); 2016 12/2016. KCE Reports 278
24 Performance of the Belgian health system: projection-based indicators KCE Report 341S
1.3. Public expenditure on health (S-20)
1.3.1. Documentation sheet
Description Principal indicator: Public expenditure on health (acute and long-term care) as % of Gross Domestic Product (GDP)
Secondary indicators: Public expenditure on acute care as % of Gross Domestic Product (GDP)
Public expenditure on long-term care as % of Gross Domestic Product (GDP)
Calculation The Study Committee on Ageing (Comité d’Étude sur le Vieillissement, CEV – Studiecommissie voor de Vergrijzing, SCvV) makes long-term projections of
social expenditure (retirement, healthcare, work incapacity, unemployment, child care allowances, and other social expenditure), up to 2070. In what follows
we focus on projections for healthcare expenditure, i.e. public expenditure on health with a distinction between acute and long-term care. These long-term
projections are based on four types of assumptions: demographic, socio-economic, macroeconomic and social policy assumptions that are summarised in
table 2 of the Study Committee on Ageing 2020 annual report.1 In particular, the average growth rate of labour productivity is assumed to be 0.3% per year
during the period 2020-2025, then 1.2% per year until 2045 and 1.5% per year from 2045 onwards. An alternative scenario is also calculated, with a reduced
growth rate of labour productivity in the long term: 0.9% per year during the period 2025-2030, and 1.0% per year from 2031 onwards.
The long-term projections published in 2020 integrate the 2019-2070 demographic outlook (updated in the context of the COVID-19 pandemic) established
in June 2020, the 2020-2025 economic outlook published in June 2020 and all measures related to social expenditure already promulgated. Regarding
healthcare expenditure, the measures taken by the government and RIZIV – INAMI to ensure that the evolution of the budget for compulsory health insurance
does not exceed the real growth norm (1.5% in 2019) are included in the observed data. However, in the projections, the evolution of healthcare expenditure
results from specific models and does not take into account the real growth norm.
Results are presented at the Belgian level as well as separately according to the level of power: on the one hand the federal state including social security
organisations and on the other hand the federated entities (regions and communities) and local authorities (provinces and municipalities). Since 2015 and
the 6th state reform, some competencies, notably those related to long-term care, have been transferred from the federal state to the federated entities.
Regarding projections for healthcare expenditure in particular, it is likely that acute and long-term care are not influenced by the same determinants and not
influenced in the same way by common determinants. Therefore these two types of care are modelled separately.2
Acute care expenditure includes acute care services covered by the compulsory health insurance (fees for GPs and medical specialists, drugs,
hospitalisations, implants, physiotherapy, etc.), hospital funding and other social benefits (such as some care to disabled persons) closely related to acute
care. Expenditure is expressed in real terms per capita (deflated by the GDP deflator), as a function of the following explanatory variables:
- real GDP per capita (also deflated by the GDP deflator);
- demographic ageing, measured as the share of age groups 65-74, 75-84 and 85+ in the total population;
- the unemployment rate;
- a dummy variable which captures the impact of the extension of health insurance for self-employed workers from 2008 onward;
- two indicators on the evolution of medical technology.
The acute care expenditure model is specified as a log-linear model and estimated on the basis of data for the period 1980-2019.
Long-term care expenditure includes nursing care at home, stays of persons in residential care facilities for older people and in mental healthcare facilities,
some other expenditure for assistance with the daily living of dependent elderly persons as well as additional insurance for non-medical care (Vlaamse
Zorgkas) in Flanders. Expenditure is expressed in real terms per capita (deflated by the GDP deflator) as a function of the following explanatory variables:
- real GDP per capita (also deflated by the GDP deflator);KCE Report 341S Performance of the Belgian health system: projection-based indicators 25
- demographic ageing, measured as the share of age groups 65-74, 75-84 and 85+ in the total population;
- the life expectancy of these population groups.
The long-term care expenditure model is specified as a linear model and estimated with data for the period 1980-2019.
Limitation Results from the Study Committee on Ageing results must be interpreted as long-term projections. They do not intend to give the best possible estimate of
the near future. Projections on a more distant horizon take into account trends observed in the past but are inevitably based on assumptions. In particular,
the projections of the Study Committee on Ageing are anchored to the Planning Bureau medium-term projections by applying annual growth rates to the
endpoint of these projections (2025). Given the degree of uncertainty of some hypotheses, analyses of sensitivity of the results to certain key parameters are
needed. Rather than presenting exact figures for the future, projections constitute a decision-making aid tool and allow to frame the policy debate.
Although the 2020 projections of the Study Committee on Ageing integrate some effects of the COVID-19 crisis (such as a drop in GDP, an increase in
unemployment as well the implementation of temporary measures), due to the many uncertainties regarding the evolution of the epidemic and its
consequences, the potential impact of the COVID-19 pandemic is uncertain and can only partially be accounted for. In particular, the direct effect of COVID-19
on the amount publicly spent for healthcare is yet unknown.
Also, the distinction between acute and long-term care expenditure is not straightforward. Some expenditure on long-term care cannot be identified in the
data as they are included in larger components of acute care (for instance, physiotherapist fees are always accounted for as acute care even if they concern
long-term care).
Rationale Population ageing and technological progress are expected to add pressures on public expenditure on health in the coming decades.3 At the same time, the
relative size of the working-age population that contributes to finance such expenditure is expected to decrease, raising concerns about the fiscal sustainability
of health and long-term care systems.4 These long-term projections can help policy makers to consider the possible evolution of public expenditure and the
impact of the main underlying drivers of healthcare costs.5
Measuring public expenditure on health as a proportion of GDP combines both economic and fiscal sustainability. The higher the indicator, the more pressure
is put on the system, either because the health sector is taking a larger share in the overall economy, or because it is increasingly financed by the public
sector, or both.
Data source Study Committee on Ageing (High Council of Finance, Federal Planning Bureau)6
The Committee is established within the High Council of Finance. The Federal Planning Bureau is responsible for the committee’s technical and administrative
secretariat.
Dimension Sustainability
Related Current expenditure on health as % of Gross Domestic Product (GDP) (S-1)
indicators Current expenditure on health in € per capita (S-2)
Current expenditure on health as % financed by government/compulsory schemes (S-3)
International Every three years, the Aging Working Group (AWG) of the Economic Policy Committee (EPC) of the Economic and Financial Affairs (ECOFIN) Council makes
comparability long-term projections of social expenditure for the 28 EU member states as well as Norway, published in the "Ageing Report". The 2018 Ageing Report
integrates reforms decided up to May 2017. Nevertheless, these projections are not directly comparable to the projections from the Study Committee on
Ageing because different projection models and data are used and because different assumptions are made (for more details see the Study Committee on
Ageing 2018 annual report7). In addition, the most recent data available do not include the potential impact of the 2020 COVID-19 crisis. Due to that,
comparison of projections for Belgium and the EU are made using projections from AWG rather than projections from the Study Committee on Ageing. For
completeness a comparison between both sources is made, using pre-COVID data from the Study Committee on Ageing.26 Performance of the Belgian health system: projection-based indicators KCE Report 341S
1.3.2. Results
Belgium International comparison
In 2019, public expenditure on health amounted to 37.2 billion € in Belgium. The international comparison is based on projections from the Aging
This represents 7.9% of the Belgian Gross Domestic Product (GDP). The Working Group (AWG) of the Economic Policy Committee (EPC) of the
major part of this expenditure (30.3 billion €, 6.4% of the GDP) is related to Economic and Financial Affairs (ECOFIN) Council that are not directly
acute care, compared to 6.8 billion € (1.4% of the GDP) to long-term care comparable to the projections of the Study Committee on Ageing, although
(Table 7, Figure 11). they show a similar pattern (Figure 13). They were made before the COVID-
19 crisis and therefore do not account for the impact of the pandemic.
Public expenditure for acute care is mainly the responsibility of the federal
state (5.7% of GDP compared to 0.7% for federated entities and local In 2016, public expenditure on health in Belgium, as a percentage of the
authorities) while the opposite is true for long-term care (0.3% of GDP for GDP, is very close to the EU-28 average. They are projected to follow a
the federal state compared to 1.1% for federated entities and local similar trend in the short and long term (Figure 14). Nevertheless, public
authorities) (Table 7, Figure 12). expenditure on long-term care (as a share of GDP) in Belgium is above the
EU-28 average, compensated by lower public expenditure on acute care
In the future, public expenditure (as a share of GDP) is foreseen to increase, than the EU-28 average. These differences are expected to be slightly
up to 10.0% in 2040, mainly due to an increase in long-term care expenditure exacerbated in the future (Figure 15).
(from 1.4% of GDP in 2019 to 2.3% of GDP in 2040, i.e. an increase of 64%).
Public expenditure for acute care (in percent of GDP) is foreseen to increase
by 22% between 2019 and 2040 (from 6.4% to 7.8% of the GDP) (Table 7,
Figure 11).
According to the current division of competencies, the increase in public
expenditure for acute care will be mainly supported by the federal state while
the increase in public expenditure for long-term care will be supported by
federated entities and local authorities (Table 7, Figure 12).
Under an alternative scenario with reduced productivity growth, public
expenditure on health is expected to increase more, from 7.9% of the GDP
in 2019 to 10.9% in 2070 (compared to 10.4% in the reference scenario),
partly due to a higher increase in public expenditure on acute care (from
6.4% of the GDP in 2019 to 8.3% in 2070 compared to 8.1% in the reference
scenario) (Table 8).You can also read