AUTOMATED SEMANTIC SWOT ANALYSIS FOR CITY PLANNING TARGETS
←
→
Page content transcription
If your browser does not render page correctly, please read the page content below
AUTOMATED SEMANTIC SWOT ANALYSIS FOR CITY PLANNING
TARGETS

Data-driven solar energy potential evaluations for building plots in Singapore

               AYDA GRISIUTE1, ZHONGMING SHI2, ARKADIUSZ
               CHADZYNSKI3, HEIDI SILVENNOINEN4, AUREL VON RICHT-
               HOFEN5 and PIETER HERTHOGS6
               1,2,4,5,6
                         Singapore-ETH Centre, Future Cities Lab Global Programme,
               CREATE campus, 1 CREATE Way, #06-01 CREATE Tower, Singapore
               138602.
               3
                 CARES, Cambridge Centre for Advanced Research and Education in
               Singapore, Singapore.
               5
                 Arup, Berlin, Germany.
               1
                ayda.grisiute@sec.ethz.ch, 0000-0001-7328-847X
               2,6
                  {shi, herthogs}@arch.ethz.ch, 0000-0002-3744-1649, 0000-0003-
               2562-8374
               3
                arkadiusz.chadzynski@cares.cam.ac.uk, 0000-0001-8084-9474
               4
                heidi.silvennoinen@sec.ethz.ch
               5
                Aurel.von-Richthofen@arup.com, 0000-0002-8712-1301

               Abstract. Singapore’s urban planning and management is cross-
               domain in nature and need to be assessed using multi-domain indicators
               — such as SDGs. However, urban planning processes are often
               confronted with data interoperability issues. In this paper, we
               demonstrate how a Semantic Web Technology-based approach
               combined with a SWOT analysis framework can be used to develop an
               architecture for automated multi-domain evaluations of SDG-related
               planning targets. This paper describes an automated process of storing
               heterogeneous data in a semantic data store, deriving planning metrics
               and integrating a SWOT framework for the multi-domain evaluation of
               on-site solar energy potential across plots in Singapore. Our goal is to
               form the basis for a more comprehensive planning support tool that is
               based on a reciprocal relationship between innovations in SWT and a
               versatile SWOT framework. The presented approach has many
               potential applications beyond the presented energy potential evaluation.

               Keywords. Semantic Web; Knowledge Graphs; SWOT Analysis;
               Energy-driven Urban Design; SDG 7; SDG 11.

1. Introduction
In Singapore, urban planning and management are done by multiple government

POST-CARBON, Proceedings of the 27th International Conference of the Association for Computer-
Aided Architectural Design Research in Asia (CAADRIA) 2022, Volume 1, 555-564. © 2022 and
published by the Association for Computer-Aided Architectural Design Research in Asia (CAADRIA),
Hong Kong.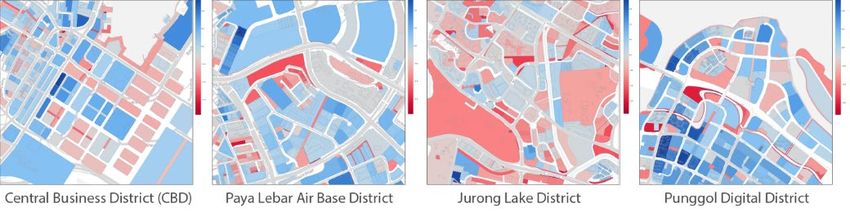
556                              A. GRISIUTE ET AL.

agencies, implying that it is cross-domain in nature. This nature impacts how we
measure, evaluate and understand the challenges the city is facing, such as climate
change, the liveability of cities, or urban energy demand (Richthofen, 2022).
Sustainable Development Goals (SDGs) is an effort to address these challenges and
can support planners in comparing, monitoring and measuring the progress of planning
strategies through the evaluation of diverse indicators (Massaro et al., 2020). However,
such actions require the integration of heterogeneous data and flexible frameworks that
enable a comprehensive evaluation of diverse SDG-related planning metrics. While
relevant data have been made available through active digitalisation and improved
storage capacities (Winkelhake, 2018), existing urban data formats and modelling
techniques — such as GIS — remain relatively static and siloed. They lack
standardised exchange formats, making it difficult to cross-reference, analyse or track
changes (Chadzynski et al., 2021) and impede the integration of (big) data in planning
tasks. Therefore, sustainable digitisation and innovation in city planning and
knowledge management are essential for achieving SDGs (Massaro et al., 2020).
    There is a need for more holistic analyses relating to SDGs that enable the
evaluation of cross-domain urban indicators and metrics. Semantic Web Technologies
(SWT) is a promising approach to address data fragmentation and improve
interoperability by linking data and making it more connected and discoverable
through Knowledge Graph (KG) platforms (Chadzynski et al., 2021). In addition,
SWOT analysis framework (Strengths, Weaknesses, Opportunities and Threats) has
proven to be a versatile and effective tool for strategic urban planning and the
evaluation of cross-domain metrics for particular planning targets.
    In this paper, we introduce an approach to automate the evaluation of multi-domain
targets of city planning using KG, enabling flexible interaction with heterogeneous data
and addressing interoperability issues hindering core aspects of sustainable
digitalisation in city planning. We present the first steps towards a more comprehensive
decision support tool, integrating a dynamic geospatial KG platform with the SWOT
framework, resulting in automated multi-domain evaluations of SDG-related planning
targets. The remainder of the paper is structured as follows. Section 2 presents the
broader research scope and background, how SWOT framework and SWTs address
the need for holistic urban analysis, and our use case — a SWOT analysis assessing
on-site solar energy potential of plots across Singapore. Section 3 describes our
methods for storing heterogeneous data in a KG, deriving planning metrics, and
integrating it into the SWOT analysis. Section 4 presents the SWOT analysis results
and potential benefits for planners, while Section 5 discusses the main contributions of
SWOT and SWT integration, discovered limitations and future work.

2. Background

2.1. CITIES KNOWLEDGE GRAPH
Our work was done as a part of the Cities Knowledge Graph (CKG) research project –
an example of a Semantic City Planning System (Richthofen et al., 2022). CKG is a
pilot for a comprehensive knowledge management platform that applies SWT and KGs
to address interoperability challenges between different urban knowledge domains in
order to digitally support the synthesis actions at the core of city planning (e.g. building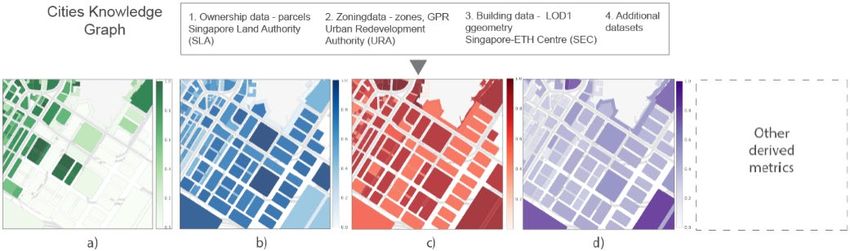
AUTOMATED SEMANTIC SWOT ANALYSIS FOR CITY                                   557
                      PLANNING TARGETS

consensus among stakeholders), hence addressing SDG 11 — Sustainable Cities and
Communities — targets.
    The CKG uses SWT to store data on the Web, link it using ontologies, and write
rules for handling data across applications. Ontologies account for shared formal
vocabularies of domain concepts, instances, and relations (Akroyd et al., 2021) and
enable computers to infer semantic relationships between heterogeneous data. KGs
express data as a directed graph with concepts or instances as nodes and relations as
edges, and can be used to formalise domain knowledge, such as urban energy, mobility
or planning (Shi, et al., 2021), into semantic models. Finally, KGs hosted in graph
databases, often referred to as triple stores with query endpoints, enable exploration
and interaction with such semantic models by executing SPARQL query statements
(W3C, 2013).
    The CKG is a subsystem of a broader collaborative research effort to develop a
general, all-encompassing and dynamic knowledge graph called The World Avatar
(TWA) — TWA consists of multi-domain knowledge representation and an ecosystem
of autonomous computational agents operating on it (Akroyd et al., 2021). The agents
can support planning tasks by dynamically reconfiguring the KG architecture and
importing, exporting, updating and analysing urban data.

2.2. SWOT ANALYSIS FRAMEWORK
A SWOT analysis is a cognitive process defining and evaluating the interrelations
between different factors of an entity or phenomenon across four categorical
descriptors: Strengths, Weaknesses, Opportunities, and Threats (Learned et al., 1965).
Ghazinoory et al. (2011) associate Strengths and Weaknesses with internal factors —
variables that are a part of the entity, and Opportunities and Threats with external
factors — variables that are external but can still influence the entity. In the context of
future-oriented tasks such as planning, we also consider the temporal dimension in
SWOT where SW represent present conditions and OT future ones.
     Although originally used in the business field, this framework has recently been
rigorously applied in quantitative indicator-based evaluations in the planning domain
(Comino & Ferretti, 2016; Ervural et al., 2018; White et al., 2015). In these examples,
indicators are categorised into four descriptors based on stakeholder workshops or
literature reviews and prioritised using hierarchical weighting methods by domain
experts. Additionally, the SWOT framework is also suited for geospatial analyses.
Camino and Ferretti (2016) integrated GIS in their indicator-based SWOT analysis for
parks to create thematic maps visualising the distribution and extent of vulnerable,
threatened or valuable park areas, informing regional park management strategies for
optimal environment preservation.

2.3. USE CASE — ON-SITE SOLAR ENERGY POTENTIAL
In this paper, we combine the SWOT framework with our CKG to automatically
analyse the on-site solar potential of building plots. As cities are one of the main energy
consumers worldwide, such an analysis responds to the need to consider clean energy
systems already during the master-planning stages and is an established planning target
(Shi et al., 2017) for addressing SDG 7 — Affordable and Clean Energy.
558 A. GRISIUTE ET AL.
An evaluation of a plot’s solar energy potential is a transdisciplinary effort and
involves a variety of cross-domain metrics and factors, covering building typology,
land use, urban form, cooling demand and energy integration costs resulting in a variety
of methods (Shi et al., 2021). Using methods that only evaluate individual metrics is
not enough to assess solar energy potential due to interaction effects between features
like site coverage, land-use ratio and orientation (Shi et al., 2021) and accounting for
these interactions is difficult. In comparison, our approach expresses these interactions
through linked data.
Figure 1 shows four chosen Key Growth Areas in Singapore, that aims to showcase integrated
master-planning would benefit from solar energy potential considerations at early planning phases.
This paper builds on previous work (Grisiute et al., 2021), presenting an improved
version of that automated SWOT analysis (improved metrics and score aggregation),
now applied to diverse regions in Singapore. Singapore’s 2019 master plan identifies
several regions as Key Growth Areas (URA, 2021), with the aim to showcase how
integrated master planning and technology could help create more liveable and
sustainable cities in line with SDGs, including the integration of clean energy. Solar
energy is the most feasible renewable energy source in Singapore, and will hence
require the installation of more photovoltaic panels (Energy Market Authority, 2017).
In order to do so, solar energy potential studies at early planning and urban design
stages in these regions could prove to be very beneficial. As an experimental use case,
we tested our SWT-based SWOT analysis in four of Singapore’s Key Growth Areas:
Punggol Digital District, Central Business District, Paya Lebar Air Base District and
Jurong Lake District (Figure 1).
3. Methodology
3.1. STORING DATA IN THE CKG
We used open datasets from Singaporean government agencies (Data.gov.sg, 2021)
and other planning-related datasets covering plot form, built form and land-use
characteristics. First, we transformed these heterogeneous data to CityGML format
with the Feature Manipulation Engine (FME). Second, we used our current CKG
architecture — described by Chadzynski et al. (2021) — to transform flat geospatialAUTOMATED SEMANTIC SWOT ANALYSIS FOR CITY 559
PLANNING TARGETS
Figure 2 shows relevant metrics derived from datasets stored in the KG. Thematic gradient maps
visualise each metric’s value from highest (dark) to lowest (light): a) site coverage indicates to what
extent the plot is covered by roof surface, which in Singapore is the most efficient for PV installation;
b) elongation as measure for compactness that allows for efficient deployment of PV infrastructure;
c) shading factor indicates how much buildings on plot are taller than its surroundings, which has
direct effect on inter-intra shading; d) orientation metric indicates how much each plot deviates from
recommended orientation for façade PV.
CityGML files into semantic triples and store them in the CKG. This graph database
was structured using an ontology of the CityGML 2.0 standard called OntoCityGML
(Chadzynski et al., 2021). Finally, the geospatial processing capabilities of the
Blazegraph graph database instance used as the triple store enabled us to perform
geospatial queries (Blazegraph, 2020).
3.2. DERIVED METRICS
Our SWOT analysis required metrics that measure particular characteristics of on-site
solar energy potential as inputs. We derived these by executing manifold combinations
of SPARQL queries against the CKG to retrieve each dataset’s geospatial information
(polygon geometries) and semantic information (zoning type, Gross Plot Ratio (GPR),
building height). We linked the semantic information across datasets by comparing
topological relations between the retrieved geometries. We then derived composite
metrics that have a varying impact on on-site solar energy potential (Shi et al., 2021),
like site coverage, land-use ratio, inter-intra shading factor and retrieved other relevant
metrics, such as plot area, elongation and orientation, directly from the geometries
(Figure 2).
3.3. SWOT ANALYSIS FRAMEWORK INTEGRATION
We included five of these metrics — site coverage, land-use ratio, plot orientation,
elongation and shading factor — in our proof of concept evaluation of the solar energy
potential of large numbers of building plots. As site coverage, plot orientation and
elongation define the entity and are considered internal factors, their values were
categorised as Strengths or Weaknesses (see also Section 2.2). Meanwhile, land-use
ratio and shading factor values were linked to Opportunities and Threats, as these
metrics define external context, but can still influence the plot. Refer to the cited papers
for details on how each metric is defined.
● Site coverage | Extent to which the plot area is covered by roof surface, which is the
most efficient location for PV installation in Singapore. Thus a high site coverage560 A. GRISIUTE ET AL.
scores higher as it tends to increase roof PV possibilities (Shi et al., 2021).
● Land-use ratio | The average of the deviations from a recommended ratio of
commercial and residential land uses of 30 to 70% respectively within the city block
(Shi et al., 2021). Plots that are in city blocks with less deviation from the
recommendation score higher.
● Plot orientation | The deviation from preferable east-west orientation for efficient
facade PV installation (Shi et al., 2021). It is modulated by the plot area as an
orientation has a stronger impact on plots with a small area, limiting design
possibilities. Plots with lower deviation score higher.
● Plot elongation | Is expressed as the ratio between two circle diameters related to the
plot: diameter of a circle with the same area as the plot and the diameter of the
smallest bounding circle (Shi et al., 2020). Elongation is again modulated by the plot
area (for the same reason as above). Smaller elongation tends to increase
compactness allowing for efficient deployment of PV infrastructure.
● Shading factor | The difference between plot building height and average building
height within a given radius. Plots with tall buildings have larger facade areas for
PV installation and less risk for inter-intra shading (Shi et al., 2021) and thus score
higher.
For the proof of concept, we normalised individual metric scores to a [0-1] range
so metrics can be combined easily, with each metric contributing equally to the
combined assessment. In reality, the importance or weight of different metrics varies;
determining these variations is an operations research task that falls outside the scope
of this paper. The metric scores were normalised between 0.0 and 1.0, where 1.0
represents the maximum value in the dataset and 0.0 is the minimum value. By default,
we assigned normalised individual metric scores lower than 0.5 to W or T and scores
higher than 0.5 to S or O. In this way, each metric was assigned to the SWOT categories
for each plot. We computed a single S W O and T value per plot by aggregating results.
Finally, analysis results were visualised in thematic gradient maps (Figure 3),
presenting the geospatial distribution of the overall SWOT score, which is the
difference between aggregated SO and WT, implying that in a positive overall score
SO outweigh WT, and vice versa for a negative total score.
Figure 3 shows the geospatial distribution of overall SWOT analysis score across four chosen
regions. Overall SWOT score is the difference between aggregated SO and WT. If positive, SO
outweigh WT and are coloured in blue shades and, if negative, WT outweigh SO and are coloured in
red shades. These maps show that our automated SWOT framework is consistent across cases with
different topological features, development phases and information coverage.AUTOMATED SEMANTIC SWOT ANALYSIS FOR CITY 561
PLANNING TARGETS
4. Results
We applied our automated SWOT analysis to every plot in the aforementioned four
Key Growth Areas in Singapore. The spatial distribution of overall SWOT scores in
gradient maps (Figure 3) was instrumentally used to explore the solar energy potential
of different plots. For example, parks, public spaces and small vacant plots scored
lower across all locations due to the interaction between low site coverage and
unsuitable land-use ratio that results in limited PV installation possibilities. Plots with
east-west orientation and close to parks or public spaces scored higher due to
interaction between desirable orientation, site coverage and shading effects.
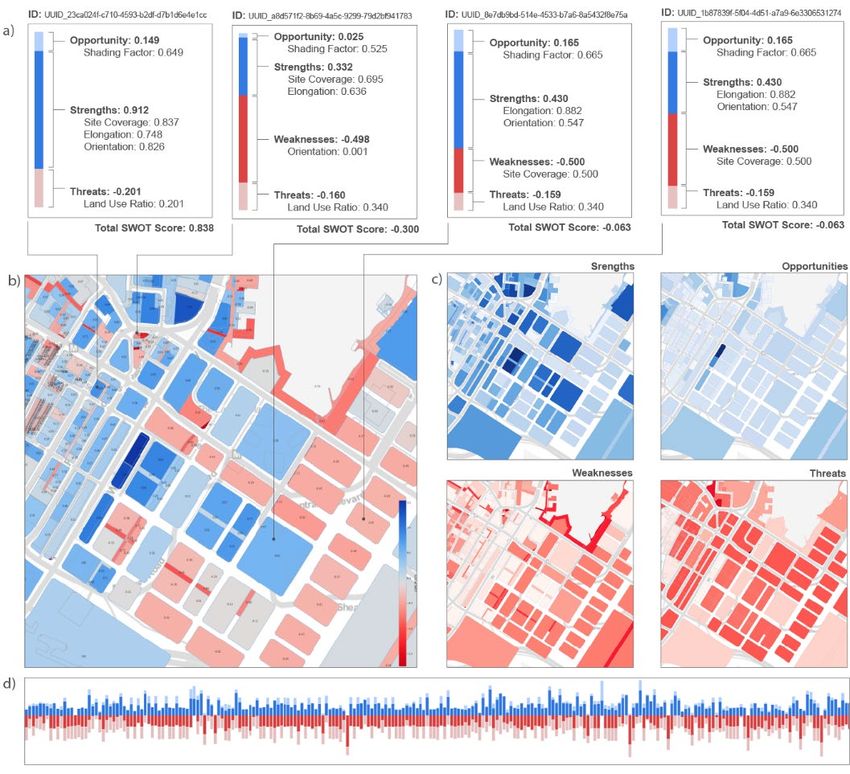
To explore the relative contributions of each descriptor and individual metrics to
the total score, we further investigated one region — Central Business District (CBD)
(Figure 4b). From the thematic maps of four descriptors (Figure 4c) and a selected
Figure 4 shows one of the four regions SWOT analysis results: a) presents the score composition of
four example plots; b) visualises the distribution of total SWOT analysis results; c) maps visualise
the distributions of separate descriptors. Concentrations of S and O primarily consist of developed
plots with high-rise buildings, while W and T cluster in areas that are not yet developed; d) displays
a bar chart with SWOT results for all plots, showing that most plots balance negative and positive
factors and that only very few plots are highly suitable or highly unsuitable for PV installation.562 A. GRISIUTE ET AL.
sample of plots (Figure 4a), we see that the interaction between orientation and
elongation metrics (driven by a non-uniform grid urban structure) were main
contributors to Strengths and Weaknesses determining varying plot performance. Plots
that border water bodies or are used as pedestrian passages scored particularly low due
to high elongation. The absence of buildings in this developing area had two
implications: site coverage additionally contributed to the plot’s Weaknesses, while
shading factor contributed to Opportunities of those plots that are already built up. The
majority of the plots have commercial land-use types which usually have higher energy
use intensity, resulting in low land-use ratio scores and contributing to Threats. Finally,
in our results, the majority of plots featured a balance between negative and positive
factors, resulting in moderate solar energy potential and only very few plots were
highly suitable or highly unsuitable for PV installation (Figure 4d) - at least in this
unweighted multi-criteria assessment.
5. Discussion and Future Work
This paper presented a novel approach that integrates SWT, spatial analysis based on
derived metrics, and a SWOT framework in order to support decision making in city
planning. The benefits of this integration have been demonstrated through an
experimental use case that shows how this method could be used to inform planners in
SDG-related planning tasks. We emphasise that the main aim of this paper is to
introduce a proof-of-concept of our automation approach, thus the type of evaluation
and the specific scores resulting from our evaluation should be considered illustrative
examples to demonstrate our KG-based automated SWOT analysis. The presented
results demonstrate two main innovations of our approach.
First, planners could use generated maps to indicate potential plots for PV
installations at the early master-planning level. The consistency of generated maps in
Figure 3 shows that the automated SWOT framework can work across areas with
varying topological features, information coverage or development stages. Thus,
planners can apply this framework to a variety of sites and cases and even use it for the
evaluation of on-site solar potential over time, as the features of an area change.
Second, the innovative value of the automated proof-of-concept approach stems
from the ability to effectively combine heterogeneous linked data (derived metrics)
with multidisciplinary expert knowledge (criteria evaluation and classification) into a
single intuitive model (SWOT) — an ability that has been officially acknowledged as
being inherently necessary for the successful implementation of SDGs (Massaro et al.
2020). The reciprocal relationship between metrics and automated evaluation opens
new possibilities for SWOT analysis applications and provides a well-known interface
(at least for urban planners) to interact with large semantic data stores, supporting
decision-making. For instance, evaluating land use (e.g. mixed-use) developments in
an automated way with more granulated linked data could facilitate and even augment
land use classification tasks (Shi et al., 2021). Moreover, the malleable KG data
architecture is designed for data to be updated, expanded or created with relative ease;
such data architecture supports planning scenario generation and exploration, enabling
the simulation of parallel worlds (Eibeck et al., 2020). We demonstrated that SWT and
KGs enable planners to analyse cities through multi-domain indicators, as derived
metrics used in the SWOT analysis would be challenging to develop based onAUTOMATED SEMANTIC SWOT ANALYSIS FOR CITY 563
PLANNING TARGETS
individual datasets.
Despite the presented strengths, the work also has limitations. As the main aim of
this specific SWOT analysis of solar energy potential is to illustrate our automation
approach, the evaluation could be made more robust. The presented SWOT is limited
by the choice of metrics, their uniform weighting, and different levels of granularity,
and should therefore be considered a rough gauge for on-site solar energy potential
assessment, primarily suitable for early-stage planning considerations. For instance, the
low granularity of open zoning data poses challenges for computing an accurate land-
use ratio. To make evaluation results more robust and informative, uniform metric
weighting should be replaced by collaboratively determined and case-specific weights.
The presented uniformly weighted assessment model could also prove useful in the
expert-based experiments that would be needed to elucidate weights and even value
functions. We also observed a known shortcoming of SWOT analyses — some metrics
can be categorised as several descriptors. Cited SWOT analysis examples addressed
this issue and could be used to inform further refinement of S W O and T categorisation.
Additionally, while the current SWT and KGs integration with SWOT analysis
framework requires human interaction, it could in principle be performed by a dynamic
multi-agent system (Zhou et al., 2019).
We anticipate several directions for further work. Deriving diverse metrics requires
the integration of additional datasets and urban simulation tools from different domains
into the KG. We are also researching how city planning goals and SDGs can be
structured ontologically, to develop more robust evaluation approaches.
Acknowledgements
This research is supported by the National Research Foundation, Prime Minister’s
Office, Singapore under its Campus for Research Excellence and Technological
Enterprise (CREATE) programme.
References
Akroyd, J., Harper, Z., Souter, D. N. L., Farazi, F., Bhave, A., Mosbach, S., & Kraft, M.
(2021). Universal Digital Twin—Land Use. c4e-Preprint Series. Cambridge.
Akroyd, J., Mosbach, S., Bhave, A., & Kraft, M. (2021). Universal Digital Twin—A Dynamic
Knowledge Graph. Data-Centric Engineering, 2.
Blazegraph. (2020). Geospatial support in Blazegraph. Retrieved November 13, 2021, from
https://github.com/blazegraph/database/wiki/GeoSpatial
Chadzynski, A., Krdzavac, N., Farazi, F., Lim, M. Q., Li, S., Grisiute, A., Herthogs, P., et al.
(2021). Semantic 3D City Database—An enabler for a dynamic geospatial knowledge
graph. Energy and AI, 6, 100106.
Chadzynski, A., Li, S., Grisiute, A., Farazi, F., Lindberg, C., Mosbach, S., Herthogs, P., et al.
(2021). Semantic 3D City Agents—An intelligent automation for Dynamic Geospatial
Knowledge Graphs. c4e-Preprint Series. Cambridge.
Comino, E., & Ferretti, V. (2016). Indicators-based spatial SWOT analysis: Supporting the
strategic planning and management of complex territorial systems. Ecological Indicators,
60, 1104–1117.
Data.gov.sg. (2021). Dataset List. Retrieved November 13, 2021, from
https://data.gov.sg/search?groups%3Denvironment564 A. GRISIUTE ET AL.
Eibeck, A., Chadzynski, A., Lim, M. Q., Aditya, K., Ong, L., Devanand, A., Karmakar, G., et
al. (2020). A Parallel World Framework for scenario analysis in knowledge graphs. Data-
Centric Engineering, 1.
Energy Market Authority. (2017). Renewable Energy—Overview. Retrieved February 4,
2017, from https://www.ema.gov.sg/Renewable_Energy_Overview.aspx
Ervural, B. C., Zaim, S., Demirel, O. F., Aydin, Z., & Delen, D. (2018). An ANP and fuzzy
TOPSIS-based SWOT analysis for Turkey’s energy planning. Renewable and Sustainable
Energy Reviews, 82, 1538–1550.
Ghazinoory, S., Abdi, M., & Azadegan-Mehr, M. (2011). SWOT methodology: A state-of-
the-art review for the past, a framework for the future. Journal of Business Economics and
Management, 12(1), 24–48.
Grisiute, A., Silvennoinen, H., Shi, Z., Chadzynski, A., Li, S., Lim, M. Q., Sielker, F., et al.
(2021). Creating multi-domain urban planning indicators using a knowledge graph: A
district energy use case in Singapore. Presented at the International Conference on
Evolving Cities, Southampton, UK.
Learned, E. P., Christensen, C., Andrews, R. S., & Guth, D. (1965). Business policy: Text and
cases. Irwin Publishers.
Massaro, E., Athanassiadis, A., Psyllidis, A., & Binder, C. R. (2020). Ontology-Based
Integration of Urban Sustainability Indicators. In C. R. Binder, E. Massaro, & R. Wyss
(Eds.), Sustainability Assessment of Urban Systems (pp. 332–350). Cambridge University
Press.
Richthofen, A., Herthogs, P., Kraft, M., & Cairns, S. (2022). Semantic City Planning Systems
(SCPS): A Literature Review. Journal of Planning Literature, 08854122211068526.
Shi, Z., Fonseca, J. A., & Schlueter, A. (2017). A review of simulation-based urban form
generation and optimization for energy-driven urban design. Building and Environment,
121, 119–129.
Shi, Z., Fonseca, J. A., & Schlueter, A. (2021). A parametric method using vernacular urban
block typologies for investigating interactions between solar energy use and urban design.
Renewable Energy, 165, 823–841.
Shi, Z., Herthogs, P., Li, S., Chadzynski, A., Lim, M. Q., Richthofen, A. V., Cairns, S., et al.
(2021). Land Use Type Allocation Informed by Urban Energy Performance: A Use Case
for a Semantic-Web Approach to Master Planning. The 26th International Conference of
the Association for Computer-Aided Architectural Design Research in Asia, CAADRIA
2021 (Vol. 2, pp. 679–688).
Shi, Z., Hsieh, S., Fonseca, J. A., & Schlueter, A. (2020). Street grids for efficient district
cooling systems in high-density cities. Sustainable Cities and Society, 60, 102224.
URA. (2021). Urban Transformations. Retrieved November 13, 2021, from
https://www.ura.gov.sg/Corporate/Planning/Master-Plan/Urban-Transformations
W3C. (2013). SPARQL Query Language for RDF. Retrieved November 14, 2021, from
https://www.w3.org/TR/rdf-sparql-query/
White, T. H., de Melo Barros, Y., Develey, P. F., Llerandi-Román, I. C., Monsegur-Rivera, O.
A., & Trujillo-Pinto, A. M. (2015). Improving reintroduction planning and
implementation through quantitative SWOT analysis. Journal for Nature Conservation,
28, 149–159.
Winkelhake, U. (2018). The Digital Transformation of the Automotive Industry. Springer
International Publishing.
Zhou, X., Eibeck, A., Lim, M. Q., Krdzavac, N. B., & Kraft, M. (2019). An agent
composition framework for the J-Park Simulator—A knowledge graph for the process
industry. Computers & Chemical Engineering, 130, 106577You can also read