Behavioral clues for forager transitions in a fully tracked honeybee colony - Janek Szynal
←
→
Page content transcription
If your browser does not render page correctly, please read the page content below
Behavioral clues for forager transitions
 in a fully tracked honeybee colony

                     Janek Szynal

         Supervisor: Dr. Tim Landgraf

                      Biorobotics Lab
                  Free University of Berlin

       This dissertation is submitted for the degree of
               Bachelor of Computer Science

                         April 2019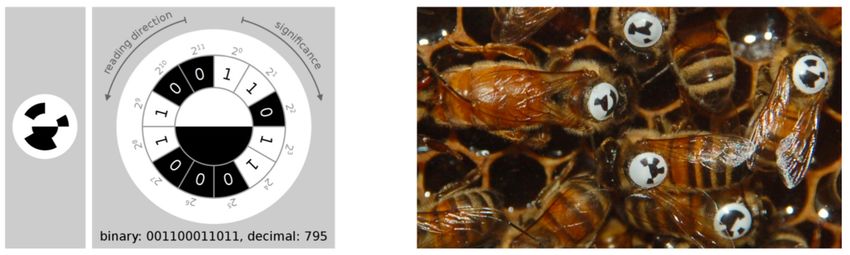
Declaration

I hereby declare that except where specific reference is made to the work of others, the
contents of this dissertation are original and have not been submitted in whole or in part
for consideration for any other degree or qualification in this, or any other university. This
dissertation is my own work and contains nothing which is the outcome of work done in
collaboration with others, except as specified in the text and Acknowledgements.

    Ich versichere hiermit an Eides Statt, dass diese Arbeit von niemand anderem als meiner
Person verfasst worden ist. Alle verwendeten Hilfsmittel wie Berichte, Bücher, Internetseiten
oder ähnliches sind im Literaturverzeichnis angegeben, Zitate aus frem- den Arbeiten sind
als solche kenntlich gemacht. Die Arbeit wurde bisher in gleicher oder ähnlicher Form keiner
anderen Prüfungskommission vorgelegt und auch nicht veröffentlicht.

                                                                                Janek Szynal
                                                                                  April 2019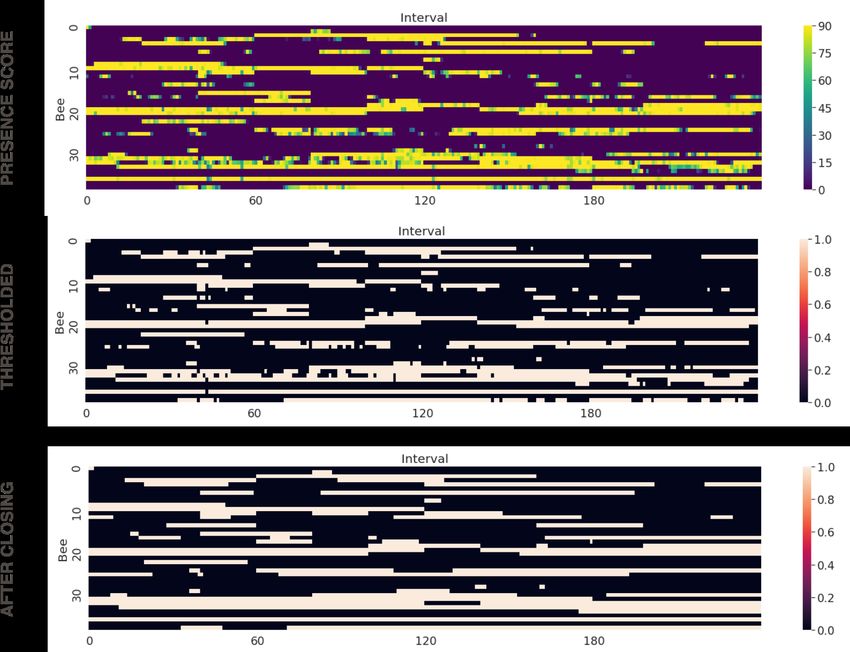
Abstract

The BeesBook system is a state-of-the art system for research into the honeybee (Apis
Melifera). It collects data from cameras continuosly observing a beehive. All individuals are
marked by tags the system can decode. Its main advantages are extensibility and scale (being
able to track an entire colony over its lifetime. In this work I attempt an investigation into the
honeybee division of labor, focusing on the transition to foragers (the workers that survey the
environment for food and transport it back to the hive). I attempt to conduct it in a way that
makes any future examinations of following topics easier and I make recommendations for
such methodology.
Table of contents

1   Introduction                                                                                                                     1
    1.1 The honeybee and the division of labor       .   .   .   .   .   .   .   .   .   .   .   .   .   .   .   .   .   .   .   .   1
    1.2 The foraging phase . . . . . . . . . .       .   .   .   .   .   .   .   .   .   .   .   .   .   .   .   .   .   .   .   .   2
    1.3 The BeesBook project . . . . . . . . .       .   .   .   .   .   .   .   .   .   .   .   .   .   .   .   .   .   .   .   .   2
    1.4 This work’s goals . . . . . . . . . . .      .   .   .   .   .   .   .   .   .   .   .   .   .   .   .   .   .   .   .   .   4

2   Related work                                                                                                                     5
    2.1 Invertebrate observation and tracking    .   .   .   .   .   .   .   .   .   .   .   .   .   .   .   .   .   .   .   .   .   5
    2.2 Tracking unmarked individuals . . .      .   .   .   .   .   .   .   .   .   .   .   .   .   .   .   .   .   .   .   .   .   6
    2.3 Tracking using body markers . . . .      .   .   .   .   .   .   .   .   .   .   .   .   .   .   .   .   .   .   .   .   .   6
    2.4 More related studies . . . . . . . . .   .   .   .   .   .   .   .   .   .   .   .   .   .   .   .   .   .   .   .   .   .   7
    2.5 Works related to Beesbook . . . . .      .   .   .   .   .   .   .   .   .   .   .   .   .   .   .   .   .   .   .   .   .   7

3   Implementation and methods                                                                                                        9
    3.1 Building a structured library of abstractions . . . . . . . . . . . . . . . . .                                               9
    3.2 Detections to Presence to Gaps . . . . . . . . . . . . . . . . . . . . . . . .                                               10
    3.3 Known issues and approaches to addressing them . . . . . . . . . . . . . .                                                   13

4   Evaluation                                                                                                                       15
    4.1 Manual analysis of videos . . . . . . . . .              .   .   .   .   .   .   .   .   .   .   .   .   .   .   .   .   .   15
    4.2 Validating Presence . . . . . . . . . . . . .            .   .   .   .   .   .   .   .   .   .   .   .   .   .   .   .   .   15
    4.3 Validating Gaps and their causes . . . . . .             .   .   .   .   .   .   .   .   .   .   .   .   .   .   .   .   .   16
    4.4 The problem with Trips and general outlook               .   .   .   .   .   .   .   .   .   .   .   .   .   .   .   .   .   17

5   Discussion                                                                                                                       19
    5.1 How to improve Gaps to Trips? . . . . . . . . . . . . . . . . . . . . . . . .                                                19
    5.2 Parameter tuning . . . . . . . . . . . . . . . . . . . . . . . . . . . . . . .                                               19
    5.3 Contributing abstractions . . . . . . . . . . . . . . . . . . . . . . . . . . .                                              20
viii Table of contents
6 Future work 21
6.1 Direct continuation . . . . . . . . . . . . . . . . . . . . . . . . . . . . . . 21
6.2 Other ways of getting a labeled dataset . . . . . . . . . . . . . . . . . . . . 22
References 23
Appendix A Tests against confirmed foragers 25
Appendix B Camera interruptions 27Chapter 1
Introduction
1.1 The honeybee and the division of labor
A honeybee (Apis mellifera) colony manifests multiple fascinating examples of complex
adaptive behaviour. Localized cues exchanged between individuals amount to emergent
directional signals for the entire colony in ways heavily investigated, but often still not
completely understood.
One of the most notable and well-researched adaptive mechanisms of a colony is its
division of labor (DOL). During the winter (a season of low activity for the bees), the
colony focuses on survival and its workers are generalists, performing sets of tasks not easily
distinguishable from those of other workers.
For the spring-summer season, however, the hive’s goals change and along with them,
the patterns of labor division. Hive growth and resource accumulation take priority, and
specialization eventuates amongst workers. They begin to fill distinct roles, the allocation
of which highly correlates with age (an effect known as temporal polyethism) - but is also
grounded in the colony’s current needs and in environmental factors affecting it (adaptive
behaviour) [9]. Groups of workers that can be categorized as performing the same set of
tasks are commonly referred to as castes. It is common to recognize four of them in the
temporal caste system that the worker bees exhibit in the summer [4]: cell cleaners, nurses,
middle-aged bees(MABs), and foragers. This work concentrates on the transition between
MABs and foragers, possibly the most distinguishable and important in the lifecycle of a bee.2 Introduction
1.2 The foraging phase
The foraging phase is the last one in a bee’s life and comes with an increased risk of death.
It is often proposed that this has to do with the extreme strain foraging puts on their bodies
- essentially causing them to work themselves to death. This is supported for example by
[15], where honeybee flight was shown to cause extremely high metabolic rates and induce
oxidative stress, likely significantly accelerating the ageing process and causing early deaths.
On the other hand, the results of [11] suggest that foragers’ deaths are usually caused not by
senescence, but rather by the heightened risks of outside life that come with their function
(such as the risk of predation). According to their findings, forager mortality rates are
constant with respect to age (and not accelerating, as would have been suggested by the body
strain hypothesis).
Regardless of the reasons behind it, foraging nearly always ends in the death of the bee.
That fact, combined other basic metrics of the foraging phas should allow us to get a very
simple estimate of the foraging period, which we could then use for basic validation of the
results we produce with our methods.
Table 1.1 Basic metrics for foraging phase lenght and forager survivorship, according to [11]
Metric Value
Mean lifespan of foragers (+ 1 standard error) 7.7days ± (0.75 days)
Range of values for a forager lifespa 2 -17 days
Probability of death per hours of foraging 0.036
Probability of death per day of being a forager 0.161
Probability of death per trip 0.023
1.3 The BeesBook project
This work operates on data from the 2016 iteration of the BeesBook project [13]. A hard- and
software framework was set up, allowing for high-confidence tracking of all individuals over
the entire lifespan of a honeybee colony. It is the first dataset ever collected (to our knowledge)
that is extensive enough to provide a comprehensive view of a hive’s life, maintaining the
spatial, temporal and social context of the information it stores.
The data it collects can be put in 3 categories:
• a list of detections (each assigned to a bee, a point in time and a point in the hive space)
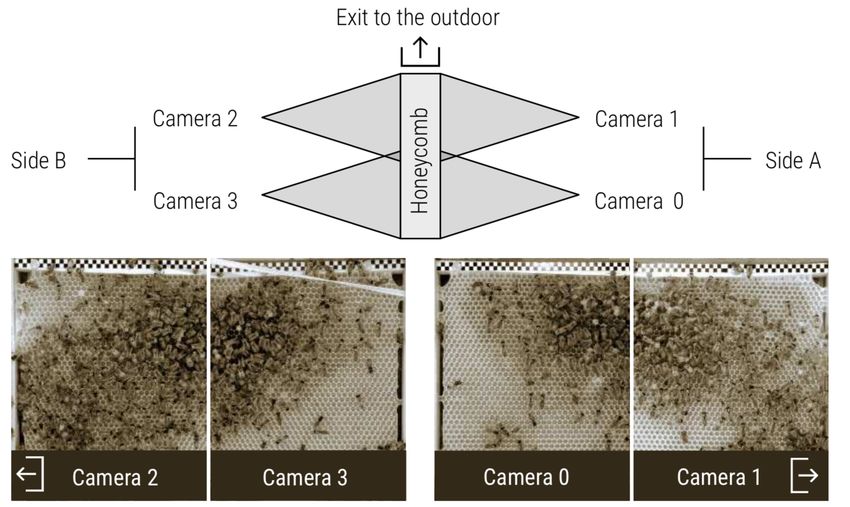
• a collection of individuals’ paths (added in [X])1.3 The BeesBook project 3 Fig. 1.1 The tag used for marking individuals in the BeesBook project uses 12 binary- encoding segments arranged around two semi-circles (that are used to determine orientation of the tag before decoding it). The tag is glued onto the thorax such that the white semi-circle is rotated towards the bee’s head. The tags are designed to endure all activities, including cell inspections and foraging trips. (Figure adapted from [1]) Fig. 1.2 The observational setup consists of four cameras, with a small field-of-view overlap between the two pairs. The hive exit tube is only accessible from Camera 1 and Camera 2’s FOV. (Figure adapted from [8])
4                                                                               Introduction

    • and a collection of bee waggle dance occurrences (added in [X]).

    The original BeesBook paper put significant focus on waggle dance research (and provid-
ing context around it), but the dataset and collection method is meant to serve a very general
purpose. The system is described to be “conceived as a budget-priced framework for the
incremental development of software and hardware components”, capable of supporting a
wide range of investigations into invertebrates, the waggle dance, honeybee division of labor,
collective intelligence and other related fields.

1.4     This work’s goals
This work’s primary goal is to add building blocks to the BeesBook project by deriving new
abstractions that can be used in future analyses and to show how the process of deriving such
abstractions could look like.
    A secondary goal is to provide an example of how analysis could be undertaken in the
future, given the data, the set of abstractions and the process for creating them.
Chapter 2
Related work
I present related work in three categories. The first one is an introduction to invertebrate
tracking and automated observation, along with an overview of the state of the art.
The second focuses on the division of labor in honeybees. It’s meant to set foundation
for the analysis that we undertake in this work, as well as for determining what other kinds
of approaches should be accessible given the BeesBook dataset and the building blocks that
this work adds to it.
Finally, the last one collects works similar to this contribution - ones that use the Bees-
Book dataset to perform some analysis of a honeybee colony’s life and/or add their own
functionalities or improvements to the system.
2.1 Invertebrate observation and tracking
Observing invertebrates at scale, before a certain degree of automation was possible, required
a lot of careful manual work and some creative approaches. A fascinating example of how
experiments were conducted back then can be found in [9]. The authors mark a hundred bees
out of a colony of 21 thousand, using a brush with pigment mixed with shellac (following
the example set by Karl Von Frisch [12]). They then pick for observation small subsections
of the hive (quadrants), employing the help of a Texas Instruments calculator to generate
randomness for their choices. Inferences about the entire population are made using the
samples, but even to observe the samples, 8 hours of continuous work per day, for over
20 days, was necessary. To create maps of activity, authors used glass sheets that they put
markings on and exchanged every day. They then photographed the sheets and projected the
photographs against a single sheet of paper, one by one, thereby aggregating the one-day
information sets into a single map. They also used a number of other physical and numerical
tricks to be able to produce quality data.6 Related work
One step toward an automated process is to take video recordings and analyze them
manually (e.g. [7]), also using markings, sometimes such that identifying a single individual
from its marker was possible. This is less error-prone, but analysis of the film requires no
less time than real-time observation (and often ends up taking much more).
Compared to both those methods, modern approaches that analyze video footage auto-
matically save a tremendous amount of effort. Researchers tend to take one of two paths:
tracking the animals based on their previous positions and body features or using specialized
markers (tags) that are put on individuals for identification.
2.2 Tracking unmarked individuals
A prominent and oft-cited example in unmarked tracking is [5], where good results were
achieved in tracking unmarked honeybees over short periods of time. The system used
there was based on vector quantization and temporal contextual information. It was able to
distinguish between individuals solely based on their body size and movement, keeping track
of 50% of the hive (around 350 bees) over 10 seconds.
A recent notable contribution [2] reports maintaining 71% tracks for over 2 min, around
46% for 5mins. Effects of such approaches are impressive technologically and of great
importance by virtue of being generalizable. Authors cite cells in tissues and human crowds
as examples of potential usage. However, on the problem of invertebrate tracking they do not
yet achieve the results of marker-based systems in terms of effectiveness and scale.
They therefore do not allow for analysis that can draw conclusions relating to entire
lifespans of individuals, or the colony (which is what I am attempting in this work). For
anything related to foraging, systems based on trajectory and body features are particularly
unreliable, as they would inevitably lose track of individuals’ identities whenever those would
leave the hive and come back.
2.3 Tracking using body markers
The most recognizable experiment in tracking entire colonies over longer periods of time was
performed on ants in 2013 [6]. The authors marked newly ecloded workers with a different
color every week, as a preliminary way of tracking their age. They later assigned individual
tags with a barcode-like matrix. Posistion and orientation of all individuals were recorded
twice per second. The focus of that work was interaction networks.
A recent experiment on marked bee colonies with a strong focus on trophallaxis [3] also
has a lot of similarities to ours in terms of tracking method. It uses tag markers and tracks2.4 More related studies 7
multiple bees across a longer period of time. Being focused on a more specific problem
allowed for a more specialized setup that made tracking easier, but was more intrusive in
terms of how it influenced the bees’ lifes. The hive was single-sided and designed in a way
that prevented the bees from obscuring each others’ barcodes (presumably by keeping the
space between hive surface and glass ceiling small). The hive was also backlit by infrared
light, making the surface easier to distinguish from the insects.
2.4 More related studies
An additional compilation of related work can be found in the attachment section of [8].
It collects 14 contributions in a table format, comparing them with respect to parameters
such as species, colony size, duration of study, and tracking method (manual or automatic).
The focus of that comparison is interaction networks - they do, however, still fulfil the more
general criteria of relevance to invertebrate traching and to the BeesBook project.
2.5 Works related to Beesbook
BeesBook is a long-running project with subsequent work building on the design outlined
in the original paper ([13]). Apart from works and theses that use it as foundation for their
research, there were also contributions with an explicit goal of improving the usefulness of
BeesBook’s data:
• [10] Proposes a novel way of artificially generating labeled examples for the tag
classifier
• [14] Improves localization and detection of tags by introducing a pipeline based on
two deep convolutional neural netwokrs (DCCNs)
• [1] Introduces the abstraction of Tracks, used to study trajectories and to significatntly
reduce the number of incorrect decodings
This work is meant to add more building blocks to the BeesBook system and derive new
abstractions that can be used in future analyses. While the aforementioned papers don’t state
that as an explicit goal, they did contribute in this way, particularly [1], with the introduction
of Tracks as a usable abstraction that is now part of BeesBook.
The abstractions I want to add pertain to presence in the hive, division of labor and the
foraging transition.Chapter 3
Implementation and methods
3.1 Building a structured library of abstractions
In this work I attempt to use BeesBook’s data to pinpoint the moment in which workers
transition to foraging, and potentially answer some questions about the circumstances of that
transition.
I propose an approach of defining abstractions layered on top of the original form of the
data (which is a list of detections). Each abstraction is conceived as a step in a funnel that
starts with detections and is meant to produce the status of being a forager (or not).
Fig. 3.1 Visualization of the abstraction steps
A detailed description of the process is presented below. In outline, however:
1. On top of Detections, I define Presence as a numerical score equal to the number of
Detections that were registered for a given bee in a time window of t = 30 seconds.
2. On top of Presence, I define Gaps as periods of time where bees had a Presence score
of zero or close.
3. On top of Gaps, I define Trips as Gaps that seem to be caused by the bee leaving the
hive (as opposed to occlusion, entering brood cells etc.)
4. I finally want to use Trips as a metric that lets me determine when a given bee has
started to forage.10 Implementation and methods
The first key idea is the ability to reuse such abstractions for work with other research
goals. For example, (Marcus, 2019) examines the deaths of bees (and their potential reasons)
using Presence. For research into other parts of the DOL or related in-hive behavior, the first
three abstractions could be reused (e.g. Gaps for an investigation into behavior that relates to
cleaning brood cells).
The second key idea is to apply the same methodology for all new research goals. If
existing abstractions cannot be reused, defining new ones in a preservable or reproducible
way ensures future analyses will be much easier to perform.
3.2 Detections to Presence to Gaps
A Detection in the BeesBook database is the result of a single bee tag being recognized in a
single frame of video. If that tag is also visible in the next frame, this is registered as a new
detection. Each detection has information on where the tag was detected (x/y coordinates
and orientation), when (exact timestamp), with what confidence and by which of the four
cameras.
Fig. 3.2 An example detection
Calculating Presence scores from raw detections is tallying up the number of times a
given bee was detected in a 30-sec interval window. The interval size was chosen arbitrarily,
albeit with some experimentation. The code was written in a way that allows for easy
re-generation of Presence scores with a different interval window size. Another important
hyperparameter is the confidence requirement. Every detection has a confidence value
assigned to it, representing the likelihood that the tag was decoded properly (i.e. belongs to
the bee it was assigned to, and not another one).3.2 Detections to Presence to Gaps 11
Determining a good confidence requirement threshold could conceivably have great
influence on the next steps. A very high threshold could mean that too many valid detections
are filtered out and artificial troughs in presence score are created in consequence. A low
one could mean including detections that did not really occur (should not have occured) and
artificial peaks in presence score are created. The way the process is currently designed, it has
more robustness towards including fake detections than it has toward discarding real ones. It
is therefore reasonable to suspect a fairly low confidence rate should give better results. I tried
thresholds of 0.2 and 0.99 and present the comprison in the Evaluation section. The interval
window size has less significance and is easier to get right. With some experimentation, I
settled on a value of t = 30s.
Each camera records with a speed of 3FPS. With an interval size of 30 seconds, that gives
a max expected Presence score of 90 (with exceptions - see the Problems section below). The
score is then thresholded at 45, mapping it to a binary function. That function is smoothed
out by morphological closing with a rectangular element of size (1, 15).
Fig. 3.3 The three steps of processing Presence. Brighter colors correspond to presence,
darker to absence (see colormaps on the left). Each pixel represents the presence of a single
bee in a single 30-sec interval of time. The rectangles as a whole show Presence over 2 hours
(240 intervals) for 40 bees (same intervals and bees for all three rectangles).12 Implementation and methods
From the binarized and smoothed out form of presence, Gaps are generated by taking the
difference between Presence values for intervals i + 1 and i, for all intervals. This identifies
exits (whenever the difference is -1) and entries (whenever the difference is 1).
This generates a long list of Gaps - all situations, where the video cameras lost track of
a bee and then regained it. For a sample of those situations, I generate videos for manual
analysis (see Evaluation).
Fig. 3.4 An example Gap (disapearence and appearance of a bee) - with parameter names
and values.3.3 Known issues and approaches to addressing them 13 3.3 Known issues and approaches to addressing them Misidentified tags Binary tags, especially such with no error-correcting bits, can sometimes be have a problem with misclassified (wrongly assigned) tags. In the case of BeesBook, this effect was largely corrected in [1] by tracking (combining series of detections into paths based on their locations and timestamps). The initial 13% of incorrect decodings was reduced to 2%. Overlaps Because the field-of-view of camera 0 overlaps with camera 1 and camera 2 overlaps with camera 3, we get duplicate detections whenever a bee enters a thin horizontal area in the middle of either sides of the hive (the overlap areas). Those detections are still true by definition of a BeesBook detection, but they often push the presence score above the assumed maximum of 90. This is resolved simply by replacing any >90 score with 90. The reasoning behind this is that a bee with duplicate detections should be considered present in the hive (all the more given the fact that the overlap areas are not close to the hive exit). Camera outages On occasion, there were camera outages. This is resolved by removing the affected days from the data. A figure that maps outages by day, adapted from [8], can be found in attachments. A more elaborate interactive visualization can be accessed at: https://gitmirgut.github.io/bb_interval_determination/ Camera hiccups In case of some outages, before they happened, the camera would produce more frames per second than it was expected to (for a period of time). This resulted in Presence scores often reaching multiples of 90 (180 or 270). In the worst case, this effect can also combine with the overlap effect. The approach and reasoning here is the same as in the case of overlaps - I consider any score above 90 as the bee being present in the hive and replace it with a 90 to ensure compatibility with the next steps of the process.
Chapter 4

Evaluation

4.1     Manual analysis of videos
I initially tried to use Gaps directly as a feature for identifying foragers. This produced
disappointing results and led me to believe there might be a mistake in the process. I felt
the need to vaildate my steps so far and try a different value for the confidence threshold
parameter (0.2 instead of 0.99). I refered to recordings from the hive as the best source of
ground truth, I randomly selected 200 Gaps (100 for each testet threshold value). I generated
a two-minute video for each of them, with the moment the bee disappears placed in the
middle of the video (subject to variation resulting from the closing operation - hence the
1min margin on each side).
    When analyzing the videos, I was trying to achieve a few goals:

    • test which value of detection confidence threshold procuces better results

    • validate whether Presence and Gaps represent what they were designed to

    • draw general conclusions about the viability of this method for the forager problem

    • see first hand the difficulties and limitations

   In summary, I found that while Presence and Gaps seemed reliably defined and that the
problem lay in the difficulty of defining Trips on top of Gaps.

4.2     Validating Presence
On top of each video, I was displaying the output of my measures for Presence score and
Presence binarized. Those were being updated at the beginning of each of the four 30-second
16 Evaluation
intervals that the video contained. I was comparing these values to what I could observe in
the videos myself.
While my manual observations are obviously not perfectly quantifiable, I found that
Presence scores corresponded to what I was seeing: intervals with perfect visibility of the
tag had maximum scores and lower scores corresponded to proportionally lower observed
visibility. The binarized value for presence was consistent with the score and the threshold,
except for situations where it was changed by the morphological closing operator.
4.3 Validating Gaps and their causes
For every video, I was noting down:
• whether the bee really disappeared at that moment (as seen by a human observer)
• the reason she disappeared
• whether the reason for her disappearance could be a foraging trip
Only a small number of Gaps turned out to be false positives, and that value was twice
as low for a lower confidence threshold (0.2). This is a desired and interpretable result: a
lower threshold means that more detections are taken into account. That makes it easier for
the system to consider a bee present, which fills some Gaps that were created artificially and
should not be there. It could also potentially create those artificial Gaps from misidentifying
tags (and therefore seeing bees while they are not there) - but it seems like the system has
more robustness against that, since the overall number of artificial gaps has decreased so
significantly.
Table 4.1 Percentage of confirmable gaps by detection confidence threshold
High threshold (0.99) Low threshold (0.2) Overall
Real gaps 88% 94% 91%
The number of Gaps that were not caused by a bee leaving the hive has far exceeded
my expectations. To get a better understanging, I was noting the disappearance reason for
all 200 videos I analyzed. Please keep in mind that with some complex interactions, it was
difficult to name one, in which case I took the "top" one. For example, a bee migh be briefly
occluded by crowd, and during that brief moment of invisibility hide permanently in a cell.
The real reason she’s not visible for the next few minutes is that she’s in a cell, but neither I4.4 The problem with Trips and general outlook 17
nor an automatic system of today’s capabilities could pick up on that. A bee disappearing
from the field of view of the camera is also just a proxy reason for something else - after all,
she would be in the view of another camera and we could keep tracking her there.
Fig. 4.1 Comparison of reasons a Gap has started, for two different values of confidence
threshold
4.4 The problem with Trips and general outlook
Table 4.2 Potential trips by detection confidence threshold
High threshold (0.99) Low threshold (0.2) Overall
Possible trips 1% 2% 1.5%
Only three out of 200 Gaps were potential Trips. Not a single time would I see something
as definite as a bee entering the exit tube, the three situations I marked ’potential’ were
essentially bees disappearing in some other way, but very close (and heading in the direction
of) the tube. Given how crowded that entire area was during daily activity, I would venture to
say this might be the best an observer could do in this circumstance (be it human or autmatic).
Because of that, I did not further pursue this method of trying to find foragers. I do, however,
see a way for it to work (and I discuss it in the following sections).Chapter 5
Discussion
5.1 How to improve Gaps to Trips?
The initial idea for this work was to identify foragers using just statistical inference, without
supervision from a labeled dataset. This was in hope that the signal would be clear enough
that basic knowledge of what to expect from a forager’s behaviour would be enough to
interpret it. If I saw clear spikes in amount of trips taken, among bees that are in the right age
groups, that would be the case.
Instead, because of the extreme amount of noise I found when trying to find Trips among
Gaps, I ended up manually labeling videos to make sure my outputs are still grounded in
truth. This is unfortunate, as the labor of manual observation is exactly what the BeesBook
project is trying to spare - but it did spark the idea to manually label enough examples to be
able to train a classifier. While the required effort could prove to be quite high, it is important
to note that it would only need to be made once. It’s a path I did not pursue further, as the
amount of work it would require was outside the scope of this project. I do, however, discuss
how I would go about it in the Future Work section.
5.2 Parameter tuning
One of the main reasons I was longing for a labeled dataset was adjusting hyperparameters.
The model I created for reasoning about foragers is, in the end, very simple - and yet
it unavoidably depends on a few hyperparameters, creating a large number of possble
combinations for their values. Most of those I needed to choose half-intuitively, after some
experimenatation, as properly testing any one was not really possible without a labeled
dataset. This created some degree of uncertainty in the latter stages of the process. While20 Discussion my choices were (to some extent) validated by both Presence and Gaps showing consistency with manual video observation, it would have been much more comfortable to be able to set up a testing framework for them. Fig. 5.1 Visualization of the abstraction steps, with some of the parameters involved in creating them. Emphasized is the only parameter that has been reliably tested for a better value 5.3 Contributing abstractions While unsuccessful in detecting forager transitions, I’m contributing the concepts of Pres- ence and Gaps, along with the code for computing them and the idea of generating those concepts often and saving well. I hope that will genuinely have a positive influence on future investigations, perhaps also involving the foraging question.
Chapter 6

Future work

6.1     Direct continuation
As hinted at in previous sections, I could see a path to reliably identifying foragers based
on the data at my disposal. While I am certain Trips cannot be identified accurately, I can
imagine even a very rudimentary classifier for Trips could be enough to identify foragers, as
all that it’s needed is for the spike in trips to be noticable. For that, perhaps identifying as
little as 10% of Trips would suffice (provided they are more or less uniformly distributed
among real Trips). This is the main reason I believe this approach could still be valid, even if
it failed for my attempt.
     A rudimentary classifier that would label ever Gap as a Trip or Not Trip could conceivably
be trained by human labor in analyzing videos. This would not work if they were generated
from the same set of Gaps that the 200 analyzed by me, but Gaps can easily be filtered to
increase the likelyhood of finding Trips among them.
     Filters could include:

    • time-of-day (foraging is a daily activity

    • camera (only cameras 1 and 2 have access to the exit)

    • exit distance (only disappearances near to the exit can be Trips)

    If the likelyhood for the manual observer to find a gap is high enough (maybe about
20-30% or more), this seems like a viable option of creating enough labeled examples to
train (for example) a Random Forest classifier.
22 Future work
6.2 Other ways of getting a labeled dataset
That being said, there might be cheaper and more reliable ways of creating such labeled
dataset. Two that come to mind (that have alread beed implemented in various experiments)
are RFID tags and exit cameras. Out of this total of three approaches, I would lean toward
exit cams as the easiest to bring to life. It requires much less labor than analyzing videos
or tagging every bee with an RFID chip, it’s also probably cheaper that the latter. The only
consideration here would be that it’s not trivial to install cameras in a way that ensures a
bee’s tag will always be recognized as she exits. Even the smallest tube is a 3D space and
would be prone to the same problems that the in-hive cameras are prone to: tags oriented at
unreadable angles or occluded by other bees. Ideally, three or four cameras would observe
the exit, so that no orientation of the bee would make the tag unreadable. To limit occlusions,
the tube should be as tight as possible, the lower limit being that an exiting bee can pass a
bee trying to enter. The tube should also have enough length so that if occlusions appear,
they are made up for by the cameras detecting occluded bees later.
Being able to observe bees exit the hive would be a much more reliable way of building
up a forager database. That could of course be used directly for analysis, but it would be
beneficial to use it to train a classifier - this way, future or independent iterations of BeesBook
could perform analysis on Foragers without installing exit cameras.References [1] Boenisch, F., Rosemann, B., Wild, B., Wario, F., Dormagen, D., and Landgraf, T. (2018). Tracking all members of a honey bee colony over their lifetime. arXiv:1802.03192 [cs]. arXiv: 1802.03192. [2] Bozek, K., Hebert, L., Mikheyev, A. S., and Stephens, G. J. (2018). Pixel personality for dense object tracking in a 2d honeybee hive. arXiv:1812.11797 [cs, q-bio, stat]. 00000 arXiv: 1812.11797. [3] Gernat, T., Rao, V. D., Middendorf, M., Dankowicz, H., Goldenfeld, N., and Robinson, G. E. (2018). Automated monitoring of behavior reveals bursty interaction patterns and rapid spreading dynamics in honeybee social networks. Proceedings of the National Academy of Sciences, 115(7):1433–1438. [4] Johnson, B. R. (2010). Division of labor in honeybees: form, function, and proximate mechanisms. Behavioral Ecology and Sociobiology, 64(3):305–316. 00077. [5] Kimura, T., Ohashi, M., Okada, R., and Ikeno, H. (2011). A new approach for the simultaneous tracking of multiple honeybees for analysis of hive behavior. Apidologie, 42(5):607–617. [6] Mersch, D. P., Crespi, A., and Keller, L. (2013). Tracking individuals shows spatial fidelity is a key regulator of ant social organization. Science, 340(6136):1090–1093. [7] Naug, D. (2008). Structure of the social network and its influence on transmission dynamics in a honeybee colony. Behavioral Ecology and Sociobiology, 62(11):1719– 1725. [8] Schlegel, A. (2017). Temporal Analysis of Honey Bee Interaction Networks Based on Spatial Proximity. Master’s thesis, Freie Universität Berlin. 00000. [9] Seeley, T. D. (1982). Adaptive significance of the age polyethism schedule in honeybee colonies. Behavioral Ecology and Sociobiology, 11(4):287–293. [10] Sixt, L. (2016). RenderGAN: Generating realistic labeled data – with an application on decoding bee tags. Bachelor Thesis, Freie Universität Berlin. [11] Visscher, P. and Dukas, R. (1997). Survivorship of foraging honey bees. Insectes Sociaux, 44(1):1–5. 00096. [12] von Frisch, K. (1965). Tanzsprache und Orientierung der Bienen. Springer.
24                                                                            References

[13] Wario, F., Wild, B., Couvillon, M. J., Rojas, R., and Landgraf, T. (2015). Automatic
   methods for long-term tracking and the detection and decoding of communication dances
   in honeybees. Behavioral and Evolutionary Ecology, page 103.
[14] Wild, B., Sixt, L., and Landgraf, T. (2018). Automatic localization and decoding of
   honeybee markers using deep convolutional neural networks. arXiv:1802.04557 [cs].
   arXiv: 1802.04557.
[15] Williams, J. B., Roberts, S. P., and Elekonich, M. M. (2008). Age and natural
   metabolically-intensive behavior affect oxidative stress and antioxidant mechanisms.
   Experimental Gerontology, 43(6):538–549. 00096.
Appendix A

Tests against confirmed foragers

Erratum: please note that these plots come from early stages of the experiment. What is
here labeled as "Trips" should be understood as "Gaps". The plots were created before the
introduction of the Gaps abstraction.
    The BeesBook dataset contains logs from an experiment in which artificial feeders were
built near the hive and bees that visited it were being noted down. This created a small set of
ground truth data to operate on. For every bee in that set, I calculated the first and the last
day she was seen at the feeder, and marked them on a plot that shows the number of Gaps for
every day of her life.
    6 of these plots are presented below. While on some of them, the earliest and latest forage
lines seem to correspond to peaks in Gaps quite well, it needs to be noted that those dates
don’t necessarily mean the beginning or end of foraging in a bee’s life, merely the first and
last times that bee was spotted at a feeder.
    The overall impression from seeing those plots was that the method I took could work,
but is not working correctly in the current form.
26 Tests against confirmed foragers
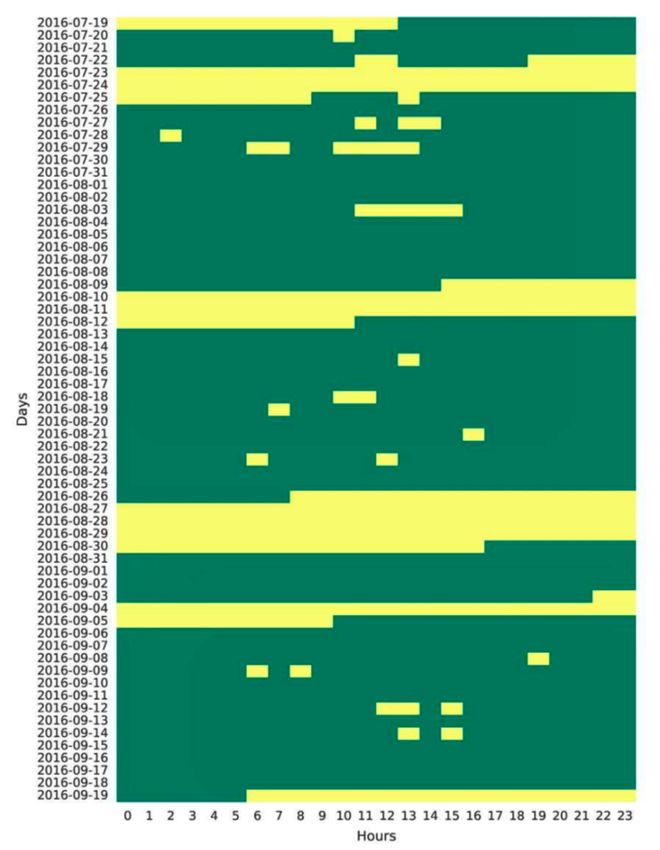
Appendix B

Camera interruptions

Fig. B.1 Recording season with maintainance and failures Green indicates recording went
without any big interruption; Yellow indicates maintainance work or technical failures of one
or all cameras. Calculated using the expected number of files produced by each camera per
hour. Figure adapted from [8]
You can also read