Commonwealth of Massachusetts Department of Early Education and Care - Meeting of the Board
←
→
Page content transcription
If your browser does not render page correctly, please read the page content below
Commonwealth of Massachusetts
Department of Early Education and Care

                       Meeting of the Board
                               January 11 2022
Agenda

         Agenda Item            Details
         COVID Response         •   Child Care COVID Response
                                •   Testing Policies and Metrics

         Infrastructure         •   C3 Operational Grants
         Support: C3            •   Workforce Strategies
         Operational Grants &
         Workforce Pipelines

                                                                   2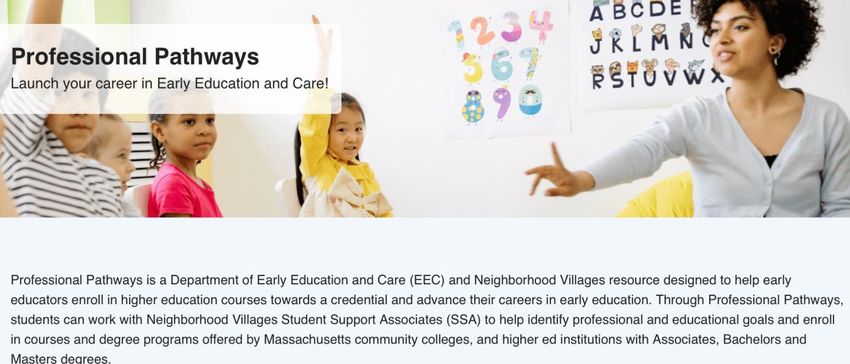
COVID Response

Child Care COVID-19 Response:
• EEC remains responsive as the COVID-19 landscape evolves for programs and families
• COVID mitigation supports include newly published mitigation protocols and guidance,
   continued free PPE ordering for all licensed providers, pooled surveillance testing program,
   rapid-response COVID testing sites statewide for staff and families

                                                                                                  3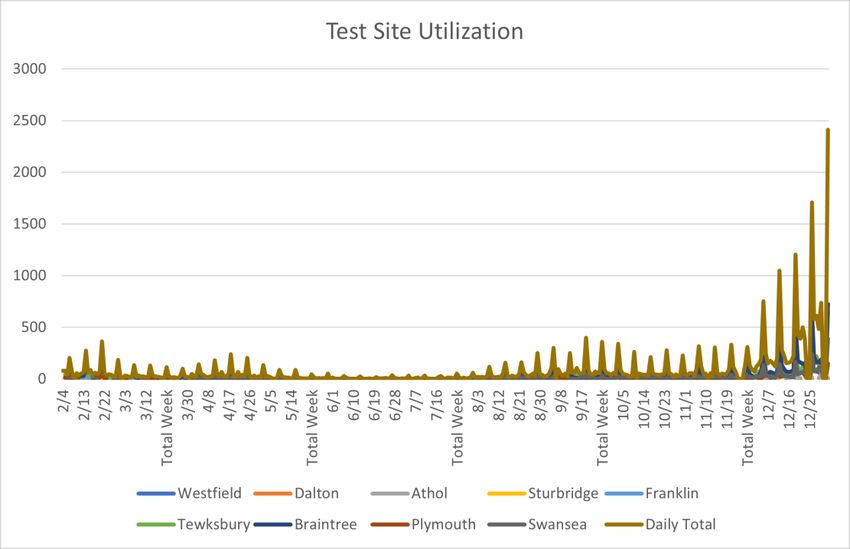
EEC COVID-19 Response Timeline

               FY20 Q4     FY21 Q1       FY21 Q2       FY21 Q3       FY21 Q4        FY22 Q1       FY22 Q2    TOTAL INVESTMENT

                  EECCP                                                                                     $19M EECCP
  COVID
 Response                                                                                                   $57M PPE
                                          Free PPE, testing to all licensed providers

               Family Pckgs                                                                                 $12M Remote Lrng Grnt
   Family
  Support                                                                                                   $10M Summer Step Up
                                     Remote learning supports

  Subsidy      Subsidy Cont’d                                      Rate increases                           $160M subsidy
  Support                                                                                                   payments to pgms
                                     Subsidy payments for all enrolled families, rate increases             during closures

   Parent
 Tuition Co-                             Parent tuition fees fully underwritten                             $113M Parent Fees
    Pays

                              Reopening Stipends                                                            $34M CARES Act
    New,
    Direct                                                 Workforce, Facilities Grants                     $25M Grants
  Financial
 Investment                                                                         C3 Operational Grants   $180M C3 Grants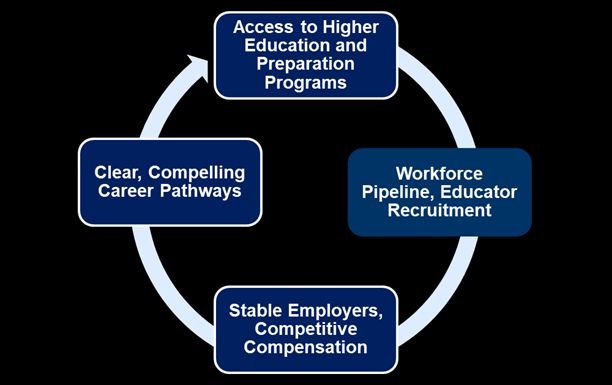
Pandemic Onset: Urgent Needs
March 2020-June 2020: During the first months of the pandemic, child care businesses
underwent mandated closures. EEC pivoted to provide urgent supports for programs and families .

                   EECCP         The Commonwealth's State of Emergency began in March 2020.
    COVID
   Response                      •   Within days, EEC stood up an Exempt Emergency Child Care Program to
                                     serve children of essential workers and vulnerable households
                Family Pckgs
    Family                       •   Almost 600 sites supported 4-5K children daily with free drop in care from
   Support
                                     March – September 2020
                                 •   $19M investment from EEC to underwrite program operations
   Subsidy      Subsidy Cont’d
   Support
                                 EEC also knew that many families with young children would be learning at home
    Parent                       while programs were closed. It worked with WGBH to create learn-at-home toolkits
  Tuition Co-   Parent fees
                                 and other supports for families. ~115,000 toolkits were distributed to programs
     Pays
                                 through CFCE grantees and EEC regional offices.

                                 EEC continued to pay for subsidized enrollment based on March 2020 counts
                                 throughout program closures - so that program infrastructure could be maintained
                                 and services for subsidized families protected.
                                 •   $160M in subsidy payments to programs during program closures
                                 •   Parent co-pays assessed as part of subsidy reimbursements were fully
                                     underwritten by EEC as soon as the state of emergency began. Parent co-
                                     pays continue to be underwritten through January 2022
Child Care Reopening in FY21: Foundational Resources
Summer 2020: In June 2020, EEC programs were allowed to resume operations. EEC targeted
financial and in-kind resources to support safe and healthy reopening.
New,
Direct Reopening Stipends
Financial
Investment
COVID
Free PPE, testing to all licensed providers
Response
EEC distributed CCDBG funding allocated through the CARES Act in the form of Reopening Stipends, designed to
defray fixed operational costs as providers resumed care for children.
• FY20 Supplemental Budget defined eligibility for CARES Act funds as providers participating in the subsidy system
and/or those that had participated in the EECCP system for essential workers
• Total of $44.7M designated for child care and distributed in the months of July and August 2020. $36M was
allocated through grants; the remainder was used for parent fee underwriting
• Providers received $2,250 per classroom or per Family Child Care Home for each applicable month they were open
Personal Protective Equipment: Providers were concerned about the cost of PPE and their ability to find supplies in a
tight market without larger purchasing power. EEC worked through state contracts to purchase and distribute PPE to all
licensed providers throughout the months of reopening.
• PPE distributed through regional offices to all licensed providers through the first months of reopening
• Intermediary quickly hired to enable direct ordering and delivery under the state contract– providers may replenish
supplies monthly, to be delivered to their door. Totals through January 2022 had reached $57M+ free PPE
• A statewide network of free testing sites for all staff and families has also continued to this dayChild Care Reopening in FY21: Responsive Supports
2020-2021: By Fall 2020, EEC programs had reopened, but many school districts opted to
provide remote learning. EEC supported providers to respond to a changing community
landscape.
Family
Support Remote learning supports
Under Executive Order 49, the school day was ‘unlocked’ for EEC programs to support remote learners as they participated
in district led education, while in EEC licensed care.
• EEC expedited processes for existing EEC licensed programs to expand capacity, license new space, and exercise
flexibility in meeting family and community needs
• New exemption categories allowed for locally driven options to arise while still meeting health and safety standards
• EEC made modifications to regulatory barriers so programs could maintain services while serving children in remote
learning, ex. the number of an FCC provider’s own children who could count 'in ratio.'
• $12M in remote learning support grants, issued in partnership with EOE, encouraged collaboration between ~31 districts
and their local providers to form remote learning teams, with parents, in support of young learners – including:
• Collaboration around curriculum and assessment efforts
• Improvements to technology infrastructure for community service agencies supporting remote learners
• Increased child care staffing to allow for multiple remote learning schedules in a single classroom, with staggered
lunch, recess, and movement breaks
• Distributed ~1,000 computers to help with remote learning, especially among FCCs
• Created and adapted the “EEC Playbook” to create a one-stop shop for all COVID-related guidance and tools
• Developed Summer Step Up – $10M initiative launched in partnership with United Way to ensure children returning to in-
person school received a jump-start via 6 weeks of in-person learning over the summer. EEC supported 31 communities,
through local education agencies, to partner with community child care providers as they engaged children with social-
emotional skill-building and in-person learning throughout summer 2021.Child Care Sustainability in FY21 and FY22: Subsidies
Throughout the Pandemic: EEC adopted approaches within the subsidy system that prioritized
flexibility for families and continuity for programs.
Payments for enrolled families
• EEC adopted subsidy policies that would be responsive to the needs of families and programs, sustained throughout
FY21 and FY22 (to date):
• Payment based on enrollment rather than attendance, with flexibility for unlimited absences
• Longer timelines for family job search and other eligibility criteria to recognize an uncertain economic and
employment landscape throughout the pandemic
• Sustained payments through program closures due to COVID mitigation strategies
Subsidy payments for all enrolled families
Subsidy
Increased subsidy rates twice, focusing on elements that
Support
were most difficult to provide during recovery (i.e.
transport. and admin. add-on rates)
Parent
Tuition Co- Parent tuition fees fully underwritten
Pays
Parent tuition Co-Pays:
• As the Commonwealth's families faced economic hardship and employment instability, EEC waived parent co-pays
for subsidy tuition through January 2022
• When parent fees resume in February 2022, EEC will have invested $113M to underwrite parent co-pays for
subsidized tuition since March 2020
• During the pandemic, EEC has also revised the parent fee chart, which will make co-payments more affordable when
federally required co-payments resumeChild Care Sustainability: Infrastructure Rebuilding
Moving Towards Recovery: With the end of the State of Emergency in May 2021, EEC prioritized
resources that would help rebuild child care infrastructure to support the Commonwealth’s economic
recovery and address the changing needs of parents.
Leveraging state and federal investment, EEC has targeted funding towards operational stability and workforce
recruitment and retention:
• Center Based Workforce Grants in FY21: $15M for center based providers to use towards direct compensation for
their workforce, allocated based on licensed capacity to all providers within the subsidy system (per legislative
language), with 'add-on's for those serving remote learners (FY21)
• Family Child Care Facilities Grants in FY21: $15M for FCC providers to use for facilities or program quality
enhancements; allocated to all licensed providers regardless of subsidy status, with 'add-ons' for those serving
remote learners (FY21)
• C3 Operational Grants: $180M distributed as of December, ongoing through FY22
• Available to all licensed providers; leverages federal ARPA Stabilization dollars and CRRSA funding
• Funding amounts underwrite operational costs on a monthly basis
• Formula targets funding adjustments based on staffing levels and across equity domains
• In future, bonus structures to deepen workforce recruitment and retention (centers) and family responsive
services (FCCs)
New,
Direct Workforce, Facilities Grants
Financial
Investment C3 Operational GrantsCurrent COVID Response
10COVID Related Incidents
Reporting to EEC:
• Childcare programs are required to report all
infectious disease incidents (including COVID-19) as
an incident report through LEAD, EEC’s licensing
platform. This helps ensure EEC has a record of any
incident that had an impact on operations at the
center.
• These incidents include, but aren’t limited to:
• Positive cases
• Exposure and/or suspected transmission of
COVID-19
• Classroom closures and/or disruption in care
hours due to COVID-19
• While individual cases of COVID cannot be tracked
through incident reports, EEC has seen an increase of
reports impacting child care provider operations in the
last 2 months
COVID-19 reporting to DPH through LEAD Portal:
• Per statutory requirement, DPH collects COVID-19 case information from LEAD. EEC does not receive
details of this information; however coordinates closely with DPH to obtain aggregate information on trends
across child care.
• Per DPH data, COVID counts reported by EEC providers have increased ~700% over this time last year.
11Continued COVID-19 Mitigation
Given the impact of the current COVID surge on child care, EEC will continue to provide
the following supports for childcare to maintain operations through the winter:
● Ongoing monthly PPE ordering and delivery to all licensed providers (~5,000)
● Pooled testing program for childcare programs in partnership with non-profit partner
● Rapid-response COVID testing sites statewide available to staff and families
● Mandating health-related requirements to ensure safety precautions (i.e. masking)
EEC has added child care specific COVID-19 protocols and guidelines to its website:
● These Protocols and Guidelines provide recommended guidance on how to respond if
a child or staff member is exhibiting a symptom of COVID-19 or tests positive for
COVID-19
● EEC encourages child care programs to include these Protocols and Guidelines,
specifically those around COVID-19 symptoms, into their existing child care illness
policies
● Recommendations include those related to quarantine, isolation, and COVID-19
mitigation
EEC will also continue to be responsive to the field as we move through recovery, expanding
access to resources as needed and available. The next slides show increase access to testing
resources currently under design.COVID-19 Testing
EEC will be expanding access to no-cost COVID-19 drive-through testing for the child
care community at 8 mobile sites across Massachusetts:
● Sites are dedicated solely for program staff, educators, families and children
● Utilization has increased by ~679% since the end of November
● EEC is working with its vendor to extend daily hours, add weekend hours, and/or add
additional testing lanes as quickly as possible, prioritizing the busiest sites.
Tewksbury, Braintree and Swansea will be expanded as early as 1/18/22.Neighborhood Villages Pooled Testing Program
EEC has partnered with Neighborhood Villages to expand testing options and resources for
EEC providers:
• Pooled Testing Program: Asymptomatic surveillance testing for ~8,000 individuals at ~270
childcare programs statewide weekly (rolling enrollment)
• Rapid On-Site Test Supports: Distribution of rapid antigen test kits to programs
● ~3,000 programs have opted into this program within the past week, at a roughly even split of
FCC and GSA programs. This represents:
● ~26,000 staff
● ~94,500 students
● This first-time distribution was targeted to providing tests to the workforce to integrate into safe
return to care strategies being implemented at programs after the holidays.On-Going Rapid Test Distribution Update
• EEC is in the process of developing a testing strategy that will allow programs to perform
regular rapid testing for potentially exposed individuals at child care, informed by the Test and
Stay program used in K-12 schools.
• EEC would aim to support programs with the resources needed to keep staff and children in
care when a positive case is reported within a site.
• This testing Strategy will be designed to:
– Provide protocols for site-based strategies a program can use to utilize testing to help
safely maintain healthy operations
– Account for the unique needs of the child care sector and provide structures that can
distribute tests across all types of providers
• EEC is currently working on securing sufficient rapid antigen tests for distribution to interested
child care providers. Sites who would like to learn more should sign-up with Neighborhood
Villages now to begin receiving information on tests when they become available.
• EEC is currently working with DPH and the medical community to integrate the most up-to-
date research into appropriate protocols for child care.
15C3 Operational Grants
Overview:
• C3 Operational Grants continue to address child care infrastructure – 81% of providers have applied
for, and are benefitting from, monthly funding designed to address the operational needs of child care
providers
• C3 Formula is designed to account for capacity of the program and staffing levels, adjusted using an
equity measure that accounts for community and population served.
• Projected $200M distributed to programs by end of January 2022
• As a reminder, EEC will be extending C3 Operational Grants for January – June 2022
Bonus Structure:
• Programs need support to recruit and retain highly qualified workforce – but also require flexibility
to identify the strategies that will be most effective and meaningful for their staff, their program and
their community
• Concepts for a bonus structure have been informed by field engagement through webinars and
surveys
• Feedback received from engagement and surveys, and initial concepts for bonus structures, are
included here
• EEC will be considering the impact of the COVID surge on programs as the bonus structure is
finalized and implemented
16C3 Operational Grants - Metrics as of 1/11/22
% providers applied
% providers applied
Region and Type for grants (as of 6,016
for grants (as of 1/7)
12/7) programs submitted
1 – Western FCC ~75% ~77% applications for
1 – Western GSA ~79% ~82% funding (~81% of all
eligible programs)
2 – Central FCC ~78% ~79%
2 – Central GSA ~81% ~82%
3 – Northeast FCC ~84% ~86% Projected ~$200M by
end of January 2022,
sustained at ~ $40
3 – Northeast GSA ~77% ~78%
million/month
5 – Southeast &
~76% ~76% ~65% of funding
Cape FCC
has been distributed to
5 – Southeast & subsidized programs
~80% ~81%
Cape GSA
6 – Metro Boston
~83% ~84% ~20% of applicants
FCC
chose Spanish as their
6 – Metro Boston primary form of
~72% ~75%
GSA communication
17Funding Take-up Rates
System Wide Application Take-up Rates
Overall Majority Gateway Low SVI Highest Serving Serving No
Take-Up BIPOC Cities (0-.25) SVI (.75-1) Children Children
Rates Census Receiving Receiving
Tract Subsidies Subsidies
FCC 78% 88% 84% 71% 90% 92% 63%
Center 77% 76% 82% 73% 80% 80% 73%
Based
FCC providers in
Center-Based providers
majority BIPOC census
Center-based take-up in Gateway Cities,
tracts, Highest SVI
rates have increased Highest SVI areas, and
areas, and those who
significantly in recent those who serve children
serve children receiving
months receiving subsidies had
subsidies had the
the highest take-up rates
highest take-up rates
Overall Take-up = total number of providers who have submitted at least one approved application (some providers have submitted for
multiple months) out of all eligible providers. Majority BIPOC census tract take-up = total number of providers who have submitted at least
one approved application (some providers have submitted for multiple months) located in Majority BIPOC census tracts, out of total
eligible providers who are located in Majority BIPOC census tracts.
Analysis by Third Sector
18Typical Funding Per Licensed Child Care Slot
Total Median Funding Per
Month Per Licensed Slot
All Providers $167
FCC $175
Center Based (All) $163
As intended, the staffing
adjustment leads to providers
Center Based (No I/T) $117
serving infants and toddlers
receiving additional funds due to
their lower educator: child ratios
Center Based (>0 I/T) $195
Analysis by Third Sector
19Typical Monthly Funding for Family Child Care Homes
Median per
Licensed Slot
All FCCs $175
Majority White Census Tracts $146
Providers in:
Majority BIPOC Census Tracts $194 ● High SVI Census Tracts
● Majority BIPOC Census Tracts
Gateway Cities $194 ● Gateway Cities
Low SVI (0 - .25) $139 are all receiving additional funding per
child, indicating that the equity
Highest SVI (.75 - 1) $194 adjustment is working as intended and
targeting additional funds to these
Owned/Operated by a Person $194 priority groups of providers
of Color
Owned/Operated by a Black $194
Person
Owned/Operated by a Hispanic $194
or Latino Person
Analysis by Third Sector
20Typical Monthly Funding for Centers
Center based providers show
Median per Licensed Slot similar results:
● Providers who serve
Serves Infants and Toddlers? (I/T) No Serves infants and toddlers are
Infants/Toddlers Infants/Toddlers receiving additional
funding compared to
All Providers $117 $195
those who do not as a
result of the staffing
Majority BIPOC Census Tracts $128 $198
adjustment
● Providers in high priority
Low SVI (0 - .25) $108 $163
communities are
Highest SVI (.75 - 1) $128 $213
receiving additional
funding as a result of the
Owned/Operated by a Person of Color $140 $218
equity adjustment
Owned/Operated by a Black Person $128 $205
Owned/Operated by a Hispanic or Latino $140 $222
Person
Receive Subsidy $117 $206
Do Not Receive Subsidy $124 $183
Analysis by Third Sector
21Reminder: C3 Operational Grants - Bonuses
Workforce Bonus - Addition for Spring 2022
Additional $15/slot will be added to base per-slot amount designed to reflect success in:
• Retaining long-term, existing workforce; recruiting new educators
• Support professionalization by making meaningful expansion in staff benefit structures
• FCC's that have substantially increased family-facing services through hours, infant toddler care, and
other expanded offerings of their child care business
From on-going feedback with the field, EEC recognizes that retaining and recruiting the workforce must be driven
by individual employers that best understand their communities. EEC will aim to provide flexibility for programs to
invest in the compensation enhancements that are most meaningful to their employees.
Feedback surveys remain open on the engagement portal at www.eecstrategicplanportal.org
22Engagement Feedback and Insights
Bonus Structure Proposal
Recommended to EEC by Third Sector Capital Partners
23As the workforce crisis persists, providers are facing significant
challenges retaining educators
• 60% of programs report reduced enrollment driven primarily through staff shortages
• 69% of programs report educator openings, open positions reflect 12% of program staffing
• Educators leaving for other industries (47%) or leaving the workforce (37%) cited as larger problem
than those leaving for other programs (21%) or public schools (34%)
“Our biggest competition is
other industries. Being a
childcare worker they are on the
front lines, being exposed to
COVID regularly and that has
led to several long term
educators leaving the field.
Increasing salary has helped but
many of the talented, certified,
educated workforce we had for
years has left. That is
frustrating.”
C3 Operational Grants Mid-Point 2021 Survey (N=5413
December 2021 Survey to inform bonus structure (N=132 Centerbased educators, 133 FCC educators)As the workforce crisis persists, providers are facing significant
challenges recruiting qualified candidates
Providers without enough educators to meet enrollment demands experience significant trouble getting
qualified applicants to apply (75%) and complete the hiring process (63%) - and then those qualified
applicants are requesting higher salaries (67%).
“Current applicants are not
qualified, not committed to
the field, using job as stepping
stone to public school or
charter schools”
“Many applicants do not show
up for interviews; many ask for
salaries that we simply cannot
provide”
C3 Operational Grants Mid-Point 2021 Survey
December 2021 Survey to inform bonus structureWhat are center-based providers currently doing to recruit quality
educators?
Providers are currently working to provide the following in order to attract new educators:
increased salaries (72%), professional growth opportunities (55%), and benefits (53%)
“Increase in salaries has helped
with recruiting and retention,
bonuses have been very
appreciated”
“We try to increase salaries and
benefits and provide better
teacher/child ratios”
“Just fight through raises– I have
raised my staffs’ pay 3 times in 18
months”
December 2021 Survey to inform bonus structureMany center-based providers already offer core benefits (PTO, sick time,
health insurance, retirement)
• 98% of programs offer benefits; the most common benefits are PTO and sick time (86%) and around
60% of programs offer either health insurance or retirement benefits (although these benefits may not
be available to all employees)
• An average of 30% of funds have already been used for benefits and wages, however programs still
wanted to sponsor more and better benefits such as: free/discounted child care for staff, access to
retirement plans, more PTO, flexible hours, affordable health care and dental benefits, and lower ratios.
“We currently offer a 3%
match for a 503b
retirement account.
Teachers are choosing not
to enroll in this because
they can not afford it.”
C3 Operational Grants Mid-Point 2021 Survey
December 2021 Survey to inform bonus structure
C3 Application Data through January 4, 2021Center-based providers wished they could have more support with
recruitment
Respondents also expressed that the field needs to develop a better pipeline of applicants to be
able to recruit educators particularly from schools (high school/ colleges) or be able to connect
with local teachers who want to work. Providers also wanted access to more recruitment tools.
“Begin to ramp up the early education
field. We need new applicants. We need
people to feel that early education is a
valuable field. We need people to feel
that this can be a lucrative career.”
December 2021 Survey to inform bonus structureWhat are providers currently doing to retain educators?
Increasing salaries over time (76%) and bonuses (60%) cited as most effective tools for retention.
“We are doing our best to retain, but paying our educators more is the only way to make this happen.”
“Long term staff are getting burned out and the monthly bonuses have given them a ‘little boost.’”
December 2021 Survey to inform bonus structureWhat opportunities do educators have to increase their salary?
Programs that have sufficient educators to meet enrollment demands are significantly more likely to offer
raises beyond the cost of living.
December 2021 Survey to inform bonus structureCenter-based providers shared many supports that could help retain
educators to consider in designing the C3 workforce bonus structure
• Respondents felt strongly that bonuses were helpful in the short term, but the best way to retain
staff is sustainable raises to the salary structure
“Provide ongoing funding to support raising the salary scale to align with public school and cost of
living”
“By designing higher pay for teachers… more people will enter the field, You will see a higher
retention rate, you will see more people staying in our field rather than leaving to go into public
school systems.”
• Respondents felt that being able to compensate teachers more with higher qualifications, and pay
educators the same as public school teachers when qualifications are similar, would help retain
educators.
“Not a quick fix but long term... not just a one time bonus but being able to pay teachers what
teachers should make. They are not even close to public schools salaries.”
“A balance of rewarding longevity and retention, while also rewarding work quality and
qualifications.”
C3 Operational Grants Mid-Point 2021 Survey
December 2021 Survey to inform bonus structureSummary - Center-Based Providers’ Current Recruitment & Retention
Reality
1. Center-based providers continue to struggle to recruit and retain qualified
staff, both because of low wages and work conditions as a result of COVID-19.
2. Providers expressed wanting more support to recruit high quality educators,
specifically citing recruitment tools and improving the pipeline of candidates.
3. Raising salaries over time has shown to consistently be the best tool to retain
educators, while providing bonuses, professional growth opportunities and
increased benefits have also been helpful strategies.
4. Providers believe that the following things would be the best way to retain
educators in the long-run and should be included in the C3 Bonus structure:
a. Consistent sustainable increases to the salary structure,
b. Paying higher qualified educators more, and
c. Increasing pay to be on par with public school teachers,
5. Only 40% of providers are currently collecting data on educator retentionFamily child care providers believe the following aspects of their program should be taken into account when designing the bonus structure “Experience is the highest professional qualification” “Level of education completed, area of study, years in the field, years in operation, certifications held” December 2021 Survey to inform bonus structure
Workforce bonus must accommodate the current challenges of the
system while moving towards long term retention/recruitment metrics
                   Short-term goal                                                 Long-term vision

               Programs are able to address persistent      Field has feedback loops on successful
               recruitment and retention challenges in      strategies to educator recruitment,
               individualized ways that meet the specific   retention, salaries, and benefits to inform
               needs of their communities                   future investments in specific workforce
                                                            strategies

Center-based    Range of levels investment programs           Ongoing Metrics of Success:
Measurements    are making in:                                     ○ Annual turnover of educators
                ● Existing Workforce:                              ○ Average tenure of educators
                  Individual educators salaries,                   ○ Salary and benefits increases
                  benefits, etc                                        over time
                ● New Workforce: Recruitment                       ○ Number of new educators
                  bonuses, stipends, etc.

FCC             Range of levels of investments                Ongoing Metrics of Sucess:
                programs are making in:                            ○ Salary/ benefits for FCC
                • salaries, benefits, etc. for assistants              educators and assistants
                   to expand capacity                              ○ Expanded hours or enhanced
                • Enhancements to their business                       services to families that have
                   models to better serve families                     financial implications for FCC’s
Recommended Bonus Structure
Based on current feedback from the field, we recommend use of a self-report on
investments from the C3 Operational Grants to date and the impact on their workforce
retention and recruitment. This will allow for baseline information to be gathered, while
rewarding programs for effective strategies unique to specific communities. The self-report
should include specific data on:
Center-based provider actions to increase retention Family Child Care provider actions to invest in the
and recruitment: business and educator salary:
- salary raises or bonuses including amount, targets, - changes in hourly wages, hours worked, benefits for
tenure at program, funding source FCC educator and any assistant(s)
- new or improved benefits including who received, - investments in family responsiveness and program
when, tenure at program, funding source quality including training, education supports, quality
- professional supports including who received, improvement, as well as changes to program hours,
when, tenure at program, and revenue source additional enrollment or changes to enrollment (ex.
- program revenue reports, enrollment, tax More infants)
documentation, budgets (exact reporting TBD) - tax documentation, enrollment information (exact
- all existing grant reporting and Registry reporting TBD)
participation - all existing grant reporting and Registry
participation
Assumptions: Registry is fully operational with engagement from the field by the end of the fiscal yearWorkforce Strategies
Overview:
• In Sept. the Board met to review EEC's comprehensive workforce strategies
• EEC's strategic action plan goal for educators is to build program capacity for recruiting and
sustaining a highly qualified workforce
• Supporting initiatives include the EEC Credential, Professional Registry, Professional and Career
Pathways, and other efforts towards educator career advancement and professionalization
• EEC has made additional policy and operational shifts to address the immediate workforce crisis
• In Nov. The Board engaged in a conversation about approaches to competency-based training
• Today's focus is to update the Board on strategy progress and propose concrete next steps for
competency-based training efforts
36Strategic Action Plan: Educator and Workforce Initiatives
Jan Update - Workforce Initiatives
Workforce Pipeline and Educator
Recruitment:
• Broaden flexibility for qualifications to
target new educators
into the field (Launched Nov. 2021)
• Coordinate with existing job recruitment
infrastructure to communicate about EEC
sector (Planning in progress)
Access to Higher Education and Preparation Programs:
• Professional Pathways (partnership with Neighborhood Villages)
(Launched November 2021)
• Working with Career Pathways grants, Scholarships to build capacity
to monitor gaps, target capacity to demand (On-going)
Stable Employers and Competitive Compensation:
• Business cohorts to expand program capacity as employers; pilot conclusion
and expansion (underway)
• Operational Grants planning for expansion and targeted investment in
educator compensation (Announced Dec 2021; In Design for Launch in 2022)
Clear and Compelling Career Pathways:
• Launch Professional Registry for educators to centralize all career records and
professional accomplishments (Launching February 2022)
• Develop a professional credential that can serve as a validation for on-going
professional growth (Development ongoing; Training pilot targeted for spring -
see next slides) 37EEC Professional Pathways Update
The EEC Professional Pathways Students inquiring about coursework: 96
resource, led by Neighborhood Institutions enrolling students: 10
Villages, launched in November. Cohorts assembled for coursework: 1; another in formation
Center Directors seeking to enroll their employees: 10
Student Requests Languages requested by students: 4
CDA courses: 5
Child Growth course: 8 Working Well Challenges
Degree options: 12 - online, intuitive, accessible navigation tools - long lead time between
- strong and growing college partnerships prospective student outreach
Director courses: 12
- dedicated, individualized support and final decision to enroll
Lead teacher courses: 14 - EEC funding is following demand/ need - perception that there are
pathways available to
students, rather than one-off
www.eecprofessionalpathways.com courses
- field still acclimating to
qualification changes
- data collection challenges
Institutions receiving students:
Bunker Hill CC, Cape Cod CC,
MassBay CC, Middlesex CC, Mt.
Wachusett CC, Northern Essex CC,
North Shore CC, Quinsigamond CC,
Springfield Tech CC, Urban College
38Updated
Community Colleges and Career Pathways Enrollment
10,700+ students supported across 15 sites with free coursework, credentialing cohorts, and academic
and non-academic supports (see next slide RE types of supports)
Community
Fall 2019 Spring 2020 Summer 2020 Fall 2020 Spring 2021 Summer 2021 Fall 2021 Total
Colleges
Berkshire 56 89 31 21 40 36 55 328
Bristol 0 48 31 14 108 34 148 383
Bunker Hill 45 269 110 54 122 128 54 782
Cape Cod 42 91 54 51 115 55 41 449
Greenfield 36 75 39 63 60 31 47 351
Holyoke 20 212 54 57 46 63 43 495
Mass Bay 100 301 0 67 150 158 134 910
Massasoit 105 193 122 121 142 114 98 894
Middlesex 58 160 53 56 84 54 79 544
Mount
84 110 0 26 36 325
Wachusett 21 48
North Shore 279 282 92 234 260 126 197 1470
Northern Essex 128 428 229 219 283 1566
155 124
Quinsigamond 89 145 12 41 97 46 45 475
Springfield
43 117 117 47 134 530
Technical 46 26
Urban College
0 378 237 138 118 1201
of Boston 120 211
Total (Across
1,085 2,898 1,181 1,209 1,795 1,187 1,350 10,703
Grantee Sites)
39Higher Ed Supports & Completion Rates
Types of academic and non-academic supports provided, with participant frequency; completion rates
Total Students Participating in Support since Fall 2019
Academic Supports
Academic Advising, Career Counseling and Job Placement Support 5212 Certificate and Degree Completion
Textbooks and Other Related Academic Materials 4765
Applying to College, Enrolling in Courses, Completing CDA credential 4203
Training and Courses at Accessible Locations 4115
Flexible Hybrid Models with Online Opportunities 4028
Training on the Use of Technology 2821 TOTAL SINCE Fall 2019
Embedded Tutoring and Coaching within Courses 1931
CDA Certificate Application and Submission Support 1073 All Certificates 1122
Contextualized Adult Basic Education 289
Infant-Toddler Teacher 252
Contextualized English Composition 171
Contextualized College-level Math 168 Infant-Toddler Lead Teacher 120
HiSet or GED Equivalency preparation 77
Financial Supports Preschool Teacher 329
Child Care 1031
Technology 1286 Preschool Lead Teacher 118
Textbooks and Other Related Academic Materials 3610
Transportation 842 Director I or Director II 303
Scholarships or Stipends for Tuition and Fees 4340
All Degree Completion 333
Language Supports
Multi-lingual Advising, Career Counseling, and Job Placement 1812 CDA 253
Co-teaching for Non-native English Speakers 495
Multi-language Instruction 185 Associates Degree 62
Multi-language Textbooks and other Related Academic Materials 272
Training on the use of Technology in Languages other than English 355 Bachelor's Degree 20
Social Supports
Peer Mentoring 1234 Masters Degree 37
Professional Learning Communities 1151
Coaching or mentoring in workplace 881
40Amended Workforce Policies Launch - Updated
This fall, EEC announced the intention to address operational and policy barriers for
providers to hire qualified candidates - without reducing expectations for educator
competencies. Minimum Requirements for Hiring Educators were published December 3.
Requirements were published in English,
Reminder: Key Shifts Mandarin, Spanish, and Portuguese. Based
on initial feedback from providers, key
Policy Direction: Broadens types of EEC-permitted
educator preparation programs and certificates to
clarifying points were immediately
enable candidate recruitment; updates prior work addressed and policies re-published.
experience criteria to allow for activities
demonstrating competency for a prospective role
Over the course of December, the
Operational Direction for Center-Based licensing operations team, especially
Programs: Eliminates Teacher Qualification verification the teacher qualifications unit, supported
process for hiring prospective candidates – to over 600 participants in live office hours to
overcome backlog of former paper-driven process;
provides increased flexibility for programs to confirm answer questions related
qualifications at the site level and recruit candidates to implementation.
quickly by allowing some coursework to be done after
hiring NOTE: All sessions were recorded and remain
posted on the EEC strategic plan portal for ongoing
Operational Direction for FCC
viewing by providers. Web visits to the site doubled
Programs: Streamline FCC assistant workflow and
between November and December, reaching 4,300
reduce required documentation to simplify assistant
hiring processes at the program level total.
41Workforce Committee of the EEC Board
BACKGROUND:
• EEC will use the EEC Public-Private Trust Fund established by the Chapter 124 of the Acts of 2020
(3000-1531) to support pilots for innovative approaches to creating, enhancing and measuring
competency-based training approaches that focus new and existing members of the EEC workforce.
• EEC Public-Private Trust Fund will initially invest $500,000 and has ability to receive philanthropic
funding to expand this investment.
PROPOSAL:
• The EEC Board will relaunch a Workforce Committee in to inform the design of a Department RFP
seeking pilots for competency-based training for the early education and care workforce.
• The Committee will solicit input from appropriate experts to help identify research and models that will
inform the RFP recommendations.
• The Workforce Committee will begin working in February, with the goal to complete recommendations
by Summer 2022.
SUGGESTED GOALS FOR THE COMMITTEE:
1. Develop a definition of competency-based training for the Department to guide applicants
seeking funding, including suggested criteria for training delivery.
2. Inform success measures the Department can use to evaluate the on-going success of pilots.
3. Consider the metrics EEC might use to determine a pilot's ability to scale.
42Appendix
Parent Fee Implementation Update
Caseload Account Spending Updates
43Parent Fee Implementation Update
Area Activity Updates
Comms. Announce detailed plan to subsidy administrators; Complete 12/17
Provide training materials and guidance on family
communications EEC will be releasing an
-Updated Policy Guide updated policy guide and
-Updated Procedures Manual procedures manual to clarify
-Parent Fee Table closure codes and payment
-Parent Fee Online Calculator procedures based on
-FAQs, Templates, and Forms subsidy admin feedback
Operations and Conduct training and drop-in session series for subsidy Fee Trainings: 12/20, 1/5
Training administrators to support in printing funding letters and Attendance Trainings: 1/10,
preparing family communications 1/19
-Training on Calculating Fee Drop-In Sessions: 1/7, 1/12,
-Training on Entering Attendance 1/18, 1/25, 1/28
-General Drop-In Sessions
Parent Work through subsidy administrators to ensure all EEC sent letters on 12/23
Outreach parents have received communications via email and mail; Subsidy
administrators will send fee
agreements by 1/14
Implementation Programs begin collecting co-payments from parents 2/1
using new scale and policies
44FY22 Caseload Account Spending Update
Number of Billed Children
June Actuals July Actuals Aug Actuals Sept Actuals Oct Actuals Nov Actuals
DCF Voucher 4,528 4,686 4,781 4,669 4,459 4,439
DCF Contract 6,420 6,567 6,593 6,388 5,967 5,967
DTA Voucher 7,406 7,468 7,577 7,559 7,311 7,356
IE Voucher 18,083 18,106 18,484 18,291 17,733 17,885
IE Contract 11,703 11,886 12,127 12,171 11,367 11,663
48,140 48,713 49,562 49,078 46,837 47,310
Actual Costs
June Actuals July Actuals Aug Actuals Sept Actuals Oct Actuals Nov Actuals
3000-3060 Base Caseload $ 21,273,013 $ 26,465,920 $ 22,493,957 $ 19,844,139 $ 19,050,902 $ 20,253,830
3000-4060 Base Caseload $ 23,262,414 $ 24,693,760 $ 24,652,771 $ 21,449,103 $ 20,937,618 $ 22,594,275
Parent Fees $ 6,443,310 $ 7,092,513 $ 7,099,891 $ 5,422,347 $ 5,209,045 $ 5,703,295
Total: $ 50,978,737 $ 58,252,192 $ 54,246,619 $ 46,715,589 $ 45,197,565 $ 48,551,399
FY2021 Actuals $ 61,064,343 $ 48,441,849 $ 48,614,667 $ 46,928,116 $ 44,586,492
Difference $ (2,812,150) $ 5,804,770 $ (1,899,079) $ (1,730,551) $ 3,964,907
45Income Eligible Utilization - Overview
Income Eligible Anticipated Current Percent
Child Care Placements Placements Difference Utilized
Voucher 21,665 18,388 3,277 84.9%
Contract 13,541 10,868 2,673 80.3%
Total 35,206 29,256 5,950 83.1%
Source:
- Voucher information based on CCRR weekly report for week ending 1/1/2022.
- Contract information based on contract utilization on 1/5/2022.
46Income Eligible Utilization – Voucher Detail
Voucher Current Percent Current
CCRR Difference
Allocation Placements Utilized Waitlist
Child Care Circuit (Northeast) 6,274 5,789 485 92.27% 4,445
Child Care Network (Cape & The Islands) 1,114 984 130 88.33% 286
Child Care Choices of Boston (Boston) 3,374 2,651 723 78.57% 2,506
Community Care for Kids/QCAP (Metro) 1,743 1,341 402 76.94% 1,040
PACE Child Care Works (Southeast) 3,466 3,216 250 92.79% 2,447
Child Care Resources (Central & Western) 5,694 4,407 1,287 77.40% 4,326
Total: 21,665 18,388 3,277 84.87% 15,050
Source:
- Voucher information based on CCRR weekly report for the week ending 1/1/2022.
- Waitlist information based on active children as of 1/5/2022
47Income Eligible Utilization – Contract Detail
Slots Flex Slots Total Slots Percent Current
Region Program Type Description Slots Used Slots Open*
Awarded Used Used Utilized Waitlist
GSA - Infant to Pre-School 1,081 598.5 37 635.5 445.5 58.79% 1,392
1 GSA - School Age 593 311 21 332 261 55.99% 861
FCC - All Ages 295 234.5 124.5 359 121.69%
Region Totals 1,969 1,144 182.5 1,327 706.5 67.37% 2,253
GSA - Infant to Pre-School 483 413 38 451 32 93.37% 988
2 GSA - School Age 349 348.5 70 418.5 119.91% 584
FCC - All Ages 562 529 217 746 132.74%
Region Totals 1,394 1,290.5 325 1,615.5 32 115.89% 1,572
GSA - Infant to Pre-School 1,122 805 40 845 277 75.31% 2,976
3 GSA - School Age 901 784 113 897 4 99.56% 1,438
FCC - All Ages 748 688 322.5 1,010.5 135.09%
Region Totals 2,771 2,277 475.5 2,752.5 281 99.33% 4,414
GSA - Infant to Pre-School 481 392.5 23 415.5 65.5 86.38% 1,266
4 GSA - School Age 529 306 69 375 154 70.89% 631
FCC - All Ages 423 363 83 446 105.44%
Region Totals 1,433 1,061.5 175 1,236.5 219.5 86.29% 1,897
GSA - Infant to Pre-School 1,175 684 77 761 414 64.77% 1,780
5 GSA - School Age 925 568 11 579 346.0 62.59% 872
FCC - All Ages 451 353.5 0 353.5 98 78.38%
Region Totals 2,551 1,605.5 88 1,693.5 857.5 66.39% 2,652
GSA - Infant to Pre-School 1,923 878 63 941 982 48.93% 1,396
6 GSA - School Age 705 389.5 54 443.5 262 62.91% 866
FCC - All Ages 795 755 104 859 108.05%
Region Totals 3,423 2,022.5 221 2,243.5 1,244 65.54% 2,262
GSA - Infant to Pre-School Total 6,265 3,771 278 4,049 2,216 64.63% 9,798
GSA - School Age Total 4,002 2,707 338 3,045 1,026.5 76.09% 5,252
FCC - All Ages Total 3,274 2,923 851 3,774 97.5 115.27%
Grand Total 13,541 9,401 1,467 10,868 3,340 80.26% 15,050
* Negative values have been removed from the "Open Slot" column since they are caused by EEC's current policy of unlimited flex and
do not take away from the total number of slots still available.
Source:
- Contract information based on contract utilization on 1/5/2022; Waitlist information based on active children as of 1/5/2022. 48Income Eligible Utilization – Waitlist Detail
Region Infant Toddler Preschool School Age Total
Region 1 - Western 340 585 467 861 2,253
Region 2 - Central 293 404 291 584 1,572
Region 3 - Northeast 882 1,064 1,030 1,438 4,414
Region 4 - Metro 334 526 406 631 1,897
Region 5 - Southeast 449 683 648 872 2,652
Region 6 - Boston 461 607 328 866 2,262
Total: 2,759 3,869 3,170 5,252 15,050
Source:
- Waitlist information based on active children as of 1/5/2022
49You can also read