Commonwealth of Massachusetts Department of Early Education and Care - Meeting of the Board
←
→
Page content transcription
If your browser does not render page correctly, please read the page content below
Commonwealth of Massachusetts
Department of Early Education and Care

                                 Meeting of the Board
                                           June 8, 2021

          DRAFT & CONFIDENTIAL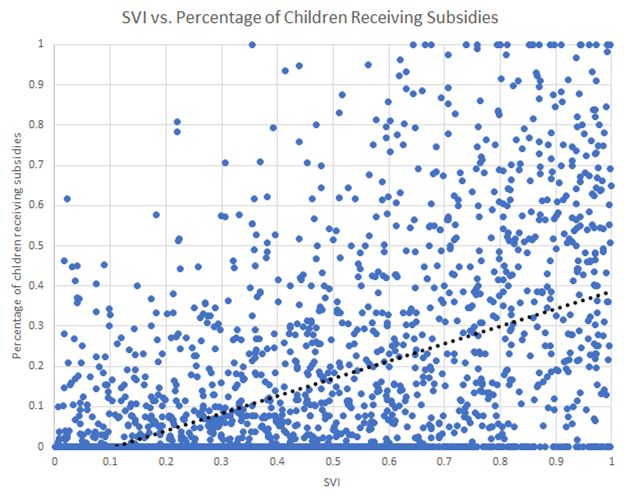
Agenda

1. FY22 Meeting Dates and Vote

2. Department Updates
    ▪   Current State of Child Care
    ▪   Operational Grants
    ▪   COVID-19 Recovery

3. Strategic Plan Progress and Plans
    ▪   Strategic Plan Year 1 Overview
    ▪   CCDF Overview and Vote
    ▪   Parent Fee Update and Vote

4. Commissioner’s Progress Report and Goal Setting for FY22
    ▪   Commissioner’s Salary Vote

5. Budget and Finance Updates
    ▪ Caseload Summary
    ▪ Future Funding Priorities
    ▪ ARPA Stabilization Funding Formula
FY22 Meeting Dates and Vote
DRAFT - FOR DISCUSSION PURPOSES ONLY 3Vote on FY22 Meeting Dates For state fiscal year 2022, the Board proposes the following meeting schedule: • September 14, 2021 (1:00PM-4:00PM) • October 12, 2021 (1:00PM-4:00PM) • November 9, 2021 (1:00PM-4:00PM) • December 14, 2021 (1:00PM-4:00PM) • January 11, 2022 (1:00PM-4:00PM) • February 8, 2022 (1:00PM-4:00PM) • March 8, 2022 (1:00PM-4:00PM) • April 12, 2022 (1:00PM-4:00PM) • May 10, 2022 (1:00PM-4:00PM) • June 14, 2022 (1:00PM-4:00PM) Vote: That the Board of Early Education and Care, in accordance with M.G.L. c. 15D, § 3(b), shall meet in accordance with the schedule set forth above, and that all meetings will begin at 1:00 p.m. and will be held at 50 Milk Street, 14th Floor, Boston MA, unless otherwise announced and duly posted.
Department Updates

   DRAFT - FOR DISCUSSION PURPOSES ONLY   5
Current State of Child Care
         Child Care Re-Opening Trends
                                                                                  Economic and Employment Trends
     (Family Child Care & Group/School Age)
                    # programs pre- # programs
Region and Type                                  % Returned
                             COVID open June 6
 1 – Western FCC              873         716          82%
 1 – Western GSA              394         320          81%
  2 – Central FCC            1157        1003          87%           In surveying of MA             State’s ability to     Women’s
                                                                     employers, over                address its child      labor force
  2 – Central GSA             522         476          91%
                                                                     70% are                        care crisis is a       participation is
3 – Northeast FCC            1296        1108          85%           concerned about                predictor of           a key driver for
    3 – Northeast
                              675         635          94%           sustaining their               women’s labor          economic
             GSA                                                     female workforce               force return           growth
  5 – Southeast &
                              938         800          85%
        Cape FCC
  5 – Southeast &                                                                  Operational Strains for Providers
                              614         591          96%
        Cape GSA
6 – Metro Boston                                                     •    Many providers can’t operate at full capacity due to staffing
                             1066         956          90%                shortages
              FCC
6 – Metro Boston                                                     •    Family Child Care losing ~$600 average per month (Dec ‘20)
                              687         610          89%
             GSA                                                     •    Center Based losing ~$6,000 average per month (Dec ‘20)
                                                                     •    Of all potential priorities for operational spending,
                                                                          programs cited increases to educator wages and income as
                     Capacity Updates                                     highest (March ‘21)
209,102 licensed capacity slots are now
estimated to be available based on current                                             Who is the Child Care Workforce?
                                                                                       Bipartisan Policy Center Feb 2021
LEAD data, representing 90% of EEC licensed                                            92% female
capacity pre-COVID (as of June 6, 2021)                                                41% people of color
                                                                                       47% more than HS degree

                                                     DRAFT - FOR DISCUSSION PURPOSES ONLY                                                     6
FY21 Operational Grants to Support Providers
EEC extended the deadline for the Center-Based Workforce and Family Child Care Facilities grants to
June 11, 2021, to ensure as many eligible providers as possible can take advantage of this opportunity.
EEC has been working in coordination with PCG to provide technical support to providers:
PCG Technical Support:
Total email responses: 3,667
Total phone calls: 2,768 (796 Spanish, 22 Portuguese)
Total voicemails: 1,372 (419 Spanish, 5 Portuguese)
EEC is continuing to take feedback from the field on this process and will assess improvements to
ongoing support as we plan for future grants.
Center-Based Workforce Family Child Care Facilities
Approved 594 2,556
In Progress 522 1,009
Grand Total 1,116 (80% of eligible) 3,565 (65% of eligible)
DRAFT - FOR DISCUSSION PURPOSES ONLY 7COVID-19 Recovery Updates & Policy Proposals
On May 29, 2021, EEC rescinded its COVID-19 specific requirements to eliminate any COVID-19 specific health
and safety restrictions on programs. EEC proposes to maintain the following flexibilities to support program
operations and family access in the months ahead.
Updates & Context Policy Proposal
Subsidies • EEC is projecting up to ~$120M surplus in the • Continue to make subsidy payments based on
caseload account due to fluctuations in enrollment rather than attendance
enrollment. • Continue to offer 6-month provisional authorizations
• Surplus funding will be transferred to an for families without employment requirements
operational reserve account to support FY22 • Continue to allow providers to discount tuition prices
operational supports. as needed
Licensing • EEC implemented many expedited processes • Return to monitoring cycle and in-person monitoring
during COVID that have streamlined regulatory visits after July 2, 2021, in consultation with SEIU
and bureaucratic requirements for small child • Maintain expedited procedures for renewing,
care businesses. modifying or applying for new child care licensure
• EEC is working on a revised set of licensing • Continue to defer licensing fees through FY22
regulations that are expected to be ready for (approx. $900k/year collected from child care
review this summer, integrating learnings from licensing fees)
COVID. • Waive enforcement of some health and safety
requirements as recovery evolves (e.g. requiring
providers to brush children’s teeth)
Workforce • Despite relaxed workforce requirements • Waive enforcement of specific regulations related to
during COVID, workforce shortages account for educator requirements (and disseminate guidance
the biggest constraint on capacity during through policy) to minimize barriers for participation
recovery. in the EEC workforce (e.g. specific staff qualifications
and coursework requirements)
DRAFT - FOR DISCUSSION PURPOSES ONLY 8Strategic Plan Progress and Plans
DRAFT - FOR DISCUSSION PURPOSES ONLY 9Goals Hold Steady through Pandemic and Recovery
Strategic Goals
EEC engaged with over 7,000 voices through strategic plan re-launch and engagement
DRAFT - FOR DISCUSSION PURPOSES ONLY 10Strategic Plan Highlights
Cross-Pillar Achievement Highlights from the Past Year
✓ Built innovation in the subsidy system to support access for
families and stability for providers
✓ Provided support for summer learning grants to expand
school readiness strategies during pandemic recovery EEC will use multiple
mechanisms to enact
✓ Launched key workforce improvements, including change across each
credentialing system, Professional Registry system, and new
Background Record Check regulations and policies strategic plan pillar in
FY22, including rebidding
✓ Sustained 88% of programs throughout the pandemic by contracts, collecting and
providing funding flexibility and technical support
analyzing new data, and
✓ Designed and launched workforce and operational funding leveraging public-private
strategies to rebuild capacity and increase quality across the partnerships.
field
✓ Began cross-sector collaboration to examine intersecting
issues across child care, business, and workforce domains
DRAFT - FOR DISCUSSION PURPOSES ONLY 11CCDF Plan Overview
• In order to receive CCDF funds, Federal law requires all States to submit a State Plan every three
years to summarize its child care programs and certify its compliance with CCDBG requirements.
• The CCDF plan must capture current state compliance, and EEC will update it formally through
amendments as EEC operations evolve in line with the Strategic Plan.
• The engagement EEC facilitated through its Strategic Action Plan Engagement Portal has driven
the development of this plan, and ongoing engagement will continue to drive further
development.
CCDF Highlights by Strategic Plan Pillar
• New parent fee chart • Credentialing Framework • Business support for • QRIS redesign
• Efforts to achieve • Career Pathways and the programs • Assess Market
affordability and access for process EEC is undergoing • Outlines mental and Rates and Cost of
families from low-income to develop a robust behavioral health supports Child Care
households, including professional road map • Early Childhood Support
subsidy policies EEC • EEC’s streamlined Organization (ECSO) Initiative
implemented during the background record check piloting targeted
COVID-19 emergency processes instructional leadership
coaching
DRAFT - FOR DISCUSSION PURPOSES ONLY 12CCDF Plan: Engagement Summary and Vote
• EEC held two (2) virtual public engagement sessions on June 2, 2021 to elicit
feedback on the CCDF State Plan. There were 149 registrants across the two sessions,
with 60 active participants.
• Response was largely positive, particularly in response to the new parent fee scale
and COVID-19 changes to subsidy policy.
Another opportunity for MA to My fervent hope is that these changes
lead the country! will help us rebuild our field better,
stronger, more stable and sustainable.
Vote: The Department recommends that the Board, subject to revision by the
Commissioner based on additional feedback, approves the Department’s process to
finalize the Commonwealth’s CCDF State Plan for federal fiscal years 2022-2024, and
authorizes the Department to submit the finalized CCDF State Plan to the
Administration for Children and Families on or before June 30, 2021 on its behalf.
DRAFT - FOR DISCUSSION PURPOSES ONLY 13Vote on the Revised Parent Fee Scale
• EEC hosted public sessions on March 8, 2021 and March 31, 2021, to solicit feedback
following the Board’s vote to approve the new parent fee scale on February 9, 2021.
• Comments from these sessions indicated:
– Widespread support for no longer counting income below the poverty level, and
for reductions in cliff effects as a family’s income increases.
– Considerations around the subsidy application process and payment policies that
EEC will take under advisement as it develops its implementation plan.
• Now that the public comment period has ended, the Department is requesting that
the Board permanently establish the revised scale. With this vote, EEC will move
toward final implementation planning.
Vote: That the Board of Early Education and Care, in accordance with M.G.L. c. 15D, § 2
and Chapter 73 of Chapter 227 of the Acts of 2020 hereby approves the Commissioner
to permanently establish and implement the proposed Revised Parent Fee Scale.
DRAFT - FOR DISCUSSION PURPOSES ONLY 14Commissioner’s Progress Report and Goal Setting for FY22
DRAFT - FOR DISCUSSION PURPOSES ONLY 15Looking Ahead: New Functions Required in FY22
Data Capacity: leading data collection, analysis, and modeling to forecast caseload; advance program
quality; understand, support, and build the workforce
Data-Driven Strategy to Support Families and Communities: using increased data capacity to create
data-driven subsidy policies and processes, tailoring supply to meet demand
Increased Infrastructure: new and enhanced infrastructure to administer significantly increased funds
to programs, including a funding mechanism for programs outside the subsidy system, accountability
structure for operational funding/ support; support increased collaboration at the community level
Cost Modeling: increased capabilities for identifying economic drivers in the market, modeling the
impact of grants, and establishing longer term financing solutions
Innovation Arm: designing and advancing innovation program design and implementation
Program Quality and Educator Supports: managing routines and structures that can integrate a system
of continuous quality supports with existing monitoring, funding, and verification systems; establish a
new educator registry and align educator supports around a unified credentialing system
DRAFT - FOR DISCUSSION PURPOSES ONLY 16Board Chair Comments DRAFT - FOR DISCUSSION PURPOSES ONLY 17
Budget and Finance Updates

     DRAFT - FOR DISCUSSION PURPOSES ONLY   18
Federal Funding for Childcare
EEC will continue to use federal funding to maximize support for providers, educators, children and
families throughout FY22 and FY23.
2021 2022 2023 2024
Receives Obligates Obligates Liquidates
CRRSAA: $131.1M CRRSAA ARPA CCDBG ARPA CCDBG
ARPA CCDBG: $196.2M ARPA Stabilization Liquidates
ARPA Stabilization:$314.4M CRRSAA
ARPA Stabilization
ARPA Child Care Stabilization CRRSAA ARPA CCDBG
Distribute 6 months of direct grants Included in the Supplemental Budget Pending recommendations of the
to providers to support their Request; proposed spending Legislature's Economic Review
operational capacity (see next slides considerations for FY22 may include: Commission, EEC will develop a
for more information). spending plan with priorities that may
• Provider supports
include:
Key Requirements from Federal
• System-level Workforce
Legislation: • Provider supports
Investments
• 90% of funds must be distributed • System-level Workforce
as direct grants to providers. • Technology investments for
Investments
future innovation flexibility
• Eligible child care providers are • Scaling business and innovation
those that were licensed or incentives for providers
approved as of 3/11/21
Our focus for today's discussion
DRAFT - FOR DISCUSSION PURPOSES ONLY 196-month ARPA Child Care Stabilization Grants
Key ARPA Child Care Stabilization Requirements:
• States must distribute 90% of funding as direct grants to providers.
• States should obligate at least 50% of funding by December 2021.
• Eligible child care providers were licensed (either open or closed due to COVID-19) as of 3/11/21.
Key Features of Grant Funding Proposal Guiding Principles
• At least $225M and up to $283M (90%) of total Short Term Long Term
ARPA Child Care Stabilization funding Stability Help programs continue to Maintain investments in
operate capacity quality to innovate from
• Distributed in six monthly payments beginning in post-recovery
July to support a percentage of operating costs,
targeting ~10% of costs as a baseline Adequacy Support healthy finances Establish tracking of
to sustain operations programs’ investment in
• Funding amounts determined via simple formula despite enrollment adequate compensation
accounting for capacity and staffing costs fluctuations
Equity Focus on bolstering Respond to unique needs
• Operates in addition to current state funding (does capacity in vulnerable and of providers who serve
not replace or alter existing subsidy system) minority communities; children and families of
support minority owned color and low-income
• Goes to all licensed programs, based on capacity businesses communities
and adjusted to account for equity
Simplicity Avoid creating heavy Collect information to
burden on providers target future investments
DRAFT - FOR DISCUSSION PURPOSES ONLY 20Background: Commonwealth Care for Children (C3) Formula
• COVID has reinforced the necessity for improving business stability for child care and
identifying a different financing model.
• EEC has engaged Third Sector Capital Partners to build a formula methodology that
draws on existing work completed by EEC during strategic planning and develop an
economic model to evaluate the impact of a capacity-based formula grant.
• EEC has hosted a series of engagement sessions and focus groups to inform C3 formula
design:
Key Feedback from Field
● The need for sufficient funds to ensure programs can continue operating is urgent
● The process for receiving funds needs to be clear, simple, and straightforward
● Program location alone cannot identify all programs enrolling underserved children
and families
DRAFT - FOR DISCUSSION PURPOSES ONLY 21Commonwealth Care for Children (C3) Formula
Key Formula Components:
• The goal of the payments is to cover a percentage of operating costs. This would be adjusted for programs that have higher
investments in staff and those serving vulnerable communities.
• All elements of the formula have been vetted to evaluate the impact on equity, distribution across the Commonwealth,
and funding for Gateway Cities
• Equity Adjustment helps account for those serving vulnerable communities and children
• Formula uses Social Vulnerability Index (SVI) as an indicator of community need; allows for outliers where needed
• Funds to small business will be targeted by factoring in the relative compensation of the CEO compared to the educators
• Third Sector will test model to inform ongoing efforts and the recommendations of the Economic Review Commission
EQUATION = BASE AMOUNT + Equity Adjustment
EEC is considering the feasibility of capping or otherwise reducing payments for programs with an unacceptably high level of
CEO compensation relative to educator compensation
Base Amount Equity Adjustment
Base Amount = Equity Adjustment =
Adjusting the size of Level 1: (Base Amount * 25%) if...
($ starting $ amount* X
payments based on • SVI >=.55 and =.75 OR
Ratio* X care • >66% of enrolled children receive subsidies
DRAFT - FOR DISCUSSION PURPOSES ONLY 22FY21 Caseload Overview
Jan 2019 Jun 2019 Jun 2020 Sep 2020 Feb 2021 March 2021 April 2021
55,156 ↑ 58,738 ↓ 55,212 ↓ 47,082 ↓ 43,398 ↑ 44,287 ↑ 44,627
• Enrollment Trends: EEC is experiencing ~80% of typical subsidy enrollment, with utilization varying
across regions and age groups.
• Cost Trends: We are still seeing significant costs (daily rate) for school age children, and overall
costs per child are continuing to increase. DTA and Supportive costs have also increased for the
first time this month.
Waitlist Data:
• Through the CCR&Rs, EEC has made a significant effort to release funding letters to families on
the waitlist, with ~1,200 funding letters were released to families in the past month (~7,800
total funding letters sent in FY21).
• At the same time, 1,754 children were added to the waitlist in the last month.
• EEC is continuing to investigate why families are opting not to enroll—likely a combination of
difficulty in navigating the subsidy system and lack of placements that meet their individual
needs.
DRAFT - FOR DISCUSSION PURPOSES ONLY 23Appendix
24FY22 Meeting Dates
Executive Summary:
As this is the last board meeting of FY21, EEC needs to set board meeting dates for FY22.
Decision Needed: Vote on FY22 Meeting Dates
DRAFT - FOR DISCUSSION PURPOSES ONLY 25Department Updates
Executive Summary:
• Roughly 88% of pre-COVID center-based and family child care programs have re-
opened
• EEC has implemented a multi-pronged strategy to continue to support programs
through this time:
• Operational grants offered through FY21 state appropriation have provided
funding targeted to workforce compensation
• EEC plans to continue to promote flexibility with subsidy, licensing and workforce
policies
DRAFT - FOR DISCUSSION PURPOSES ONLY 26FY21 Operational Grants to Support Providers
EEC is investing $30M in state funding to address compensation for the workforce who provided
in-person education and supports throughout the pandemic to date.
Center-Based Workforce Grants
• Eligibility: Center-based providers who served at least one subsidized child since 7/1/18
(1,378 or ~50%)
• Funds distributed based on capacity
• $150 * licensed capacity; $30 per remote learner bonus if open for remote learning
supports
• 90% of funds must be used to support compensation for staff directly serving children
Family Child Care Facilities Grants
• Eligibility: All Family Child Care providers (5,500)
• Flat grant per provider
• $3,000/home; $150 bonus if open for remote learning support
• Funds to address health and safety program investments or quality enhancements; can
reimburse themselves for improvements already made or invest in new enhancements
DRAFT - FOR DISCUSSION PURPOSES ONLY 27Strategic Plan Progress and Updates
Executive Summary:
• Despite challenges brought on by the COVID-19 pandemic and recovery, EEC has
made steady progress in its Strategic Action Plan goals throughout FY21.
• EEC will continue to use multiple mechanisms to enact change across the strategic
plan in FY22
• EEC’s Child Care Development Fund (CCDF) Plan for 2021-2024 represents changes
EEC has implemented over the past few years and is firmly rooted in Strategic Action
Plan goals and principles.
• The CCDF plan is a living document that EEC will update as its key initiatives progress
and develop.
• The planned Parent Fee chart changes are codified in our CCDF plan and are integral
to our focus on increasing access for families.
• Decisions Needed:
• Board vote on CCDF plan, pending final version updated based on full public
comment analysis
• Board vote on Parent Fee Chart
DRAFT - FOR DISCUSSION PURPOSES ONLY 28Initial Engagement on Solutions for Child Care
EEC has performed exploratory conversations with many stakeholders across secretariats and
industries to understand short and long-term opportunities for innovation in child care.
Exploratory Conversations to Date:
• Cross-Secretariat planning meetings with EOLWD and EOHED
• Pilot development discussion with Commonwealth Corporation and MassHire Board Members
• Engagement with House and Senate Leadership, Education Chairs, key legislators, Legislative
Leadership, and the Economic Review Commission
• Live feedback sessions with small business owners and multi-state child care interest groups
• Strategic engagement with emerging Early Childhood Business Coalition (funded by Eastern Bank)
Additional Exploration with the
Immediate Need for Workforce Pilots
Business Community
• Work to address specific barriers for • Partner with the Early Childhood Business
individuals to enter the child care Coalition and Commonwealth Corporation
workforce through regulatory waivers and to develop a business engagement
targeted investments strategy for summer, 2021 focused on:
• Innovative models for child care
• Partner with Commonwealth Corporation • Women and people of color in the
to identify key recruitment strategies to workforce through the recovery
be piloted through the summer
DRAFT - FOR DISCUSSION PURPOSES ONLY 29EEC’s Workforce Strategy
Workforce constraints are the number one limitation EEC faces in maintaining and expanding child care.
This challenge requires a multi-faceted approach, and EEC is working with multiple public and private
partners to invest in a diverse set of workforce strategies.
Access to Higher
EEC Investments and Education and EEC Investments and
Partnerships: Preparation Programs Partnerships:
EEC Educator Credential is Career Pathways grants,
intended to establish clear scholarships, and cohorts for
career pathways for the coursework
workforce.
Clear, Compelling Competitive
Career Pathways Compensation
EEC Investments and EEC Investments and
Partnerships: Partnerships:
Business cohorts for child Workforce and Stabilization
care business owners, Grants designed to target
including coaching Stable Employers investment in educator
compensation
In order to fully leverage these investments, a coordinated industry-wide recruitment efforts will be critical. EEC
is currently working with Commonwealth Corporation to identify public-private recruitment strategies to
pilot this summer and inform investments during FY22.
DRAFT - FOR DISCUSSION PURPOSES ONLY 30Proposed Plan for Business and Legislative Engagement
EEC has a comprehensive engagement plan to develop pilots and innovations with the business
community, legislature, and all other key stakeholders. This engagement will culminate in a plan for
innovation in child care.
Summer Fall Oct+
July 1: Dec 31:
Formula Economic Review
Launched Commission Report
• Preview and release
• Regional, caucus, and • Status Update – impact of
innovation in child care plans
Legislative individual legislative meetings federal dollars based on
• Respond to recs. from
Engagement on child care planning initial data from the
Economic. Review
formula launch
Commission
• Launch business advisory group
with leaders to guide efforts
Business • Pressure test Child Care • Pair business and innovation
• Cross-sector employer webinars
Engagement Innovation Models models
• Chambers of Commerce, MA
Business Round Table
• Refined analysis & caseload
• Bipartisan Policy Center • Begin to evaluate pilot
forecasting
Data family demand data efforts
• Gather data on industry
& Comms • Improved analysis of • Grant impact analysis fuels
capacity and enrollment from
industry employer data future approaches
the C3 Formula Grants
31
DRAFT - FOR DISCUSSION PURPOSES ONLYSummary of Parent Fee Model Proposed
Key Features of New Parent Fee Scale
• Fee scale only considers income that is above the poverty threshold.
• Model expects co-pays to begin when family incomes exceed 100% of the poverty level.
• The model uses a parent co-pay schedule in which 28 equally sized income ranges have been developed
spanning from those at and under 100% of poverty to incomes at 85% of State Median Income (maximum
allowed by federal regulations).
– Co-pay requirements in each row are based on assigned percentages of a family’s income, charged on income
over the poverty threshold only, by family size.
– Assigned percentages range from a low of 4% for row 2 (families just above the poverty threshold) to a high of
15.6% on income for row 28 (those just under 85% of SMI) for the first child (youngest child).
– These percentage rates yield expected co-payments that equalCommissioner’s Progress Report and Goal-Setting for
FY22
Executive Summary:
• In the last Commissioner Evaluation, the board highlighted growth in hiring to expand the executive
bench for the Commissioner as a key goal for the future; a renovated organizational chart reflects
consolidation and elevation in senior role
• Staff growth will likely continue to be a leading priority for agency sustainability and health under
the Commissioner's leadership
• Increases in funding related to pandemic recovery have more than doubled the Department
budget YOY and introduced new complexity to administer pioneering financing approaches
• Progress implementing the strategic plan has reached a threshold where enhanced data
capacity, program quality support, and program innovation capabilities are required
• With successful execution of the staffing plan, EEC will be poised to also fulfill its goals for FY22 and
administer significantly increased public dollars with effectiveness, efficiency, and integrity
Decision Needed: Board vote on Commissioner Salary
DRAFT - FOR DISCUSSION PURPOSES ONLY 33Looking Ahead: An Evolving and Growing Agency
Work in FY22 EEC BUDGET
➢ Distribute federal funding in ways that are $1,600,000,000 $1,520,193,641
unprecedented in size, structure, and
intended recipients for funds $1,400,000,000
➢ Drive towards proof of concept on $1,200,000,000
operational grants’ effectiveness towards
industry stabilization, workforce
recruitment, and increased quality $1,000,000,000
➢ Launch innovative pilots in child care and $800,000,000 $732,230,123
workforce recruitment to meet the
$596,199,893
changing needs of employers and working $600,000,000
families and build capacity for children
$400,000,000
➢ Implement key strategic plan priorities
designed in FY21, including credentialing,
a new approach to quality, and overhaul $200,000,000
of regulatory structure and subsidy
systems $0
Department Budget
➢ Reorganize department structure and
build key functions to implement FY22 and FY19 FY20 FY21
FY23 priorities
DRAFT - FOR DISCUSSION PURPOSES ONLY 34EEC Organizational Future State
Board of Early
Education and Commissioner
Care
Commissioner’s
Office
General Counsel A&F
Research,
Field Operations
Community Internal Policy Family Access Childcare
Innovation and Engagement Operations Development and Services Operations
Supports
Office Community
Legal
Financial
BRC
Legislative Infrastructure Policy Drafting Regional
Management Program Affairs and Alignment Collaborations Licensing
and
Innovation
Coordination
Budget and Family Supports Program
Grant Investigations Communications Staff Resources Infrastructure
Research and
Management and Support and Quality
Data
Audit Resolution Residential and Strategic Educator
Program Placement Partnership Contact Center Qualifications
Supports Licensing
Subsidy Project
Management Educator Project Technology Management
Supports Management Project
Management
Federal
Regulations and
Monitoring Grantee
Management
DRAFT - FOR DISCUSSION PURPOSES ONLY 35Budget and Finance Updates
Executive Summary:
• EEC has received multiple federal funding sources through CRRSAA and ARPA, each
with specific funding restrictions and timelines:
• CRRSAA CCDBG: $131.1M in Child Care Development Block Grant
• ARPA CCDBG: $196.2M in Child Care Development Block Grant
• ARPA Child Care Stabilization: $314.4M in Child Care Stabilization Fund
• EEC is planning to distribute ARPA Child Care Stabilization funding through 6-month
operational grants to providers, using the Commonwealth Cares for Children (C3)
Funding Formula.
• EEC has been experiencing ~80% of typical subsidy enrollment. Enrollment in EEC
tuition subsidies has continued to fluctuate throughout FY21, indicative of overall
child care enrollment statewide.
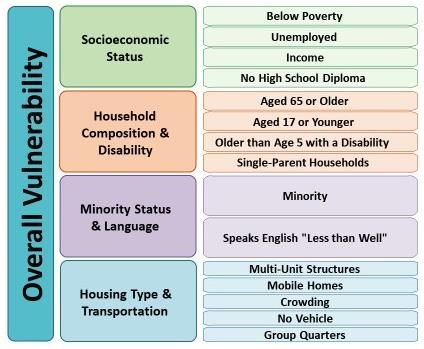
DRAFT - FOR DISCUSSION PURPOSES ONLY 36What is the SVI?
SVI Context SVI Variables
• SVI=The Social Vulnerability
Index
• SVI is a comprehensive metric
developed by the CDC
• SVI Scores are from 0 to 1 -
relative to Massachusetts only
• Takes into account 15 variables
at the census tract level
• In a perfect world - the formula
could reflect actual enrollment -
but the SVI is one way to make
our best guess of who each
provider is serving
DRAFT - FOR DISCUSSION PURPOSES ONLY 37Equity Adjustment Tiers
There are two tiers of the equity adjustment that will incorporate both the SVI
level and percentage of children receiving subsidies
Level 1 Equity Adjustment
Receive 25% of base amount in
additional funding if:
• SVI >=.55 and =.75 OR
• >66% of enrolled children
receive subsidies
DRAFT - FOR DISCUSSION PURPOSES ONLY 38FY21 Caseload Account Spending Update
Number of Children Billed
June Actuals July Actuals Aug Actuals Sept Actuals Oct Actuals Nov Actuals Dec Actuals Jan Actuals Feb Actuals Mar Actuals Apr Actuals
DCF Voucher 4,631 4,136 3,834 3,945 3,878 3,878 3,872 3,905 3,907 3,942 4,008
DCF Contract 7,449 7,401 6,750 6,754 6,384 6,179 6,055 6,009 5,899 5,976 5,978
DTA Voucher 11,577 10,425 9,503 9,290 8,727 8,294 7,782 7,328 6,978 7,008 7,024
IE Voucher 20,316 17,546 16,632 16,857 16,208 16,057 16,114 16,067 16,063 16,310 16,454
IE Contract 11,239 10,860 10,134 10,236 9,775 9,781 9,844 10,110 10,551 11,051 11,208
55,212 50,368 46,853 47,082 44,972 44,189 43,667 43,419 43,398 44,287 44,672
Actual Costs with Comparison to Last Year's Actual Costs
June Actuals July Actuals Aug Actuals Sept Actuals Oct Actuals Nov Actuals Dec Actuals Jan Actuals Feb Actuals Mar Actuals Apr Actuals
3000-3060 Base Caseload $ 26,281,485 $ 29,191,159 $ 22,566,748 $ 23,256,562 $ 21,751,378 $ 20,276,668 $ 21,621,611 $ 19,094,198 $ 18,000,819 $ 20,276,375 $ 20,162,487
3000-4060 Base Caseload $ 24,055,581 $ 25,141,886 $ 20,264,410 $ 20,052,420 $ 19,917,815 $ 19,197,258 $ 21,167,582 $ 19,509,808 $ 19,210,390 $ 22,804,635 $ 22,049,997
Parent Fees $ 6,393,261 $ 6,674,369 $ 5,552,830 $ 5,297,243 $ 5,244,670 $ 5,082,441 $ 5,625,644 $ 5,230,210 $ 5,205,055 $ 6,202,871 $ 5,982,066
Total: $ 56,730,327 $ 61,007,414 $ 48,383,988 $ 48,606,224 $ 46,913,863 $ 44,556,368 $ 48,414,837 $ 43,834,216 $ 42,416,264 $ 49,283,881 $ 48,194,550
FY2020 Actuals $ 56,568,742 $ 51,728,018 $ 43,457,870 $ 48,810,289 $ 45,230,597 $ 47,631,791 $ 50,284,281 $ 43,923,415 $ 50,348,634 $ 55,179,902
Difference $ 4,438,672 $ (3,344,030) $ 5,148,354 $ (1,896,426) $ (674,229) $ 783,046 $ (6,450,066) $ (1,507,150) $ (1,064,753) $ (6,985,352)
Notes:
- June and July billing numbers reflect families transitioning during reopening.
- Costs in all months have been adjusted to account for the implementation of the CBC Rate
increase, including the retroactive payment back to July.
- Even with the reopening of in-person school, EEC continues to pay full time for school age
children enrolled in, or who may need, full-day programming. This will continue to cause
increased costs for the remainder of the fiscal year.
- School age children represent approximately 50% of the billed caseload
39FY21 Caseload Account Spending Update
– Since the start of September, the average daily rate paid across all program types has increased over 9%
while the number of children in care has dropped by 6%.
– Compared to the same time period last year, EEC is continuing to experience significantly higher costs, with
markedly lower caseload.
– It should be noted that April is typically a higher cost month in a normal year, so the lower percent change
in costs from FY20 to FY21 is expected.
– Expenses in the Income Eligible account increased, as the child count has gone down.
FY2021 Jul-20 Aug-20 Sep-20 Oct-20 Nov-20 Dec-20 Jan-21 Feb-21 Mar-21 Apr-21
FY2021 Number of SA Children 24,814 22,569 22,354 20,600 20,329 20,404 20,327 20,390 20,809 21,094
FY2021 Total Cost of SA Care* $20,047,595 $16,166,409 $14,700,665 $14,146,679 $13,575,161 $14,871,139 $13,691,530 $13,357,847 $15,818,636 $15,131,657
FY2021 Number of Billable Days 23 21 22 22 21 23 21 20 23 22
Average Daily Rate Paid $35.13 $34.11 $29.89 $31.22 $31.80 $31.69 $32.07 $32.76 $33.05 $32.61
% Change from prior month -2.89% -12.37% 4.43% 1.87% -0.35% 1.22% 2.12% 0.90% -1.35%
FY2020 Jul-19 Aug-19 Sep-19 Oct-19 Nov-19 Dec-19 Jan-20 Feb-20 Mar-20 Apr-20
FY2020 Number of SA Kids 27,858 28,249 24,893 24,497 24,888 25,481 25,669 26,350 26,376 26,659
FY2020 Cost of SA Care* $21,010,042 $19,049,782 $11,615,248 $13,276,879 $12,660,082 $14,083,586 $14,414,119 $13,500,547 $14,909,024 $16,130,022
FY2020 Number of Billable Days 23 22 21 23 21 22 23 20 22 22
FY2020 Average Daily Rate Paid $32.79 $30.65 $22.22 $23.56 $24.22 $25.12 $24.41 $25.62 $25.69 $27.50
Comparison July August September October November December January February March March
% Change FY20 to FY21 - # of children -10.93% -20.11% -10.20% -15.91% -18.32% -19.92% -20.81% -22.62% -21.11% -20.87%
% Change FY20 to FY21 - Daily Rate 7.12% 11.28% 34.53% 32.47% 31.28% 26.13% 31.37% 27.86% 28.64% 18.56%
Note: To provide an accurate year to year comparison, the FY20 cost was adjusted to include the FY21 rate increases and
the FY21 Cost excludes the value of parent fees paid.
40FY21 Caseload Account Spending Update
• Monthly Decline in Daily Spending Rate
– To compare monthly expenses, EEC uses a daily spending rate to account for different number of days in
each month.
– Through the months that enrollment rates continued to decline, the reductions in Daily Spending Levels
slowed and even increased in some months.
– The increases in enrollment seen in March and April have also contributed to increased costs.
– All months have been adjusted to account for the implementation of the CBC Rate increase, including
the retroactive payment back to July.
# of Days 23 21 22 22 21 23 21 20 23 22
July Actuals Aug Actuals Sept Actuals Oct Actuals Nov Actual Dec Actual Jan Actual Feb Actual Mar Actual Apr Actual
% change from
previous month -13.14% -4.11% -3.48% -0.50% -0.79% -0.84% 1.60% 1.04% 2.23%
3060 Daily $ 1,269,181 $ 1,074,607 $ 1,057,116 $ 988,699 $ 965,556 $ 940,070 $ 909,248 $ 900,041 $ 881,582 $ 916,477
3060 Total $ 29,191,159 $ 22,566,748 $ 23,256,562 $ 21,751,378 $ 20,276,668 $ 21,621,611 $ 19,094,198 $ 18,000,819 $ 20,276,375 $ 20,162,487
4060 Daily Cost $ 1,093,125 $ 964,972 $ 911,474 $ 905,355 $ 914,155 $ 920,330 $ 929,038 $ 960,520 $ 991,506 $ 1,002,273
4060 Total $ 25,141,886 $ 20,264,410 $ 20,052,420 $ 19,917,815 $ 19,197,258 $ 21,167,582 $ 19,509,808 $ 19,210,390 $ 22,804,635 $ 22,049,997
Parent Fees Daily $ 290,190 $ 264,420 $ 240,784 $ 238,394 $ 242,021 $ 244,593 $ 249,058 $ 260,253 $ 269,690 $ 271,912
Parent Fee Total $ 6,674,369 $ 5,552,830 $ 5,297,243 $ 5,244,670 $ 5,082,441 $ 5,625,644 $ 5,230,210 $ 5,205,055 $ 6,202,871 $ 5,982,066
Total Monthly Cost $ 61,007,414 $ 48,383,988 $ 48,606,224 $ 46,913,863 $ 44,556,368 $ 48,414,837 $ 43,834,216 $ 42,416,264 $ 49,283,881 $ 48,194,550
41Income Eligible Utilization – Voucher Detail
Voucher Current Percent Current
CCRR Difference
Allocation Placements Utilized Waitlist
Child Care Choices of Boston (Boston) 3,374 2,473 901 73.30% 1,943
Child Care Circuit (Northeast) 6,274 5,258 1,016 83.81% 3,105
Child Care Network (Cape & The Islands) 1,114 855 259 76.75% 484
Child Care Resources (Central) 2,602 2,059 543 79.13% 1,175
Community Care for Kids/QCAP (Metro) 1,743 1,164 579 66.78% 832
New England Farm Workers (Western) 3,092 2,367 725 76.55% 1,974
PACE Child Care Works (Southeast) 3,466 3,025 441 87.28% 1,967
Total: 21,665 17,201 4,464 79.40% 11,480
Source:
- Voucher information based on CCRR weekly report for the week ending 5/29/2021.
- Waitlist information based on active children as of 6/2/2021
42Income Eligible Utilization – Contract Detail
Slots Flex Slots Total Slots Percent Current
Region Program Type Description Slots Used Slots Open*
Awarded Used Used Utilized Waitlist
GSA - Infant to Pre-School 1,081 652 13 665 416 61.52% 1,130
1 GSA - School Age 593 283 25.5 308.5 284.5 52.02% 844
FCC - All Ages 295 232.5 72 304.5 103.22%
Region Totals 1,969 1,167.5 110.5 1,278 700.5 64.91% 1,974
GSA - Infant to Pre-School 483 393 40 433 50 89.65% 574
2 GSA - School Age 349 300.5 6 306.5 42.5 87.82% 303
FCC - All Ages 562 523.5 138.5 662 117.79%
Region Totals 1,394 1,217 184.5 1,401.5 92.5 100.54% 877
GSA - Infant to Pre-School 1,122 880 54 934 188 83.24% 2,046
3 GSA - School Age 901 751.5 33 784.5 116.5 87.07% 1,022
FCC - All Ages 748 709 234 943 126.07%
Region Totals 2,771 2,340.5 321 2,661.5 304.5 96.05% 3,068
GSA - Infant to Pre-School 601 367.5 19 386.5 214.5 64.31% 978
4 GSA - School Age 535 293.5 30 323.5 211.5 60.47% 483
FCC - All Ages 423 379.5 54 433.5 102.48%
Region Totals 1,559 1,040.5 103 1,143.5 426 73.35% 1,461
GSA - Infant to Pre-School 1,175 710.5 70 780.5 394.5 66.43% 1,481
5 GSA - School Age 925 526.5 7 533.5 391.5 57.68% 908
FCC - All Ages 451 360 0 360 91 79.82%
Region Totals 2,551 1,597 77 1,674 877 65.62% 2,389
GSA - Infant to Pre-School 1,923 925.5 52 977.5 945.5 50.83% 1,114
6 GSA - School Age 716 442 44 486 230 67.88% 597
FCC - All Ages 795 747.5 101.5 849 106.79%
Region Totals 3,434 2,115 197.5 2,312.5 1,175.5 67.34% 1,711
GSA - Infant to Pre-School Total 6,385 3,928.5 248 4,176.5 2,208.5 65.41% 7,323
GSA - School Age Total 4,019 2,597 145.5 2,742.5 1,276.5 68.24% 4,157
FCC - All Ages Total 3,274 2,952 600 3,552 91 108.49%
Grand Total 13,678 9,477.5 993.5 10,471 3,576 76.55% 11,480
* Negative values have been removed from the "Open Slot" column in three regions since they are caused by EEC's current policy of
unlimited flex and do not take away from the total number of slots still available.
Source:
- Contract information based on contract utilization on 6/1/2021; Waitlist information based on active children as of 6/2/2021. 43Income Eligible Utilization – Waitlist Detail
Region Infant Toddler Preschool School Age Total
Region 1 - Western 271 416 443 844 1,974
Region 2 - Central 148 220 206 303 877
Region 3 - Northeast 702 678 666 1,022 3,068
Region 4 - Metro 234 360 384 483 1,461
Region 5 - Southeast 374 481 626 908 2,389
Region 6 - Boston 382 435 297 597 1,711
Total: 2,111 2,590 2,622 4,157 11,480
Source:
- Waitlist information based on active children as of 6/2/2021
44Income Eligible Utilization - Overview
Income Eligible Anticipated Current Percent
Child Care Placements Placements Difference Utilized
Voucher 21,665 17,201 4,464 79.4%
Contract 13,678 10,471 3,207 76.6%
Total 35,343 27,672 7,671 78.3%
Source:
- Voucher information based on CCRR weekly report for week ending 5/29/2021.
- Contract information based on contract utilization on 6/1/2021.
45You can also read