COUNTRY SUSTAINABILITY RANKING - Update - Summer 2021 Country Sustainability: Visibly harmed by Covid-19 - Robeco
←
→
Page content transcription
If your browser does not render page correctly, please read the page content below
For professional investors

COUNTRY
SUSTAINABILITY
RANKING
Update – Summer 2021
Country Sustainability: Visibly harmed by Covid-19
RobecoSAM
                                      For over 25 years, RobecoSAM has been at the forefront of sustainable investing. Today, it is Robeco’s
                                      sustainability ingredient brand, used to designate selected SI intelligence and research.

                                      RobecoSAM-labelled strategies guarantee a state-of-the-art impact approach. This is true of all our
                                      sustainable thematic strategies, but applies equally to our equity and fixed income impact strategies.
                                      All of these strategies have been designed to have a positive, measurable impact on the environment
                                      and society and to contribute to the UN’s 17 Sustainable Development Goals (SDGs).

                                      More than two decades of sustainable investing research have equipped us with the tools and the
                                      unique expertise needed to define financially-material ESG information, integrate it into a wide range
                                      of investment products, and measure its impact. RobecoSAM designates Robeco’s range of rankings
                                      of both companies and countries in terms of their sustainability to help investors make responsible
                                      choices.

                              About this report

                              This semi-annual report provides a succinct summary and analysis of the environmental, social, and governance
                              (ESG) profiles of 150 countries around the globe. It builds on the results of the proprietary Robeco Country
                              Sustainability Ranking (CSR) tool which collects and analyzes the relevant ESG data via a structured and
                              comprehensive framework to calculate an overall country score.

                              The resulting scores offer insights into the investment risks and opportunities associated with each country and
                              provide investors with a better frame of reference for making comparisons among countries and regions from a risk/
                              return perspective.

                              The summary outlined here complements findings gained from a more traditional country risk assessment and is
                              particularly focused on integrating long-term perspectives. Please see the Appendix for further details regarding
                              data indicators and methodology.

                              For a brief methodology overview or to request more comprehensive information, please visit https://www.robeco.
                              com/en/key-strengths/sustainable-investing/country-ranking/

                              Author’s note: ESG data contained in this report is as of April 2021, unless otherwise indicated. Commentaries,
                              summaries and analyses are as of August 6, 2021.

2 | Country Sustainability: Visibly harmed by Covid-19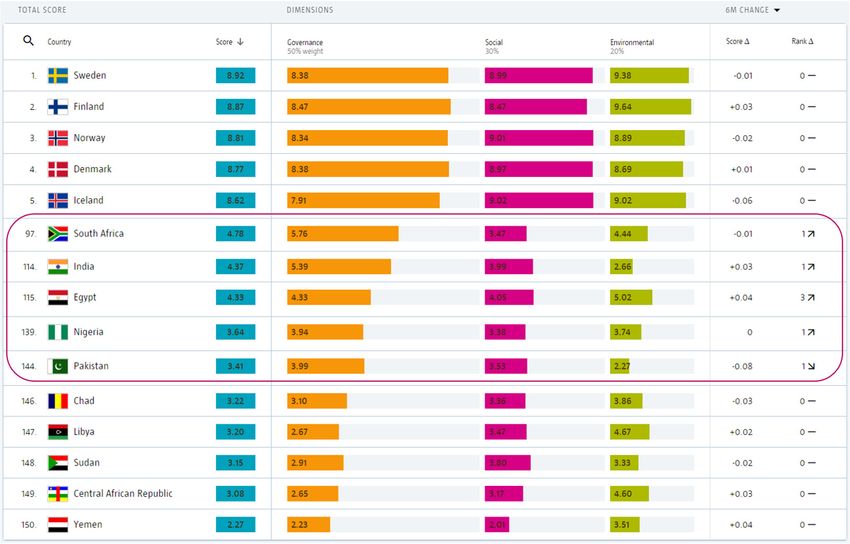
Contents

ESG Scores in context                                                                                                            4
  Covid-19’s adverse impact on country sustainability becomes increasingly apparent                                              4

Global results and analysis                                                                                                      5
  Scandinavian countries consolidate their leading positions                                                                     5
  North-South divide                                                                                                             7
  Movers and shakers                                                                                                             8

Special country reports		                                                                                                      10
  Colombia’s mass protests: illustration of a deep social crisis                                                               10
  South Africa: recent riots as a result of the country’s continuing struggles                                                 11
  Australia: standing out as a climate policy laggard                                                                          12
  Swiss voters reject climate change law                                                                                       15

Proprietary rankings vs independent benchmarks                                                                                 16
  A valid measure for progress on SDG achievements                                                                             16
  Elite quality of countries closely linked to governance structure                                                            17
  Country sustainability profile – a good yardstick for country resilience                                                     18

Appendix A: Country sustainability framework                                                                                   20
Appendix B: Data sources                                                                                                       21

                                                                             Country Sustainability: Visibly harmed by Covid-19 | 3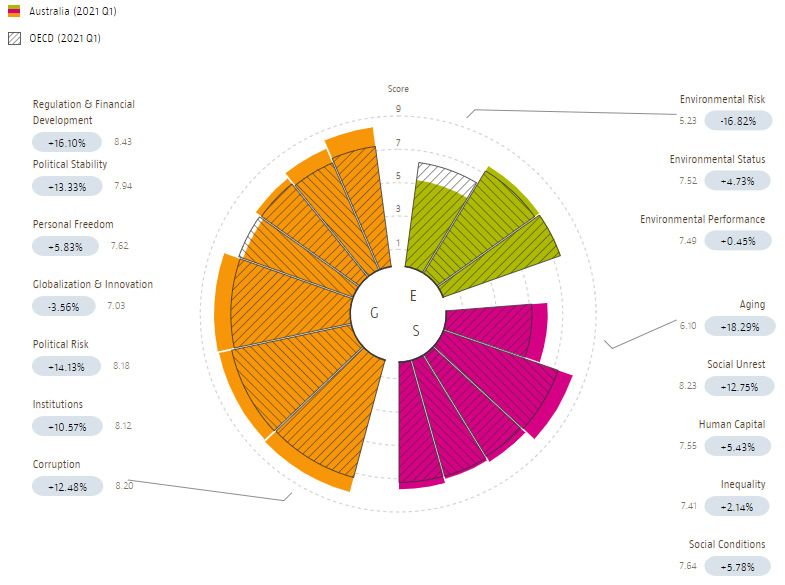
ESG Scores in context

                              Covid-19’s adverse impact on country                                      years to come. It is true that after emissions had risen
                              sustainability becomes increasingly                                       steadily for decades, the Covid-19 crisis triggered the
                              apparent                                                                  largest annual drop in global greenhouse gas emissions
                              With Covid-19 still raging in many parts of the world, and                in 2020 as the pandemic paralyzed economic and social
                              the magnitude of its effects will not be fully known for                  activities. According to the IEA, global energy-related
                              some time. At this stage it is obvious that the pandemic                  CO2 emissions fell by 5.8%, the largest percentage
                              has already had a very severe impact in a wide range                      decline since World War II.3
                              of areas, reversing years of progress on poverty
                              reduction and other areas of human development. It                        However, this temporary slowdown does not yet
                              has revealed and worsened some enduring fault lines                       indicate a turnaround with regards to climate change,
                              such as extreme inequality, underlying disparities in                     as the level of emissions has already started to rise
                              health care, education, and social welfare, as well as                    again with the economic recovery. More importantly,
                              simmering social and political tensions. While advanced                   recent extreme weather events such as the flooding
                              economies have been able to mitigate the dire                             in Central China and Western Europe, heatwaves and
                              economic consequences by massive fiscal support and                       widespread wildfires in South-Eastern Europe, Turkey,
                              monetary stimulus, less-developed nations did not have                    the West of the US and in Canada and Siberia, and the
                              the necessary financial means to shelter their citizens                   record drought in parts of Brazil, has all come as a stark
                              from the economic hardship in the same way.                               reminder that climate change has not disappeared but
                                                                                                        remains a deadly risk.
                              As a result, widespread discontent has bubbled up
                              and a wave of social unrest is sweeping around the                        Indeed, with a view to the COP26 event in Glasgow,
                              globe, from Brazil and Chile to Colombia and South                        2021 has seen some renewed efforts to combat
                              Africa, just to name but a few. This is outlined in the                   climate change. On July 14, the EU unveiled its most
                              country samples on Colombia and South Africa further                      ambitious plan yet to fight global warming with a series
                              down this report. In view of the ongoing Covid-19                         of legislative proposals aimed at achieving carbon
                              induced humanitarian and economic stress, increasing                      neutrality in the EU by 2050, with an intermediate
                              disparities and eroding social cohesion, there is a                       target of a 55% net reduction in greenhouse gas
                              significant likelihood that civil unrest and political                    emissions by 2030 compared to 1990’s levels. In the
                              instability will continue, with the resulting ramifications               US, the new Biden administration has brought about a
                              for the economic and country sustainability landscape.                    significant change in the government’s attitude towards
                              This would also be in line with the findings of recent IMF                the environment and climate change, including the
                              research, according to which past pandemics have led                      decision to rejoin the Paris Agreement and a pledge to
                              to an increase in social unrest and adverse effects on                    achieve the net-zero emissions target by 2050. Yet, the
                              economic activity.1,2                                                     implementation of tangible climate policies remains
                                                                                                        very challenging as visible from the negative vote on
                              Apart from inequality, pandemics, social unrest and                       a new CO2 law in Switzerland, or the wait-and-see
                              political instability, climate change is another key ESG                  attitude of policymakers in Australia, both of which are
                              factor that will shape the global risk landscape over the                 described in more detail below.

                              1.	Metodij Hadzi-Vaskov, Samuel Pienknagura and Luca Antonio Ricci: The Macroeconomic Impact of Social Unrest. IMF Working Paper 21/135, May 2021.
                              2.	Tahsin Saadi Sedik and Rui Xu: SA Vicious Cycle: How Pandemics Lead to Economic Despair and Social Unrest. IMF Working Paper 20/216, October 2020.
                              3. IEA: Global Energy Review: CO2 emissions in 2020. Understanding the impacts of COVID-19 on global CO2 emissions. IEA Article, 2 March 2021.

4 | Country Sustainability: Visibly harmed by Covid-19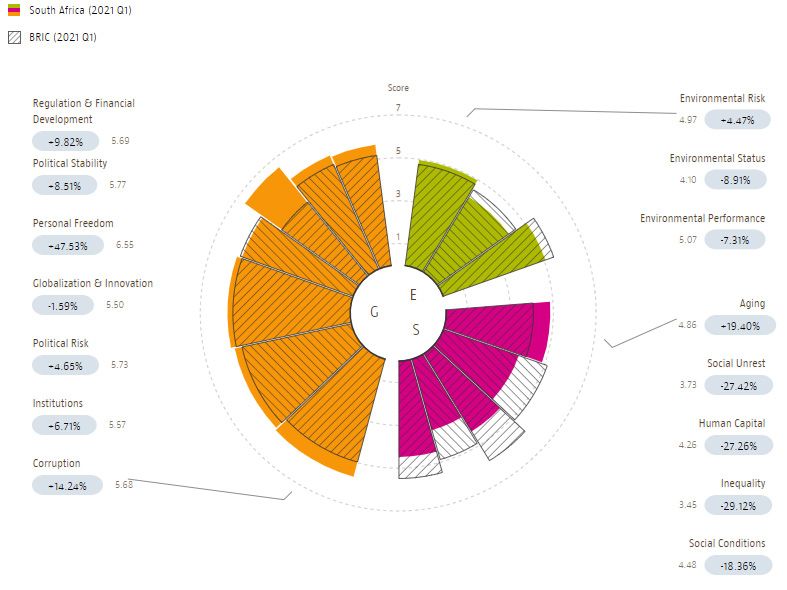
Global results and analysis
Scandinavian countries consolidate their income developing economies, except for Iraq and
leading positions Libya (classified as upper-middle income economies)
In Spring 2021, the Nordics continue to sustain their and Venezuela (temporarily unclassified due to the
sustainability leadership in the world. Attaining an ESG lack of revised national accounts statistics). Of the
score of 8.92 on a scale of 1 to 10 (best), Sweden tops 23 developed countries covered by our analysis, 20
the current Country Sustainability Ranking, just ahead belong to the two top-tier ESG categories (scores of 7.0
of its Nordic neighbours Finland, Norway, Denmark and or higher); only Greece, Italy and Spain are part of the
Iceland. Switzerland follows in sixth place with a score medium-performing category (scores between 6.0 and
0f 8.54, just ahead of New Zealand – the best-ranked 7.0).
country outside of Europe. The top-ranking group (with
an ESG score of 8.0 or higher) includes 13 countries, 10 A noticeable anomaly is the US, whose persistently
of which are located in Europe. Apart from New Zealand, disappointing sustainability performance during the
only Australia and Canada made it into the list of high- Trump presidency has caused it to drop out of the top
performing nations (see Figure 1). All these economies 20. From a score of 7.64 and rank of 18th at the start
enjoy robust and well-balanced sustainability profiles of the Trump administration, the country suffered a
across all three ESG dimensions and have displayed continuous decline in the score to 7.38 and rank 21st
continuously strong sustainability performance since the in April 2021, with a weakening performance in all
start of our country sustainability database in 2000. three ESG dimensions. Still, with the inauguration of
the Biden administration in January this year and the
At the other end of the ranking is the group of 22 change in direction in various policy areas, there is a
countries with scores below 4.0. All are emerging reasonable chance for this decline to come to a halt, or
markets and belong to the low- and lower-middle even be reversed over time.
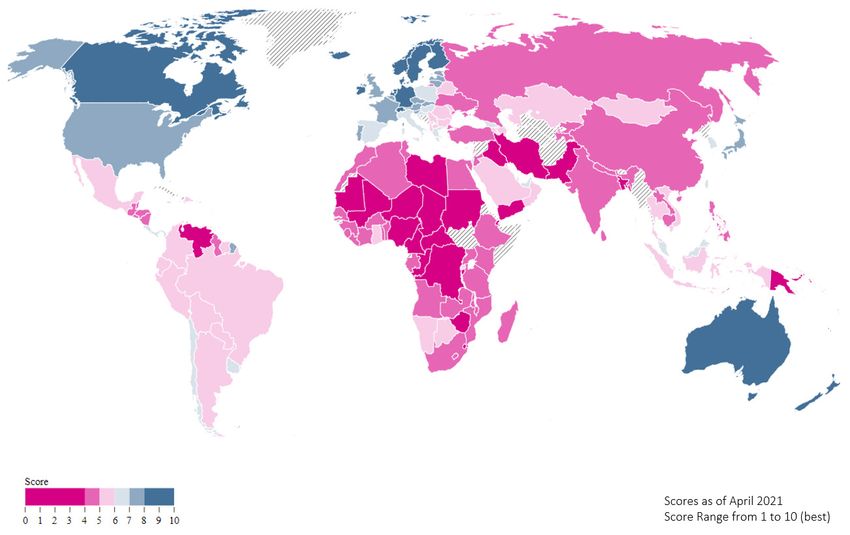
Figure 1 | The global country sustainability ranking map
Source: Robeco
Country Sustainability: Visibly harmed by Covid-19 | 5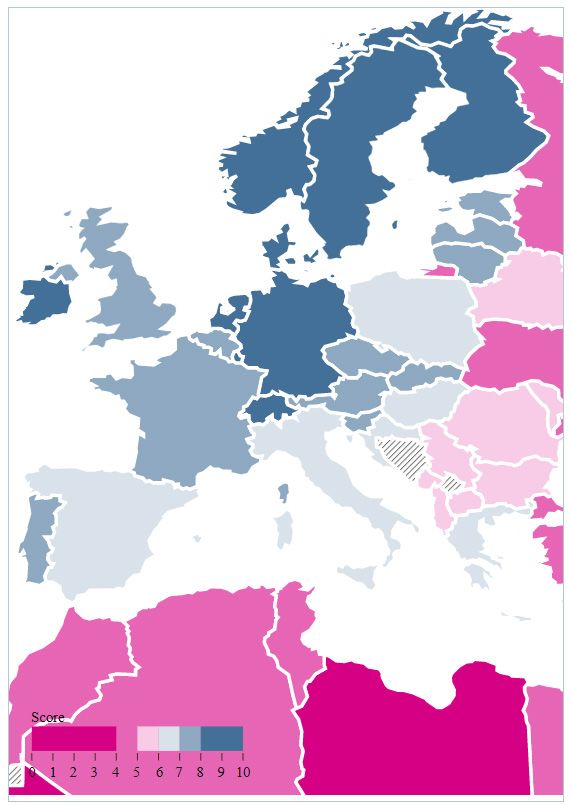
Singapore maintained its strong position as a leading                                     7.0 and 8.0). Apart from Singapore and Hong Kong,
                                   emerging market country with an ESG score of 7.93 and                                     they are all located in Europe. BRICS and other emerging
                                   a rank of 15th overall, ahead of European peers Estonia,                                  heavyweights, such as Indonesia and Mexico, continue
                                   the Czech Republic and Lithuania. Out of the group of                                     to display disappointing sustainability performance,
                                   127 emerging and developing economies, only nine                                          especially considering their economic potential.4
                                   made it into the second-best category (scores between

Figure 2 | Top five and bottom five sustainability performers

Data source: Robeco
Data note: Country sustainability scores of April 2021; the five countries framed in the middle of the chart designate the bottom-five ranked emerging market countries within the investable universe among the
top-50 economies in terms of nominal GDP.

                                   Figure 2 displays the wide sustainability performance                                     considering the investable universe (defined as the
                                   contrast between those at the top and bottom of                                           top 50 economies in terms of nominal GDP in which
                                   the ranking. The countries that make up the bottom                                        one can invest). Unsurprisingly, the names at the end
                                   depends on which universe is being counted. The                                           of the 150 countries ranking all involve highly fragile
                                   fully assessed universe is composed of 150 countries.                                     and dysfunctional states in Africa and civil war-affected
                                   South Africa, India, Egypt, Nigeria and Pakistan                                          Yemen on the Arabian Peninsula.
                                   make up the lowest-performing countries when only

                                   4.	Brazil, Russia, India, China & South Africa.

6 | Country Sustainability: Visibly harmed by Covid-19
North-South divide Figure 3 | Sustainability ranking in Europe
The sustainability landscape in Europe displays a
distinct North-South divide, with Northern and Central
European economies clustered at the top of the ranking
while Southern European peripheral countries reveal
more mediocre sustainability scores.
In addition, the map reveals a gap between the Western
and Eastern parts of the continent, with Eastern
European countries grouped mostly in the middle ESG
categories. At the bottom lie the worst performers
comprised mostly of the Balkan nations.
Figure 4 displays the score attribution to each of
the three dimensions (E, S & G) for select European
Government Bond (EGB) economies.5 As can be seen,
attributions for each ESG dimension differ from country
to country. For example, Finland tops the environmental
dimension, Norway the social and Switzerland the
governance. The final sustainability country score and
rank aggregates a country’s performance across all
three dimensions. Source: Robeco. Scores as of April 2021.
Figure 4 | Selected European economies: ESG score attributions
Sweden
Finland
Norway
Denmark
Switzerland
Luxembourg
Netherlands
Germany
Ireland
Austria
United Kingdom
France
Belgium
Portugal
Spain Environmental
Social
Italy Governance
1,0 2,0 3,0 4,0 5,0 6,0 7,0 8,0 9,0
Country ESG Score (1-10; 10=best); as of April 2021
Source: Robeco
5. European Government Bond (EGB) countries consist of the 16 countries included in the S&P ESG Pan-Europe Developed Sovereign Bond Index. They
include Denmark, Norway, Sweden, Switzerland, the UK and developed countries in the Eurozone.
Country Sustainability: Visibly harmed by Covid-19 | 7Movers and shakers Among the positive movers, Ukraine (+0.23) and
Figure 5 shows the countries with the biggest gains or Nepal (+0.49) have outwitted the respective winners
losses in ESG scores over the preceding one-year and among the investable universe over the short- to
three-year observation periods. As in Figure 2, the graph medium terms. In the case of Ukraine this is largely
does not cover all countries, but is limited to a universe because of improved assessments for political risk,
of large investable economies in terms of nominal GDP. political stability and social unrest. In the case of Nepal,
Hong Kong heads the ranking of the biggest losers it is mainly because of improvements in political risk,
also for the entire 150-country universe, largely due to political stability, social conditions and environmental
China’s increasing interference in the territory and the performance. However, irrespective of the progress
implementation of the national security law last year. made, both countries remain poorly ranked – Ukraine is
87th and Nepal 104th.
Except for the US and the UK, the countries exhibiting
the largest losses are primarily emerging market Amid the winners, Greece stands out with the best
economies which have repeatedly generated negative performance over both observation periods, primarily
headlines. More detailed analysis of noteworthy the result of the structural reforms undertaken in the
sustainable developments in the US, Hong Kong and aftermath of the 2009 financial crisis. A more specific
Turkey have already been outlined in the last Country summary of Greece’s sustainability performance can
Sustainability Ranking Update published in January this also be found in the last CSR Update. Modest gains
year.6 over the past year have also been recorded by Italy,
which could benefit from some easing of tensions in
The Philippines has unfortunately suffered a setback the political risk and social unrest spheres, next to an
during the past year, eroding much of the gains improvement on the regulatory front.
achieved previously. Natural disasters and the pandemic
and the resulting economic hardship were the main It might be somewhat surprising that Saudi Arabia
triggers for a deterioration in political risk, social unrest appears on the winners list as well. The Saudi Kingdom’s
and environmental performance. Argentina has seen improved standing stems from an increase in the
its ESG score decline during the past year, primarily retirement age for women, which positively impacted
because of a deterioration in political risk, stability and gender equality and aging indicators, as well as some
social unrest, all of which are strongly related to the other tenuous reforms for day-to-day life. This should
persistent economic hardship that has been aggravated not obscure the fact that the country does still display
by the Covid-19 crisis. grave deficiencies in terms of inequality, personal
freedom and human rights.
The decline of the ESG score in Pakistan is the result
of small declines in various governance and social In addition, three East Asian nations have shown a solid
criteria, with social unrest showing the most notable ESG performance in the past three years: Vietnam,
deterioration. Ranked 144th, Pakistan remains the Taiwan and the Philippines. Vietnam has displayed
lowest-ranked country among the investable universe. some improvements in political risk and social unrest,
Indonesia has seen a deterioration in aging, social as well as in the regulatory domain. In Taiwan, the
conditions, and political risk in more recent years, biggest advances were recorded in governance, above
wiping out some of the gains made in all three ESG all in corruption and globalization and innovation, as
dimensions in previous periods. Looking further back, well as scores regarding human capital. These advances
the country reveals still displays a slightly higher ESG outweighed declines observed in the scores for the
score (5.11) than five or then years ago (4.99 and 4.89 inequality and environmental performance criteria.
respectively), even though the overall performance
remains rather disappointing when put in the context
of the country’s huge economic and human capital
potential.
6. Robeco: Country Sustainability Ranking Update – Winter 2021: Sweden defends its lead, January 2021
8 | Country Sustainability: Visibly harmed by Covid-19Figure 5 | Largest gains and losses in ESG scores
Hong Kong
Philippines
1-year score
Argentina
deterioration
Pakistan
United Kingdom
Saudi Arabia
Italy
1-year score
UAE
improvement
Romania
Greece
-0.60 -0.50 -0.40 -0.30 -0.20 -0.10 0.00 0.10 0.20 0.30
Hong Kong
Indonesia
3-year score
United States deterioration
Turkey
United Kingdom
Philippines
Taiwan
3-year score
Vietnam
improvement
Saudi Arabia
Greece
-0.60 -0.50 -0.40 -0.30 -0.20 -0.10 0.00 0.10 0.20 0.30
Data source: Robeco; data assessed as of April 2021
Data note: The chart displays the largest score gains and losses for countries within the investable universe among the top-50 economies in terms of nominal GDP.
Among the winners over the one-year period, one finds best-ranked Gulf Co-operation Council (GCC) country.
the United Arab Emirates and Romania. The UAE has Last but not least, Romania owes its improvement in
benefitted from a higher score for inequality thanks to the overall score primarily to a better performance in
an improved assessment in the Women, Business & all three environmental criteria, in political risk and
Law Index, economic globalization and environmental inequality, whereas the country has not suffered any
performance, helping it to consolidate its position as the noticeable declines in other ESG aspect.
Country Sustainability: Visibly harmed by Covid-19 | 9Special country reports
Colombia’s mass protests: an illustration of a The root cause for this wave of violent unrest is to
deep social crisis be found in some long-standing social and political
Colombia has been ravaged by recurrent violent anti- grievances, such as the pronounced inequality in income
government protests since April this year, triggered by and wealth, the lack of economic and educational
a controversial tax reform proposed by the government opportunities, and continued threats by criminals
of Iván Duque. The bill – set up to redistribute money and local insurgents. Much of this is not new: politics
to the poor, partly by scrapping VAT exemptions – has in Colombia was strongly constrained by the armed
widely been perceived as increasing the tax burden for conflict between the government and FARC rebels for
much of the population, which was already struggling many years. But even after the 2016 peace accord, the
with the economic impact of Covid-19. political leadership did not do enough to address these
structural problems.
The original plan was withdrawn, and a new milder
version of the tax reform was unveiled on July 20, but As a result, Colombia still reveals much weaker political
the protests resumed as it was seen as inadequate stability and inequality scores relative to the emerging
for boosting spending on education, health care and markets average (see Figure 6), and these two factors
job creation. The demonstrators are also calling for are weighing heavily on the country’s overall ESG score.
police reform and more social justice in the face of Moreover, political instability and inequality have
the pandemic, which has caused a sharp economic worsened further during the pandemic, and are having
contraction of roughly 7% and pushed an additional 3 a negative influence on each other, which is also evident
million people into poverty. Sovereign creditworthiness from Figure 7. Colombia displays one of the highest
has not remained unaffected by the events, as income inequalities worldwide and has a poor political
Colombia’s sovereign credit rating was downgraded to stability score in the Worldwide Governance Indicators,
junk status (BB+) by both, S&P on May 20 and Fitch on indicating an urgent need for policymakers to tackle
July 20, due to the failure of the original tax reform and these issues to improve stability and reduce social
a lower chance of structural fiscal adjustment. unrest.
Figure 6 | Colombia’s pronounced deficiencies in inequality and political stability
Country ESG Scorecard
Total ESG Score -7.21%
Governance -8.73%
50% weight
Social -9.85%
30% weight
Environmental +2.16%
20% weight
Political stability -22.24%
5%
Inequality -28.51%
5%
0 1 2 3 4 5 6 7 8 9 10
Colombia (2021 Q1)
Emerging Market (2021 Q1) Emerging Market peer group includes 52 countires
Data source: Robeco
10 | Country Sustainability: Visibly harmed by Covid-19Figure 7 | Inequality tends to be correlated with higher political instability
1.75
1.50
1.25
1.00
GINI Coefficient & Political Stability Score
0.75
0.50
0.25
0.00
-0.25
-0.50
-0.75
-1.00
-1.25
Political Stability Score as of 2019 & GINI data as of 2018 or latest
-1.50
ISL
NZL
LUX
CHE
NOR
PRT
AUS
SWE
JPN
CAN
AUT
IRL
CZE
FIN
NLD
LTU
SVN
HUN
EST
DEU
BGR
ROU
POL
GBR
BEL
KOR
ITA
CRI
LVA
ESP
FRA
USA
GRC
CHL
ZAF
CHN
RUS
BRA
IND
MEX
ISR
COL
TUR
DNK
SVK
Political Stability GINI Index
Data source: OECD, World Bank
Data note: The original GINI index from 0 (max. equality) to 1 (max. inequality) has been aligned to the -2.5 (worst) to +2.5 (best) scale of the Political Stability score for display reasons. So, the higher the score
the higher inequality.
South Africa: recent riots as a result of the -2.5 to +2.5) in the 2020 update of the Worldwide
country’s continuing struggles Governance Indicators, and a political risk score of 66.5
In July, South Africa witnessed the worst civil unrest (on a scale from 0–100) in June 2021 by PRS Group,
since the end of apartheid in the 1990s. The trigger the country was ranked above all of its BRICS peer
was the arrest of former president Jacob Zuma for countries regarding these two metrics, which are also
failing to attend an inquiry into corruption. However, incorporated in the governance dimension within our
the root causes for the riots are to been seen mainly country sustainability assessment.
in the widespread despair over striking inequalities,
joblessness, a lack of perspectives, rampant corruption, It is true that with the end of apartheid and the first
inadequate access to basic services and increasing full free elections in 1994, South Africa was one of the
hunger, all of which have been worsened by Covid-19. world’s shining example of democratization. Based on
The country had already seen an increasing number of fairly solid institutions, government effectiveness and a
protests before the pandemic. reliable legal system, the new ANC governments firstly
under Nelson Mandela and then initially under Thabo
It is perhaps then quite remarkable that even under Mbeki were able to move the country forward and to
these adverse circumstances, South Africa retains a preserve political stability under difficult economic and
fairly reasonable record on political stability. With social conditions. Towards the final phase of the Mbeki
a political stability score of -0.22 (on a scale from administration, however, and then at an accelerating
Country Sustainability: Visibly harmed by Covid-19 | 11pace under the presidency of Jacob Zuma from 2009, As a result, South Africa’s overall ESG score deteriorated
South Arica has been caught in a negative spiral. It from 5.25 in Q1/2009 to 4.78 in April 2021. Despite
has suffered increasing political struggles, growing this decline, the governance profile does still compare
corruption, institutional erosion and a weakening favourably with that of its BRICS peers, whereas the
economy, further aggravating the country’s deep-seated country displays major deficiencies in the social area,
troubles. This is a development that Zuma’s successor except for aging (see Figure 8). The developments in
Cyril Ramaphosa, who was elected as president in recent years indicate an increasing need for a change
December 2017, has not been able to decisively turn of trajectory to reverse the negative spiral of social and
around so far. political instability and avoid more severe impacts on
sovereign creditworthiness.
Figure 8 | Country ESG profile in comparison: South Africa vs other BRICS countries
Source: Robeco (data assessed as of April 2021)
Australia: standing out as a climate policy recognition of the adverse impact of climate change
laggard and an acceptance that these are likely to intensify,
In recent years, Australia has suffered more frequently the government is still reluctant to take appropriate
from extreme weather events such as bushfires, action, and so the country is falling further and further
droughts, heatwaves, cyclones, floods and storms, behind other developed economies regarding climate
indicating that the country is especially vulnerable performance.
to climate change. Even though there is increasing
12 | Country Sustainability: Visibly harmed by Covid-19Australia is the biggest per-capita CO2 emitter within A recently released report from the Climate Council
the OECD and is also far above the OECD average in finds that the cost of extreme weather has more than
terms of energy use (see Figures 9 & 10). It hasn’t doubled since the 1970s and amounted to AUD 35
yet set a net-zero target and trails its peers with a billion over the past decade. By 2038, these costs could
greenhouse gas reduction target of between 26% and increase to even AUD 100 billion every year.7
28% by 2030. So, it is hardly surprising that Australia
has received the lowest score awarded to any of the Additional pressure might also be exerted from a
193 UN members for the level of climate action (SDG growing number of foreign investors that pledge to
13) in the latest Sustainable Development Report. ⁷ This shift money away from countries that are climate
indicates that the federal government must do more to laggards, given that half of the country’s AUD 881
combat climate change, although state governments billion in government bonds were foreign owned at the
have started to reform their economies to curb carbon end of March 2021, according to the Australian Office
emissions, which should help to reduce the nation’s of Financial Management. As Australia’s wider ESG
emissions to some extent going forward. profile including other environmental as well as social
and governance features still compares favorably with
The economy is heavily dependent on fossil fuels and those of its OECD peers (see Figure 11), the country can
is one of the world’s biggest exporters of coal, which still rely on a sufficiently broad foreign investor base.
might explain the government’s unwillingness to But this could change over time with ever-growing
implement more tangible measures. However, the cost consciousness of climate risks and mounting regulatory
of inaction is likely to increase in the coming years. requirements.
Figure 9 | CO2 emissions & energy use trends: Australia is lagging behind
280 20.0
260 17.5
CO2 Emission (in t CO2/cap/yr - bars/LHS)
Energy Intensity (MMBtu/cap - lines/LHS)
240 15.0
220 12.5
200 10.0
180 7.5
160 5.0
140 2.5
120 0.0
1997
1998
1999
2000
2001
2002
2003
2004
2005
2006
2007
2008
2009
2010
2011
2012
2013
2014
2015
2016
2017
2018
2019
Australia Switzerland OECD (38) Australia Switzerland OECD (38)
Source: EDGAR, US Energy Information Administration
7. Climate Council of Australia: Hitting Home: The Compounding Costs Of Climate Inaction, 2021
Country Sustainability: Visibly harmed by Covid-19 | 13Figure 10 | CO2 emissions & energy use trends: Australia is lagging behind
18 360
16 320
14 280
12 240
10 200
8 160
6 120
4 80
2 40
0 0
Australia OECD (38) Switzerland Australia OECD (38) Switzerland
Energy Intensity/GPD (1000Btu/2015$ GDP PPP) Energy Intensity/Capita (MMBtu/head)
Fossil CO2/capita (t CO2/cap/yr) Fossil CO2/GDP (kg CO2/kUSD/yr)
Source: EDGAR, U.S. Energy Information Administration
Figure 11 | Australia’s overall ESG profile is still superior to the OECD average
Source: Robeco (data assessed as of April 2021)
14 | Country Sustainability: Visibly harmed by Covid-19Swiss voters reject climate change law The vote on the CO2 law was part of a trio of
Switzerland’s policy on fighting climate change received environmental proposals. It came with an initiative that
a severe blow after a narrow majority of 51.6% of aimed to ban artificial pesticides and another one that
voters rejected a proposed CO2 law in a referendum aimed to better protect biodiversity and Swiss drinking
on June 13. The law to curb greenhouse gases was the water. Both initiatives were voted down as well by
result of a broad compromise and intense debates in 61%, as most Swiss farmers warned about the adverse
parliament and had won the support of all political impacts for agriculture, food prices and self-sufficiency
parties except for the right-wing People’s Party. The in many foods. Even though the rejections do not
CO2 law envisioned various measures on a ‘polluter simply signify that the Swiss are unconcerned about
pays’ principle, including increased taxes on car fuel environmental issues, they nevertheless illustrate the
and air tickets, as well as actions to curb industrial difficulties that governments have in gaining popular
emissions and efforts to improve the energy efficiency support for the implementation of tangible measures
of buildings. The defeat resulted from a combination to protect the climate and the environment when their
of various factors, including disinformation and fears long-term and less graspable benefits are weighed up
about rising living costs, and comes at a time when against the more immediate concerns about rising costs
people are already burdened by Covid-19. and fears of limitations in everyday life.
The government will now seek to extend With a score of 8.06, Switzerland is clearly lagging
uncontroversial climate protection measures and the ESG leaders in the ranking for the environmental
make fresh efforts to forge a new consensus on climate dimension, which is led by Finland with a score of 9.64.
policies. However, the rejection will make it certainly However, in comparison with the average sustainability
much harder for Switzerland to reach its 2030 goal score of the Eurozone as a peer group, Switzerland still
of cutting carbon emissions by 50% from their 1990 reveals a stronger score in all three ESG dimensions (see
levels and to become net neutral on emissions by 2050. Figure 12). It is also apparent though that it is mainly
Still, past, and current climate protection efforts have the strong performance in the social and governance
allowed a reduction of per-capita CO2 emissions by 27% spheres that catapult Switzerland it into the top ranks
and energy use per head by 20% since the adoption of overall.
the Kyoto Protocol in 1997 (see Figure 9). With regards
to both measures, as well as energy intensity/GDP and
CO2 emissions/GDP, Switzerland ranks below the OECD
average as visible in Figure 10).
Figure 12 | Switzerland’s ESG profile relative to the Eurozone average
Country ESG Scorecard
Total ESG Score +14.44%
Governance +15.62%
50% weight
Social +14.64%
30% weight
Environmental +8.63%
20% weight
0 1 2 3 4 5 6 7 8 9 10
Switzerland (2021 Q1)
EMU (2021 Q1) European Economic and Monetary Union includes 19 countries
Source: EDGAR, US Energy Information Administration
Country Sustainability: Visibly harmed by Covid-19 | 15Proprietary rankings vs independent benchmarks
A valid measure for progress on SDG The relationship between the outcomes of the country
achievements SDG index and Robeco’s CSR can be observed in Figure
The Robeco April 2021 Country Sustainability Ranking is 13. The strong correlation suggests that there are no
closely and positively correlated to the 2021 Sustainable inherent conflicts or fundamental trade-offs between
Development Goals (SDG) index (correlation coefficient a country’s commitment to the SDGs and the need to
r=0.829; see Figure 13). The SDG index was created strengthen its sustainability profile in the pursuit of
by the Bertelsmann Stiftung and the United Nations sustainability. It seems therefore obvious that countries
Sustainable Development Solutions Network in doing well on achieving the SDGs are, in general, also
response to the 17 SDGs launched by the UN in 2015. performing well in terms of country sustainability, as
The index serves as a tool to help countries identify related actions often point in the same direction.
national priorities and track SDG achievements. The
2021 SDG index ranking covers 166 countries and is Moreover, it is no surprise that lower-income countries
led by Finland, which has pushed Sweden from the top tend to have lower SDG index scores as well as weaker
position, followed by Denmark and Germany. Chad, country sustainability profiles, as they usually lack
South Sudan and Central African Republic still round out adequate institutions, distributional mechanisms,
the bottom of the index.8 and the financial means to forcefully address severe
environmental threats or improve their precarious social
conditions.
Figure 13 | Country ESG scores: a good indicator for progress on SDGs
9.0
NOR
FIN
Average of this 147 Country Universe ESG Leaders CHE
CAN NLD SWE
8.0
SGP AUS GBR
DEU
JPN
Country Sustainability Score (1-10; 10 = best)
ARE
USA FRA
7.0
ITA ESP
COL POL
6.0 SAU MEX CHL
IDN ARG
TZA BRA
5.0
RUS
ZAF CHN
4.0
IND TUR
NGA EGY
TCD
VEN IRN
CAF SDN PAK
3.0
ESG Laggards
YEM
2.0
30.0 40.0 50.0 60.0 70.0 80.0 90.0
Country SDG Index (0-100; 100 = best)
Data Source: Sachs, J., Kroll, C., Lafortune, G., Fuller, G., Woelm, F. (2021). The Decade of Action for the Sustainable Development Goals: Sustainable Development Report 2021. Cambridge: Cambridge
University Press; Robeco
Data note: SDG index scores are of June 2021. The Robeco Country Sustainability Ranking is of April 2021.
8. Sachs, J., Kroll, C., Lafortune, G., Fuller, G., Woelm, F. (2021). The Decade of Action for the Sustainable Development Goals: Sustainable Development
Report 2021. Cambridge: Cambridge University Press. DOI 10.1017/9781009106559
16 | Country Sustainability: Visibly harmed by Covid-19The correlation between the two frameworks is, in 2020 and seeks to measure the way in which elites
however, far from perfect. For some countries, such globally contribute to the economic, human, and
as South Africa, Italy and Spain, the progress made political development of their countries. The 2021 index
towards the SDGs appears quite in line with their covers 151 countries and examines the quality of elites
respective sustainability performance, as indicated across the four areas of economic power, economic
by their positions on the trend line in Figure 11. Other value, political power and political value. The ranking is
countries, such as China and Russia, display a country headed by Singapore, ahead of Switzerland, the United
SDG index score that is higher relative to their ESG score. Kingdom and the Netherlands. At the other extreme are
In other cases, the SDG achievements of Singapore – unsurprisingly – Yemen, Sudan and Libya.9
and Canada appear to be lagging sustainability
performance. These deviations can largely be explained The close correlation between the EQx2021 and our
by differences in focus, the selection of indicators and Country Sustainability Ranking is hardly surprising as
their weightings. Governance indicators have a much the quality of elites is also reflected in the strengths
higher weighting in our tool, whereas in the SDG index or weaknesses of a country’s institutional framework
all 17 SDGs are equally weighted. and governance structures, which are core elements
of our CSR. And, as it is well known from the economic
Elite quality of countries closely linked to literature and relevant research, good governance is a
governance structures vital prerequisite for economic prosperity and human
The governance dimension score of the Robeco April development. Good governance is making sure that
2021 Country Sustainability Ranking is closely interlinked the resources of a country are being managed in a way
with the 2021 Elite Quality Index, as can be seen from that allows all citizens of a country to benefit adequately
the highly positive correlation (correlation coefficient from an improving quality of life. In the top positions of
r=0.882; see Figure 14). The Elite Quality Index the EQx2021 ranking are therefore countries that are
(EQx2021) is a novel economic ranking of countries distinguishable by their strong and efficient institutions,
that has been developed by the University of St. Gallen a low level of corruption, a reliable legal system and
and Singapore Management University along with political stability. The exact opposite is visible at the
international academic partners and the Foundation other end of the spectrum which contains several fragile
for Value Creation. It was published for the first time or even failed states.
9. Casas i Klett, T. & Cozzi, G. (2021). Elite Quality Report 2021: Country Scores and Global Rankings, Zurich
Country Sustainability: Visibly harmed by Covid-19 | 17Figure 14 | Country elite quality scores closely linked with governance quality
9.0
DNK SWE CHE
Average of this 140 Country Universe AUS
CAN NLD
8.0 DEU
SGP
FRA
POL JPN GBR
ESP
URY ITA USA
Governance Score (1-10; 10 = best)
7.0 KOR
BRA GRC HUN
ZAF COL
6.0 SAU Very High
IND Quality Elites
IDN THA
ARG CHN
5.0
EGY MEX
TUR PHL
4.0
IRN RUS
NGA
IRQ ZWE
3.0 LBY SDN
VEN
Lagging Elites YEM
2.0
20.0 25.0 30.0 35.0 40.0 45.0 50.0 55.0 60.0 65.0 70.0
Elite Quality Country Index (1-100; 100=highest)
Data Source: Casas i Klett, T. & Cozzi, G. (2021). Elite Quality Report 2021: Country Scores and Global Rankings, Zurich; Robeco
Data note: Country Elite Quality Index scores are of May 2021. The Robeco Country Sustainability Ranking is of April 2021.
Country sustainability profile – strongly and corporate governance. These are many of the
aligned with country resilience same factors assessed in Robeco’s country sustainability
With the devastating and interwoven impacts of the assessment model, which explains the similarity in
ongoing Covid-19 pandemic having become so obvious outcomes and the high positive correlation between
in manifold ways, it is clearly necessary to build more scores (0.83) as visible in Figure 15.
resilient countries. Such efforts must reach far beyond a
strengthening of public health systems and encompass Countries with high scores based on the Robeco Country
the broad ESG spectrum of a country. Sustainability Ranking also ranked high in terms of
resilience as measured by the FM Global Resilience
One interesting measure of robustness is FM Global’s Index 2021. While there are some notable exceptions,
2021 Country Resilience Index, an annual ranking of 130 this broad alignment is plausible, as countries with a
countries and territories according to their enterprise stronger ESG profile are usually also less vulnerable to
resilience to disruptive events.10 These can result from such disruptive events and/or are much better prepared
climate risk, health crises such as the current pandemic, to cope with their impacts.
or political turmoil. FM Global’s assessment tool
aggregates 12 drivers of resilience into three categories
– economic, risk quality and supply chains. Key
assessment elements include productivity, oil intensity,
political risk, exposure to natural hazards, corruption
10. FM Global: 2021 FM Global Resilience Index
18 | Country Sustainability: Visibly harmed by Covid-19Figure 15 | Country sustainability scores: a yardstick for a country’s resilience
9.0
Strong reslience SWE
NZL
& ESG profile CAN CHE
NLD DNK
8.0 EST AUS
Country Sustainability Score (1-10; 10 = best)
DEU
Average of this 123 Country Universe JPN FRA
SGP
PRT GBR
URY TWN HKG USA
7.0
CHL KOR ESP
ARG ITA
POL
MEX HRV HUN
MYS PER GRC
6.0
COL
GHA IDN BHR ROU
ECU SAU
BOL BRA
5.0 SEN
MAR CHN RUS ZAF
TUR NPL
GTM CIV PHL
MWI
ETH
DZA IND
4.0
VEN CMR NGA
IRN
MLI
Weak resilience & ESG profile ZWE
3.0
0.0 10.0 20.0 30.0 40.0 50.0 60.0 70.0 80.0 90.0 100.0
Country Resilience Score (0-100; 100 = best)
Data Source: FM Global, Robeco
Data note: FM Global Country Resilience Index Sovereign of 2021; RobecoSAM country sustainability scores of April 2021. FM Global is a mutual insurance company dedicated to property risk management and
protection.
Country Sustainability: Visibly harmed by Covid-19 | 19Appendix A: Country sustainability framework
Ongoing monitoring of the underlying data and data The framework captures a broad set of relevant
providers and maintenance of the methodology used to ESG factors with the ultimate aim of providing an
construct any model is an integral part of ensuring its assessment of whether a country’s development in the
accuracy, completeness and ongoing predictive power. E, S and G areas helps preserve a sovereign’s long-term
In the following pages, we provide our source data solvency.
as well as the framework in which it is weighted and
measured. The country sustainability assessment framework
currently covers a universe of 150 countries, 23 of which
The current methodological framework shown in Table are considered industrialized countries or advanced
1 comprises 40 indicators, which are combined into economies, and 127 emerging market and developing
15 criteria covering the three main ESG dimensions countries.
(environmental, social & governance).
Table 1 | Country elite quality scores closely linked with governance quality
Source: Robeco
20 | Country Sustainability: Visibly harmed by Covid-19Appendix B: Data sources
Environmental performance Yale University; Environmental Performance Index
https://epi.envirocenter.yale.edu/
World Energy Council/Oliver Wyman; Energy Trilemma Index
https://trilemma.worldenergy.org/
Environmental risk Bündnis Entwicklung Hilft; World Risk Index
https://entwicklung-hilft.de/
University of Notre Dame; ND-GAIN Index
https://www.nd.edu/Germanwatch; Global Climate Risk Index
https://germanwatch.org/en/cri
Environmental status Social Progress Imperative; Environment (Component of SPI)
https:// www.socialprogressindex.com/
Legatum Institute; Environmental Quality (Pillar of Prosperity Index)
https://www.prosperity.com/
Aging ILOSTAT; Labor Force Participation Rate 55-64
https://ilostat.ilo.org/
UN – Population Division; Old-Age Dependency Ratio
https://population.un.org/
WB – Women, Business & the Law; Retirement Age
https://wbl.worldbank.org/
Human capital Legatum Institute; Education (Pillar of Prosperity Index)
https://www.prosperity.com/
Legatum Institute; Health (Pillar of Prosperity Index)
https://www.prosperity.com/
Inequality Fund for Peace; Economic Inequality (Indicator of FSI)
http://fsi.fundforpeace.org/
UNDP – Human Development Reports; Gender Inequality Index
http://hdr.undp.org/
World Bank; World Development Indicators; GINI Coefficient
http://databank.worldbank.org/data/
OECD; Income Distribution Database; GINI Coefficient
http://www.oecd.org/
WB – Women, Business & the Law; Women, Business & the Law Index
https://wbl.worldbank.org/
Social conditions Social Progress Imperative; Basic Human Needs (Component of SPI)
https://www.socialprogressindex.com/
Global Child Forum/UNICEF; Children’s Rights in the Workplace Index
https://www.globalchildforum.org/
UNDP – Human Development Reports; Human Development Index
http://hdr.undp.org/
Social unrest Fund for Peace; Economic Decline & Poverty (Indicator of FSI)
http://fsi.fundforpeace.org/
Social Progress Imperative; Inclusiveness (Component of SPI)
https://www.socialprogressindex.com/
Legatum Institute; Safety & Security (Pillar of Prosperity Index)
https://www.prosperity.com/
Columbia University/SDSN; World Happiness Ranking
https://worldhappiness.report/ed/2019/
Country Sustainability: Visibly harmed by Covid-19 | 21Corruption Transparency International; Corruption Perception Index
https://www.transparency.org/
World Bank; Control of Corruption (Worldwide Governance Indicator)
https://info.worldbank.org/governance/wgi/#home
Globalization & innovation KOF/ETHZ; Economic Globalization (Dimension of Globalization Index)
https://kof.ethz.ch/
WIPO; Global Innovation Index
https://www.wipo.int/
Institutions World Bank; Government Effectiveness (Worldwide Governance Indicator)
https://info.worldbank.org/governance/wgi/#home
World Bank; Rule of Law (Worldwide Governance Indicator)
https://info.worldbank.org/governance/wgi/#home
Fund for Peace; State Legitimacy (Indicator of Fragile States Index)
http://fsi.fundforpeace.org/
Personal freedom Freedom House; Freedom in the World Index
https://freedomhouse.org/
Fund for Peace; Human Rights (Indicator of FSI)
http://fsi.fundforpeace.org/
World Bank; Voice and Accountability (Worldwide Governance Indicator)
https://info.worldbank.org/governance/wgi/#home
Political risk Euromoney Country Risk; Political Risk Assessment
http://www.euromoney.com/
PRS Group; Political Risk Rating
http://www.prsgroup.com/
Political stability Fund for Peace; External Intervention (Indicator of Fragile States Index)
http://fsi.fundforpeace.org/
World Bank; Political Stability and Absence of Violence (Worldwide Governance Indicator)
https://info.worldbank.org/governance/wgi/#home
Regulation & financial development IMF; Financial Development Index
https://data.imf.org/
Heritage Foundation; Index of Economic Freedom
https://www.heritage.org
World Bank; Regulatory Quality (Worldwide Governance Indicator)
https://info.worldbank.org/governance/wgi/#home
22 | Country Sustainability: Visibly harmed by Covid-19Important Information
Robeco Institutional Asset Management B.V. has a license as manager of Undertakings for Collective Investment in Transferable
Securities (UCITS) and Alternative Investment Funds (AIFs) (“Fund(s)”) from The Netherlands Authority for the Financial Markets in
Amsterdam. This marketing document is solely intended for professional investors, defined as investors qualifying as professional
clients, have requested to be treated as professional clients or are authorized to receive such information under any applicable laws.
Robeco Institutional Asset Management B.V and/or its related, affiliated, and subsidiary companies, (“Robeco”), will not be liable
for any damages arising out of the use of this document. Users of this information who provide investment services in the Europe-
an Union have their own responsibility to assess whether they are allowed to receive the information in accordance with MiFID II
regulations. To the extent this information qualifies as a reasonable and appropriate minor non-monetary benefit under MiFID II,
users that provide investment services in the European Union are responsible to comply with applicable recordkeeping and disclosure
requirements. The content of this document is based upon sources of information believed to be reliable and comes without war-
ranties of any kind. Without further explanation this document cannot be considered complete. Any opinions, estimates or forecasts
may be changed at any time without warning. If in doubt, please seek independent advice. It is intended to provide the professional
investor with general information on Robeco’s specific capabilities but has not been prepared by Robeco as investment research
and does not constitute an investment recommendation or advice to buy or sell certain securities or investment products and/or
to adopt any investment strategy and/or legal, accounting or tax advice. All rights relating to the information in this document are
and will remain the property of Robeco. This material may not be copied or used with the public. No part of this document may be
reproduced, or published in any form or by any means without Robeco’s prior written permission. Investment involves risks. Before
investing, please note the initial capital is not guaranteed. Investors should ensure that they fully understand the risk associated with
any Robeco product or service offered in their country of domicile. Investors should also consider their own investment objective and
risk tolerance level. Historical returns are provided for illustrative purposes only. The price of units may go down as well as up and
the past performance is not indicative of future performance. If the currency in which the past performance is displayed differs from
the currency of the country in which you reside, then you should be aware that due to exchange rate fluctuations the performance
shown may increase or decrease if converted into your local currency. The performance data do not take account of the commissions
and costs incurred on trading securities in client portfolios or on the issue and redemption of units. Unless otherwise stated, the
prices used for the performance figures of the Luxembourg-based Funds are the end-of-month transaction prices net of fees up to
4 August 2010. From 4 August 2010, the transaction prices net of fees will be those of the first business day of the month. Return
figures versus the benchmark show the investment management result before management and/or performance fees; the Fund
returns are with dividends reinvested and based on net asset values with prices and exchange rates of the valuation moment of the
benchmark. Please refer to the prospectus of the Funds for further details. Performance is quoted net of investment management
fees. The ongoing charges mentioned in this document are the ones stated in the Fund’s latest annual report at closing date of the
last calendar year. This document is not directed to, or intended for distribution to or use by any person or entity who is a citizen or
resident of or located in any locality, state, country or other jurisdiction where such distribution, document, availability or use would
be contrary to law or regulation or which would subject any Fund or Robeco Institutional Asset Management B.V. to any registration
or licensing requirement within such jurisdiction. Any decision to subscribe for interests in a Fund offered in a particular jurisdiction
must be made solely on the basis of information contained in the prospectus, which information may be different from the informa-
tion contained in this document. Prospective applicants for shares should inform themselves as to legal requirements also applying
and any applicable exchange control regulations and applicable taxes in the countries of their respective citizenship, residence or
domicile. The Fund information, if any, contained in this document is qualified in its entirety by reference to the prospectus, and this
document should, at all times, be read in conjunction with the prospectus. Detailed information on the Fund and associated risks is
contained in the prospectus. The prospectus and the Key Investor Information Document for the Robeco Funds can all be obtained
free of charge at www.robeco.com.
Additional Information for US investors
Robeco is considered “participating affiliated” and some of their employees are “associated persons” of Robeco Institutional Asset
Management US Inc. (“RIAM US”) as per relevant SEC no-action guidance. Employees identified as associated persons of RIAM US
perform activities directly or indirectly related to the investment advisory services provided by RIAM US. In those situation these
individuals are deemed to be acting on behalf of RIAM US, a US SEC registered investment adviser. SEC regulations are applicable
only to clients, prospects and investors of RIAM US. RIAM US is wholly owned subsidiary of ORIX Corporation Europe N.V. and offers
investment advisory services to institutional clients in the US.
Additional Information for investors with residence or seat in Australia and New Zealand
This document is distributed in Australia by Robeco Hong Kong Limited (ARBN 156 512 659) (“Robeco”), which is exempt from the
requirement to hold an Australian financial services license under the Corporations Act 2001 (Cth) pursuant to ASIC Class Order
03/1103. Robeco is regulated by the Securities and Futures Commission under the laws of Hong Kong and those laws may differ from
Australian laws. This document is distributed only to “wholesale clients” as that term is defined under the Corporations Act 2001
(Cth). This document is not for distribution or dissemination, directly or indirectly, to any other class of persons. In New Zealand, this
Country Sustainability: Visibly harmed by Covid-19 | 23document is only available to wholesale investors within the meaning of clause 3(2) of Schedule 1 of the Financial Markets Conduct
Act 2013 (‘FMCA’). This document is not for public distribution in Australia and New Zealand.
Additional Information for investors with residence or seat in Austria
This information is solely intended for professional investors or eligible counterparties in the meaning of the Austrian Securities
Oversight Act.
Additional Information for investors with residence or seat in Brazil
The Fund may not be offered or sold to the public in Brazil. Accordingly, the Fund has not been nor will be registered with the Brazilian
Securities Commission – CVM, nor has it been submitted to the foregoing agency for approval. Documents relating to the Fund, as
well as the information contained therein, may not be supplied to the public in Brazil, as the offering of the Fund is not a public offer-
ing of securities in Brazil, nor may they be used in connection with any offer for subscription or sale of securities to the public in Brazil.
Additional Information for investors with residence or seat in Canada
No securities commission or similar authority in Canada has reviewed or in any way passed upon this document or the merits of
the securities described herein, and any representation to the contrary is an offence. Robeco Institutional Asset Management B.V. is
relying on the international dealer and international adviser exemption in Quebec and has appointed McCarthy Tétrault LLP as its
agent for service in Quebec.
Additional information for investors with residence or seat in the Republic of Chile
Neither the issuer nor the Funds have been registered with the Superintendencia de Valores y Seguros pursuant to law no. 18.045,
the Ley de Mercado de Valores and regulations thereunder. This document does not constitute an offer of, or an invitation to sub-
scribe for or purchase, shares of the Funds in the Republic of Chile, other than to the specific person who individually requested this
information on his own initiative. This may therefore be treated as a “private offering” within the meaning of article 4 of the Ley de
Mercado de Valores (an offer that is not addressed to the public at large or to a certain sector or specific group of the public).
Additional Information for investors with residence or seat in Colombia
This document does not constitute a public offer in the Republic of Colombia. The offer of the Fund is addressed to less than one
hundred specifically identified investors. The Fund may not be promoted or marketed in Colombia or to Colombian residents, unless
such promotion and marketing is made in compliance with Decree 2555 of 2010 and other applicable rules and regulations related
to the promotion of foreign Funds in Colombia.
Additional Information for investors with residence or seat in the Dubai International Financial Centre (DIFC), United Arab Emirates
This material is being distributed by Robeco Institutional Asset Management B.V. (DIFC Branch) located at Office 209, Level 2, Gate
Village Building 7, Dubai International Financial Centre, Dubai, PO Box 482060, UAE. Robeco Institutional Asset Management B.V.
(DIFC Branch) is regulated by the Dubai Financial Services Authority (“DFSA”) and only deals with Professional Clients or Market
Counterparties and does not deal with Retail Clients as defined by the DFSA.
Additional Information for investors with residence or seat in France
Robeco is at liberty to provide services in France. Robeco France (only authorized to offer investment advice service to professional
investors) has been approved under registry number 10683 by the French prudential control and resolution authority (formerly ACP,
now the ACPR) as an investment firm since 28 September 2012.
Additional Information for investors with residence or seat in Germany
This information is solely intended for professional investors or eligible counterparties in the meaning of the German Securities
Trading Act.
Additional Information for investors with residence or seat in Hong Kong
The contents of this document have not been reviewed by the Securities and Futures Commission (“SFC”) in Hong Kong. If you are in
any doubt about any of the contents of this document, you should obtain independent professional advice. This document has been
distributed by Robeco Hong Kong Limited (“Robeco”). Robeco is regulated by the SFC in Hong Kong.
Additional Information for investors with residence or seat in Italy
This document is considered for use solely by qualified investors and private professional clients (as defined in Article 26 (1) (b) and
(d) of Consob Regulation No. 16190 dated 29 October 2007). If made available to Distributors and individuals authorized by Dis-
tributors to conduct promotion and marketing activity, it may only be used for the purpose for which it was conceived. The data and
information contained in this document may not be used for communications with Supervisory Authorities. This document does not
24 | Country Sustainability: Visibly harmed by Covid-19You can also read