COVID-19 CLOUDS FORECAST FOR THE ENVIRONMENTAL INDUSTRY INTO 2021 - Environmental Business ...
←
→
Page content transcription
If your browser does not render page correctly, please read the page content below
Vol. XXXIII, Numbers 5/6, 2020 Environmental Industry Outlook 2020 Environmental Business International Inc.
Inside EBJ: Industry Outlook 2020-2021
COVID-19 CLOUDS
Industry Outlook: The Covid-19 shutdown clouds the environmental industry
FORECAST FOR THE forecast, but resiliency in services and client sectors should soften impact............ 1-17
ENVIRONMENTAL EBJ Snapshot Survey: Project delays and cashflow concerns haunt the industry; jury
INDUSTRY INTO 2021 still out on working from home.............................................................................. 18
T
EBJ Survey captures impact of Covid-19 on morale and future outlook................ 20
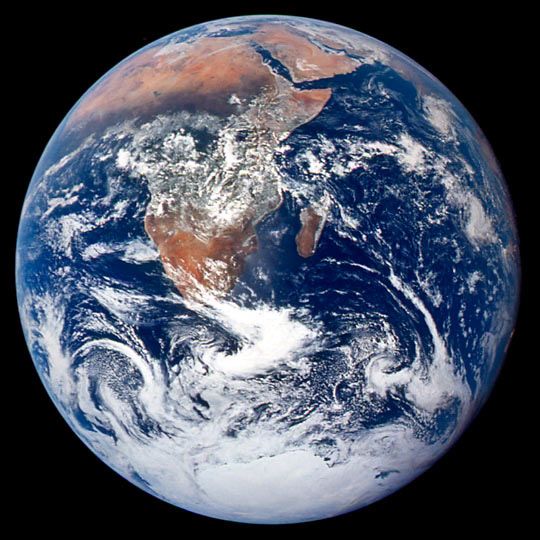
he first view of Earth from the
Moon was an iconic image that Clean Harbors improves top- and bottom-line results three years running............ 24
helped usher in the National En- Cascade expands in remediation technology beyond a strong position in drilling;
vironmental Protection Act and the U.S. combined remedies approach provides one-stop shop for complex sites.................. 28
Environmental Protection Agency in
1970—and the birth of what we know as Raba Kistner reports public sector active; private sector dials back, but compliance
the environmental industry today. Pho- and CAPEX projects sustained............................................................................... 33
tographic images from early Apollo mis- Rooted in air quality, Trinity diversifies via acquisitions and organic growth.......... 36
sions splashed across the front pages of
SHN right-sizes projects for rural clients, offers advantages larger firms cannot...... 39
newspapers and on TV screens showed
the white misty surface of the moon in AKRF sees projects moving forward following Covid-19 disruption....................... 41
the foreground eerily mirroring the brush
Wilcox & Barton thrives on strong leadership and work-life integration............... 42
strokes of cloud formation spiraling the
Earth. The image evoked powerful senti- TRC’s three ways to keep project teams safe and productive during lockdown....... 45
ments in humankind — not only of the Locus Technologies envisions an AI and blockchain future for big data management
abundance of God’s majesty as many of us on a single reporting system; extends leadership in SaaS EMIS............................... 46
were taught in Sunday school, but also of
our own isolation and vulnerability exist- Stifel Financial reviews impact of lockdown on waste volumes, reactions to China’s
ing on what resembled either a microscop- import bans, and GFL’s IPO and entry into the USA from Canada....................... 52
ic single cell of the universe or a tiny space Resource Recycling analyst says recycling markets face grim reality of rebuilding
ship floating in space. domestic markets in wake of Asia’s bans on contaminated exports.......................... 53
Clouds and outward-looking views of Rossway reports strong demand and pricing gains; lower waste volumes show up in
the heavens have always inspired powerful May but layoffs not expected.................................................................................. 56
images, from cave paintings to chapel ceil- EBJ Snapshot Survey: What to do with 30 minutes with the next president; and
ings to Turner and Van Gogh, but clouds Opinions on carbon tax or GHG policy................................................................. 58
had never before been seen from space.
Clouds have also posed endless challenges
manufacturing starting in the 1960s, con-
for meteorologists and nephologists clas-
sumer spending and the service economy
sifying and sub-classifying shapes and el-
have been the unquestioned engines of
evations of at least 16 categories of clouds.
growth in developed and transitional
And clouds of an undetermined nature
economies since the 1980s. Now being
are forecast for the global economy and
questioned is whether this dependence on
the environmental industry as 2020 hits
consumer spending has been too high, and
its midpoint, and the economic impacts
whether lubricating credit and liquidity in
of the novel coronavirus ravage vulnerable
services-heavy developed economies really
populations — as well as sectors of the
can produce long-term societal benefit or
consumer and industrial economy once
if economic stimulus artificially prolongs
regarded as mostly invulnerable.
unsustainable spending. China, as the
Consumer spending has had a steadily world’s most populous economy and the
increasing influence on economic growth most dynamic during the recent era of
since World War II. Following a wave of globalization, was held up as an example First ‘Earthrise’ Photgraph Taken
globalization in resource provision and of needing to transition from an export- in 1966 by Lunar Orbiter 1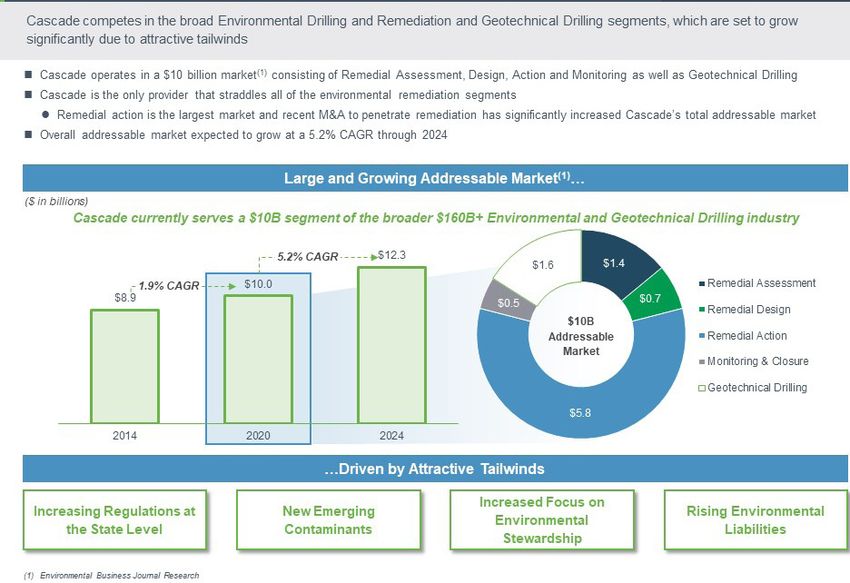
Environmental Business Journal, Volume XXXIII, Numbers 5/6, 2020

A Brief History of Images of                             ‘Earthrise’ from the Moon: Apollo 8 Mission in 1968
Earth from Space

I  n 1946, scientists sent a rocket hurtling
   up into the atmosphere with a 35mm
camera strapped to it. The rocket reached
an altitude of 65 miles and treated human-
ity to the first pictures of Earth taken from
space. The U.S-launched V-2 flight on
October 24, 1946 took one image every
1.5 seconds. With an apogee of 65 miles,
these photos were from five times higher
than the previous record, the 13.7 miles
reached by the Explorer II balloon mission
in 1935.
     Hundreds of images were taken over
the next few years using similar methods,
but it wasn't until 1966 that we got our
first ever glimpse of Earth from the Moon.
This famous image was dubbed "Earth-            The ‘Blue Marble’ Image from Apollo 17                            Since the launch of the first
                                                                                                              satellite Sputnik in 1957, about
rise," and several variations on the theme
                                                                                                              8,400 satellites have been sent to
were captured in subsequent years. As the
                                                                                                              space according to the United
1960s progressed we got images of Earth
                                                                                                              Nations Register of Objects
from the Apollo missions. The most in-
                                                                                                              Launched into Outer Space
fluential image was taken in 1972 by the
                                                                                                              (UNOOSA). At the end of 2019
crew of the Apollo 17 mission and became
                                                                                                              there were an estimated 4,994
known as "The Blue Marble." It is one of
                                                                                                              satellites in orbit around Earth,
the most reproduced and famous images
                                                                                                              and seven that were orbiting oth-
in human history, recaptured on several                                                                       er planets. Not all satellites are
occasions over the years with NASA most                                                                       equppied with cameras, but the
recently delivering 2012 updates including                                                                    sophistication of the equipment
what they call "The Black Marble" with ur-                                                                    is increasing with thousands of
ban areas outlined and illuminated by city                                                                    new images a day. There were
lights - although Pink Floyd afficianiados                                                                    150 dedicated ‘earth observa-
are more likely to prefer the name ‘Dark                                                                      tion’ satellites in orbit in 2008,
Side of the Earth’. As cameras have trav-                                                                     and at least 800 by the end of
eled further afield, images of the Earth                                                                      2019. Big data indeed.
have been captured through the rings of
Saturn and from Mercury. One of the
furthest images ever captured of Earth is        Environmental Business Journal ® (ISSN 0145-8611) is published by Environmental Business
                                                 International, Inc., 4452 Park Blvd., #306, San Diego, CA 92116. © 2020 Environmental
known as "The Pale Blue Dot". The im-
                                                 Business International, Inc. All rights reserved. This publication, or any part, may not be
age was taken in 1990 by Voyager 1 from a        duplicated, reprinted, or republished without the written permission of the publisher.
distance of 3.7 billion miles.
                                                 To order a subscription, call 619-295-7685 ext. 15 or visit us online at ebionline.org/ebj.
   The first satellite or orbital photographs    A corporate electronic subscription with internal reproduction license and access to data
of Earth were made in 1959 by the un-            files starts at $1,250 and allows up to five registered users with rates increasing in five user
manned U.S. Explorer 6. Satellite images         increments. Individual editions or discounted corporate subscriptions are available for firms
have many applications in meteorology,           with under 100 employees.

oceanography, hydrology, fishing, agricul-
                                                 Editor in Chief, Grant Ferrier		          Federal Analyst, Andrew Paterson
ture, biodiversity conservation, forestry,
                                                 Research Manager, Laura Carranza          Managing Editor, Lyn Thwaites
landscape, geology, cartography, regional        Writers George Stubbs & Jim Hight         Research Analyst, Anika Rohlfe
planning, education, intelligence, espio-
nage, warfare — and numerous other ap-           EDITORIAL ADVISORY BOARD
plications increasingly used by the envi-        Andrew Paterson, Chairman; James Strock, Founder, Serve to Lead; Al Spiers,
ronmental and climate change industries.         2020 Environmental Group; Steve Maxwell, TechKnowledgey Strategic Group; P.S.
                                                 Reilly, NextGen Today; Dr. Edgar Berkey; Paul Zofnass, EFCG

2                                                                                                       Strategic Information for a Changing Industry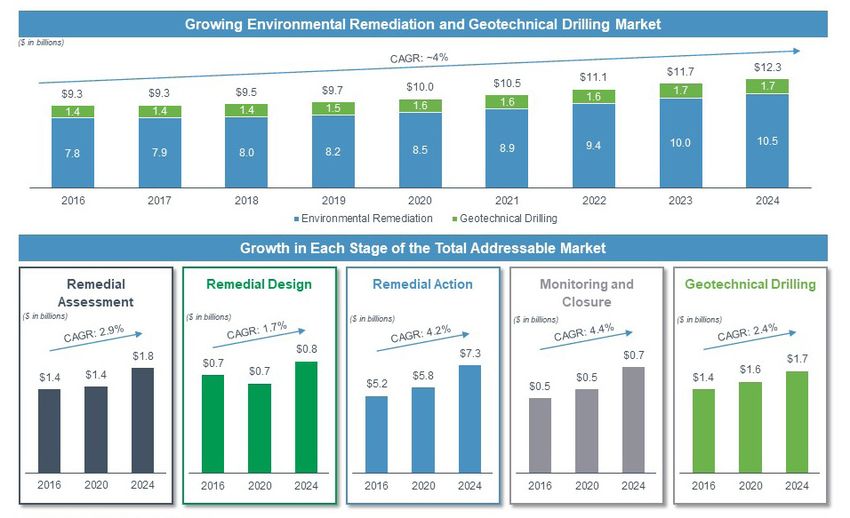
Environmental Business Journal, Volume XXXIII, Numbers 5/6, 2020
manufacturing economy to a domestic- already recession-sensitive sectors like lux- plementing their base of non-discretionary
consumer economy, and it has done so to ury goods and tourism. So with the non- resource development, resource manage-
remarkable effect in the first two decades essential service economy on hold, and 20 ment, infrastructure, monitoring, compli-
of the 21st century. million Americans newly unemployed, the ance and public-health based activities.
cloudy economic forecast is no surprise;
As COVID-19 has shown, however, So while forecasts for economic growth
nor is the tinderbox of civil unrest that
much of the consumer economy is in during the COVID-19 shutdown and the
sparked in June 2020.
‘non-essential’ services ranging from food subsequent recovery period are all over the
service, entertainment, travel and hospital- map, EBJ believes the environmental in-
ENVIRONMENTAL INDUSTRY
ity (once considered less vulnerable) to the dustry is fairly certain to fare better than
IS RESILIENT many sectors of the economy.
However, the en-
Status of Work Scheduled Prior to Coronavirus In this annual outlook edition, EBJ
vironmental industry,
April 2020 with its diversity of takes on the task of framing an Environ-
services and breadth mental Industry Outlook for 2020 and
Completely unaffected 55.9%
and depth of clientele resetting its forecast for 2020 and 2021
Delayed but still 50%+ staffed 14.1% in the wake of the unprecedented corona-
in virtually every sec-
Delayed but still 10-50% staffed 5.4% tor of the economy, is virus crisis. While we are throwing many
Delayed but only 1-10% staffed 1.5% remarkably resilient customary assumptions out of the window,
and hardly exposed we also believe perspective can be gained
Postponed indefinitely 7.5%
to the non-essential from the past 50 years and how the envi-
Postponed with a resume date before July 30 9.6% ronmental industry fared during past re-
luxuries of contempo-
Postponed with a resume date August 1 3.0% rary consumer living. cessions. The chart re-produced on page 23
Environmental service from EBJ’s 2019 Industry Overview edi-
Cancelled 3.0%
companies have long tion marks previous administrations, gov-
Accelerated 2.1% ernment shutdowns and recessions, noting
dealt with “discretion-
Source: EBJ 2020 Snapshot Survey: COVID-19, 2020 Market Snapshot and Indus-
ary” expenditures be- the relative stability of the industry in the
try Trend Survey. Question was: Of your total base of business prior to coronavirus,
ing a component of 2010s included the observation: “Given a
what percent of your service work is in the current status? Total is more than 100
because projects could fall into more than one category. © 2020 EBI Inc. their revenue—com- somewhat volatile past, this measure of sta-
EBJ Survey: Project Continuations During COVID-19 Shutdown as of late April 2020
Projects must be Projects are to Projects must be slowed All project work Projects are
accelerated continue as normal down or delayed must stop cancelled
Water/Wastewater 2% 75% 21% 0% 2%
Hospitals and Health Care 44% 22% 26% 4% 4%
Transportation 6% 66% 22% 4% 2%
Public Infrastructure 3% 68% 24% 3% 2%
Department of Defense 3% 58% 33% 5% 3%
Hi-Tech 14% 43% 32% 7% 4%
DOE 4% 43% 43% 7% 4%
Energy and Power 2% 44% 47% 3% 3%
EPA 0% 42% 52% 2% 4%
Ports and Harbors 0% 39% 52% 7% 2%
Education and Schools 10% 25% 30% 33% 3%
Residential Real Estate 6% 24% 53% 15% 3%
Mining 0% 32% 49% 15% 5%
Dept of Interior / NR Agencies 3% 25% 53% 9% 9%
Community Planning and Dev 3% 24% 51% 16% 5%
Oil & Gas 0% 20% 69% 6% 6%
Commercial Real Estate 0% 17% 71% 12% 0%
Source: EBJ 2020 Snapshot Survey: COVID-19, 2020 Market Snapshot and Industry Trend Survey. Question was:What are you hearing from your clients and their market sec-
tor regarding continuation of MOST of their contracted and funded project work under COVID-19? © 2020 EBI Inc.
Strategic Information for a Changing Industry 3
Environmental Business Journal, Volume XXXIII, Numbers 5/6, 2020
COVID-19 Shutdown Impact on Environmental Services Market Areas
Strong Positive Positive Slight Positive No Slight Negative Negative Strong Negative
Impact Impact Impact Impact Impact Impact Impact
EHS/Industrial hygiene 14% 14% 18% 11% 25% 15% 3%
Wastewater 0% 6% 8% 58% 25% 3% 0%
Water 0% 3% 10% 54% 24% 10% 0%
Air quality 0% 8% 15% 26% 35% 16% 0%
Environmental information 3% 3% 17% 28% 30% 8% 10%
Solid waste mgmt/disposal 0% 4% 9% 35% 35% 17% 0%
Hazardous waste mgmt 0% 3% 7% 34% 44% 12% 0%
Renewable energy 2% 2% 8% 35% 35% 10% 6%
Sustainability/CSR 0% 12% 16% 22% 16% 25% 10%
Climate adaptation/resilience 0% 9% 15% 26% 23% 17% 11%
Energy mgmt/efficiency 3% 3% 3% 41% 36% 8% 8%
Solid waste recycling 0% 3% 8% 28% 38% 25% 0%
Natural resources 0% 0% 10% 27% 42% 19% 2%
Climate/GHG mitigation 0% 4% 11% 24% 22% 27% 11%
Remediation 0% 1% 4% 22% 40% 22% 11%
Source: EBJ 2020 Snapshot Survey: COVID-19, 2020 Market Snapshot and Industry Trend Survey. Question was:What will be the impact of the following market areas from
COVID-19 conditions in 2020? © 2020 EBI Inc.
bility is indeed a positive, and exhibits the rankings, ascending to position 4 from
EBJ 2020 Survey Respondent general consensus that the environmental nearly the midpoint at 15 out of 33 sec-
Pool by Size and Segment industry is more and more woven in to tors in 2019 as rated by 100+ respondents.
the fabric of the U.S. economy, if not the E-commerce logistics centers and data
By Primary Segment
global economy.” centers have been the fastest subcategories
Lab Testing 5% of real estate development in the United
Few of the 33 client sectors that EBJ
Waste Management 3% States over the last five years, and are likely
deems as worth analyzing (and as repre-
a strong component of this high ranking
Contracting 18% sented in EBJ’s 2020 Snapshot Survey and
among client prospects. Also notable for
Consulting & Engineering 48% ranked on page 5) can be regarded as non-
ascending in the rankings by 27 spots is
essential. This table compares the 2019
Design & Planning 5% the pulp & paper industry, and one can
and 2020 rankings of client sectors in
speculate whether the run on toilet paper
Equipment & Info 6% terms of two-year growth expectations by
is the driver there or if the development
Investment/Mgmt 6% our environmental industry community of
of domestic markets for secondary fiber is
respondents represented on page 4.
Other/Individual 8% also having a significant impact on client
Dramatic shifts in rankings in just one expectations. (See article on recycling and
By Size in Revenue
year can largely, but not exclusively, be at- the need for more domestic processing on
$0-1 million in revenue 17% tributed to the coronavirus. Client sectors page 53.)
$1-5 million in revenue 15% notably rising in the rankings are federal
Client sectors falling down the rank-
government agencies, with the Depart-
$5-20 million in revenue 18% ings in our 2020 survey are led first and
ment of Defense and Department of En-
foremost by the oil & gas industry, with
$20-100 million in revenue 18% ergy ranked in the top seven today, after
all three sub-sectors (upstream, midstream
$100-500 million in revenue 18% both being ranked in the bottom five in
and downstream) ranking in the top 10
EBI’s 2019 survey. Environmental compa-
$500 million+ in revenue 15% just a year ago, but inhabiting the bottom
nies will remember the ARRA or Recovery
Source: EBJ 2020 Snapshot Survey: COVID-19, 2020
five in EBJ’s April 2020 survey. The sud-
Act of 2009 and the buoying effect funded
Market Snapshot and Industry Trend Survey. Questions den and dramatic sway in the global oil
federal agencies had on their projects in
were: Please classify your company by primary busi- supply-and-demand equation as depicted
ness unit or function, and by size in gross revenue. that post-recessionary era. Tech companies
on the chart on page 13, and its corre-
© 2020 EBI Inc. n=162 (lumped with electronics and IT in our
sponding effect on crude oil prices today
survey) also gained notably in the 2020
4 Strategic Information for a Changing Industry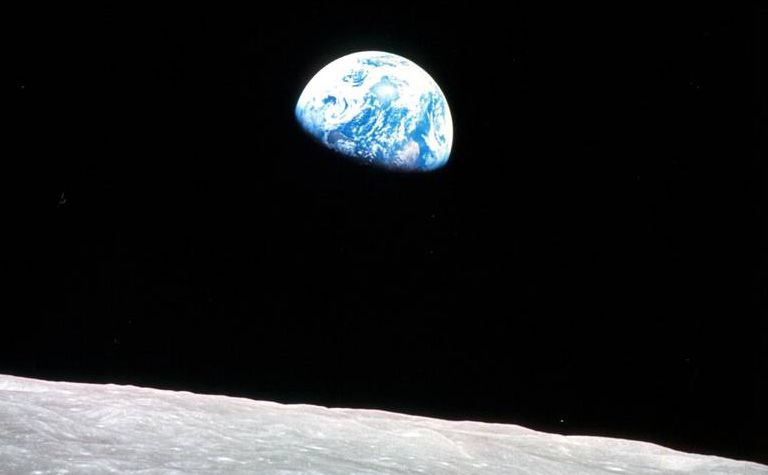
Environmental Business Journal, Volume XXXIII, Numbers 5/6, 2020

and oil price futures has conventional en-         2020-2021 Client Forecast: Ranking of Environmental Markets
ergy development sectors perhaps just as                                                                                                        2020
threatened (or some might contend more           Client Sector Ranked by Next 2 Years’ Growth            2020 Rank         2019 Rank
                                                                                                                                               Change
threatened) than the non-essential services
                                                 Healthcare                                                    1                 3                 2
sectors already impacted by coronavirus.
                                                 Water utilities                                               2                 4                 2
    The combination of a collapse in coop-
eration and collusion between major oil          Power utilities                                               3                 5                 2
producing nations, and the flexibility of
                                                 Tech/Electronics/IT mfg. & service                            4                15                11
shutting off and turning on U.S. non-con-
ventional oil and gas production, makes it       Federal government: DOD                                       5                28                23
look very unlikely that global oil produc-
                                                 Renewable energy development                                  6                11                 5
ers will be able to manipulate a shortage
of oil anytime soon—if ever again. With          Federal government: DOE                                       7                31                24
a growing portion of conventional finan-
                                                 Transportation authorities                                    8                 6                -2
cial markets already exhibiting wariness of
long-term investments related to oil and         Port authorities                                              9                 7                -2
gas development or asset acquisition prior
                                                 Solid waste utilities & companies                            10                22                12
to coronavirus, any propping up of the oil
& gas industry outside of state support          Federal government: Other                                    11                32                21
seems now increasingly unlikely.
                                                 Consumer products                                            12                21                 9
    The decline in growth expectations
                                                 Pulp & paper                                                 13                30                17
for the chemical industry is perhaps a
little surprising as it was ranked number        Local government                                             14                14                 0
2 out of 33 in EBJ’s 2019 survey because
                                                 Education                                                    15                20                 5
low domestic natural gas costs had built
momentum behind a major reshoring of             State government                                             16                13                -3
chemical manufacturing. But clearly the
                                                 Chemical                                                     17                 2                -15
environmental industry expects the chem-
ical industry not to be one of the better        Federal government: EPA                                      18                33                15
client prospects on which to focus their
                                                 Banks & Law Firms                                            19                27                 8
business development efforts over the next
two years. Notable declines in enforce-          Other manufacturing                                          20                16                -4
ment by environmental authorities at the
                                                 Primary metals                                               21                25                 4
federal level, as well as a number of execu-
tive orders diluting or eliminating existing     Metals fabricating/coating                                   22                26                 4
statutes, are likely another contributor to
                                                 Food & beverage                                              23                23                 0
uncertain growth expectations across the
board, but felt more keenly in the chemi-        Transportation mfg (auto & aero)                             24                18                -6
cal and petrochemical sectors.
                                                 Mining                                                       25                19                -6
    Property development also has taken a
                                                 Property developers: commercial                              26                12                -14
big hit for the near-term and out to the
end of 2021: Commercial developers and           Property developers: residential                             27                10                -17
residential developers have both fallen into
                                                 Petroleum retail/gas stations                                28                24                -4
the bottom quarter of ranked client sectors
by the environmental industry community          Oil & Gas Midstream (pipelines/terminals)                    29                 1                -28
from top 12 positions in 2019.
                                                 Oil & Gas Downstream (refineries)                            30                 8                -22
   A closer look at growth expectations
                                                 Major retailers                                              31                29                -2
by client shows an understandable lack
of confidence in short-term growth pros-         Oil & Gas Upstream (E&P)                                     32                 9                -23
pects. Each of the 33 client groups are
                                                 Hospitality                                                  33                17                -16
rated by survey respondents in one of the
7 categories shown on the table on page 6.      Source: EBJ 2020 & 2019 Snapshot Survey. Question was: Customer Market Trends:Please rate the following
                                                customer areas in terms of prospects for growth in 2020-2021. © 2020 EBI Inc.
Healthcare and water utilities exhibit clear

Strategic Information for a Changing Industry                                                                                                             5
Environmental Business Journal, Volume XXXIII, Numbers 5/6, 2020

                                      Client Sector Prospect for Growth: Ratings for 2020-2021
                                                                                                                                  Modest
                                              Very strong        Strong           Good        Slow growth           Flat                        Big decline
                                                                                                                                  decline
 Healthcare                                      14%              26%             28%              16%             12%              2%               2%
 Water utilities                                  4%              13%             33%              25%             24%              2%               0%
 Power utilities                                  0%              13%             30%              30%             22%              6%               0%
 Tech/Electronics/IT mfg. & service               0%              12%             15%              42%             24%              6%               0%
 Federal government: DOD                          0%              10%             37%              15%             29%             10%               0%
 Renewable energy development                     4%              6%              33%              29%             17%              6%               6%
 Federal government: DOE                          0%              8%              24%              24%             32%              11%              0%
 Transportation authorities                       4%              9%              22%              18%             31%              9%               7%
 Port authorities                                 3%              10%             23%              23%             25%             13%               5%
 Solid waste utilities & companies                0%              4%              24%              31%             33%              2%               4%
 Federal government: Other                        0%              8%              22%              22%             35%             14%               0%
 Consumer products                                3%              8%              23%              28%             18%             18%               3%
 Pulp & paper                                     2%              7%              16%              30%             27%             18%               0%
 Local government                                 0%              8%              27%              24%             25%             12%               4%
 Education                                        0%              12%             21%              24%             21%             19%               2%
 State government                                 0%              8%              29%              23%             23%             13%               4%
 Chemical                                         4%              4%              25%              18%             33%              8%               8%
 Federal government: EPA                          3%              0%              28%              25%             28%             13%               5%
 Banks & Law Firms                                2%              4%              22%              27%             20%             22%               2%
 Other manufacturing                              0%              2%              21%              23%             38%             17%               0%
 Primary metals                                   0%              3%              13%              15%             48%             20%               3%
 Metals fabricating/coating                       0%              3%              14%              14%             42%             28%               0%
 Food & beverage                                  2%              12%             23%              12%             19%              9%              23%
 Transportation mfg (auto & aero)                 0%              7%              17%              20%             15%             29%              12%
 Mining                                           0%              2%              13%              21%             23%             28%              13%
 Property developers: commercial                  0%              2%              15%              13%             25%             30%              15%
 Property developers: residential                 0%              2%               7%              16%             30%             30%              16%
 Petroleum retail/gas stations                    0%              2%              12%              10%             32%             24%              20%
 Oil & Gas Midstream (pipelines/terminals)        4%              0%              13%              9%              22%             25%              27%
 Oil & Gas Downstream (refineries)                2%              2%               6%              10%             25%             31%              24%
 Major retailers                                  0%              0%               7%              19%             19%             23%              33%
 Oil & Gas Upstream (E&P)                         0%              0%               8%              6%              16%             20%              49%
 Hospitality                                      0%              0%               7%              7%              12%             21%              53%
Source: EBJ 2020 Snapshot Survey. Question was: Please rate the following customer areas in terms of prospects for growth in 2020-2021. © 2020 EBI Inc.

6                                                                                                                Strategic Information for a Changing Industry
Environmental Business Journal, Volume XXXIII, Numbers 5/6, 2020
2017-2020 Surveys: Company & Segment Revenue Growth Rates separation as the top 2 growth categories
Company 2017 2018 2019 2020e 2021e as expected by the environmental industry
2020 Survey 4.1% 4.5% 4.1% -0.4% 2.6% community. The next 20 categories, how-
2019 Survey 5.0% 4.0% 3.6% 3.8% -- ever, ranked using a weighted formula of
the aggregated survey responses, show a
2018 Survey 4.3% 5.1% 8.0% -- --
majority of responses in either the “slow
2017 Survey 7.4% 7.2% -- -- -- growth” or “flat” rating, or about two-
Segment 2017 2018 2019 2020e 2021e thirds of client categories expected to be
2020 Survey 5.0% 5.4% 4.8% -0.3% 2.1% in the ‘dead spot’ in the no-growth middle
2019 Survey 2.8% 2.5% 2.4% 2.4% -- through 2021.
2018 Survey 4.0% 4.7% 4.7% -- -- Perhaps more telling is how respon-
2017 Survey 4.3% 4.3% -- -- -- dents rate markets expected to decline
Current Year 2017 2018 2019 2020 significantly, with the bottom five in the
Company 7.4% 5.1% 3.6% -0.4% 50-75% range of “modest decline” or “big
decline.” Equally alarming is where mar-
Segment 4.3% 4.7% 2.4% -0.3%
kets rated as two-year declines outnumber
Co-Segment Delta 3.1% 0.4% 1.2% -0.1%
growth ratings by more than a factor of
Outlook or Next Year 2017 2018 2019 2020 2 to 1. These are unlikely to experience a
Company 7.2% 8.0% 3.8% 2.6% rapid recovery. Some of these include auto-
Segment 4.3% 4.7% 2.4% 2.1% motive manufacturing, mining and prop-
Co-Segment Delta 2.9% 3.3% 1.4% 0.5% erty development that represent significant
Source: EBJ Snapshot Surveys 2017, 2018, 2019, 2020. Questions were: Please estimate the revenue growth rate
client sectors for environmental service
for your company and for your segment of the industry. © 2020 EBI Inc. companies.
Trends in service categories summa-
EBJ Surveys: Company Gross Revenue Growth Rates
9%
rized on page 10 show the expected in-
crease in interest in environmental health
8% 2020 Survey & safety (EHS) and outsourcing EHS
7% 2019 Survey functions, and significant moves up the
6% 2018 Survey chart for water reuse, and monitoring &
5% 2017 Survey analytical work. On the other end of the
spectrum, respondents have much reduced
4%
prospects for investments in environmen-
3% tal information technology and environ-
2% mental management information systems,
1% which may now be viewed as a luxury or
discretionary investment by many client
0%
sectors. Information efficiency investments
-1% 2017 2018 2019 2020e 2021e
often appear to have few short-term com-
EBJ Surveys: Segment Growth Rate pliance implications, making it a less likely
6% investment in tight times. Falling ratings
2020 Survey for green building and private remediation
5% and brownfields are understandable given
2019 Survey
2018 Survey the long-term recovery expected in com-
4%
mercial development.
2017 Survey
3% While EBJ’s annual outlook survey
focuses mostly on market conditions and
2% expectations for growth, we do devote one
question to operating margins, and rather
1%
than asking for a current percentage, the
question calls merely for directional move-
0%
ment of ‘up’ or ‘down’ or ‘about the same’.
2017 2018 2019 2020e 2021e
-1%
The chart at the bottom of page 11 dis-
Source: EBJ Snapshot Surveys - 2017, 2018, 2019, 2020. Question was: Please report your company’s gross plays these results for the last six years of
revenue growth rate. © 2020 EBI Inc.
surveys. The year 2014 shows the best im-
Strategic Information for a Changing Industry 7Environmental Business Journal, Volume XXXIII, Numbers 5/6, 2020
Organic Growth (excluding acquisitions) provement in margins, but recall that 2013
May & June Expectations of Organic Growth in 2020 and 2021
was a notably bad year for a environmental
May 1, 2020 Perspective June 5, 2020 Perspective firms dependent either on the federal gov-
20.0% ernment (and in particular the Department
of Defense hit with budget sequestration in
15.0%
15.0% 2013), and also those dependent on the oil
& gas industry. 2019 showed a continuation
10.0%
10.0%
Weighted Avg. of the generally positive trend of companies
9.7% 8.0% 75th percentile
7.0% 7.1% 7.0% with increasing margins outnumbering those
5.0% 5.0% Median 5.0% with a decline in margins by about 2 to 1,
5.0%
2.8% 3.0% 2.8% with a fairly consistent 20% of companies re-
0.5% 1.1% 3.0%
0.0%
1.0% porting the same margins as the year before.
0.0% 25th percentile 0.0%
EBJ survey respondents have historically
-5.0% -3.0%
not been a very accurate predictor of the
2019 Actual 2020 Proj 2021 Proj 2020 Proj 2021 Proj
stock market in any given year, so this year’s
Source: AEC Advisors June 5, 2020 Webinar; 6th Bi-Weekly Specific Issue Survey Results largest category of responses that the Stan-
Over the last month, the 2020 & 2021 growth outlook has improved slightly, but there are mixed signals
A ccording to surveys by AEC Advisors (New York) from the beginning of May dard & Poors 500 Index would decline 15-
• Current backlog, as a percentage of revenue, is the same as it was pre-COVID-19,
to the beginning of June 2020, the 2020 & 2021 growth outlook for architect, suggesting firms are replacing the backlog they have burnt 20% should not be too alarming, especially
off over the last couple months, and further supporting the projections for growth in 2020 & 2021 given that the many indices have fallen that
engineering, consulting and environmental firms improved slightly in the 35 days
• But, the median firm now expects a return to “normal” in 12 months (vs. 6 months in our May 1, 2020 survey), which makes us question much or more already in 2020, with fluctu-
between
whether thesurveys, but
projections for 2020with
and 2021mixed signals from the respondents. Current backlog, as
are realistic
a• percentage of revenue, is the same as it was pre-COVID-19, suggesting firms are ating rebounds. Only a little over 10% ex-
Further, when we weighted firms’ growth by their revenues (vs. median firm basis) organic growth is projected to be a bit lower, which is not
replacing the backlog they have burnt off over the last couple months, and further
surprising since larger firms have been growing slower organically; we think the weighted average is more representative of overall industry
pect the stock market to end 2020 in positive
growth rate, and on that basis, 2020 looks much better than the US
supporting the projections for growth in 2020 and 2021. But the median firm nowGDP forecast, but 2021 less so given industry lag in / out of recessions. territory, however, and even the most opti-
expects a return to “normal” in 12 months versus six months in the May 1, 2020 sur- mistic stock forecast would likely agree with
vey, which makes AEC Advisors “question whether the projections for 2020 and 2021 the 90%.
Confidential / Prepared by AEC Advisors LLC 6
are realistic.” When weighting firms’ growth by their revenues (versus median firm Expectation for housing prices show the
basis) organic growth is projected to be a bit lower, which is not surprising since larger largest response in “flat or stagnant markets,”
firms have been growing slower organically. AEC Advisors think the weighted average but almost equal expectations for declines
is more representative of overall industry growth rates, and on that basis, 2020 looks and appreciations of housing prices, with
much better than the U.S. GDP forecast, but 2021 less so given the AEC industry each of these buckets representing about a
historical patterns to lag in and out of recessions. third of the responses. Property values are
historically cyclical and also very regional in
nature, so it is understandable that little con-
EFCG Warns of “Overoptimistic” Industry Projections sensus is reached on housing prices with the
somewhat comforting fact that few predict a
T he Environmental Financial Consulting Group (EFCG, New York) sounded
a warning note on “overoptimism” in A/E/C (architecture/engineering consult-
ing/construction) business projections through the COVID crisis and recovery pe-
complete collapse.
DIRECT IMPACT OF
riod in a late May 2020 webinar. An EFCG survey indicated a drop-off in average
net revenue growth from around the 8% level seen in 2018 and 2019 to an expected CORONAVIRUS
3% growth in 2020, before swiftly bouncing back to 8% again in 2021. ECFG Directly gauging the impact of coronavi-
commented: "While the industry is historically recession resilient... it is also known rus on existing project work, the tables on
for making overoptimistic projections. Knowing this, EFCG urges firms to remain page 3 summarize environmental industry
conservative when setting budgets." responses. The April 2020 responses show
56% of project work was completely unaf-
Water/wastewater, U.S. state/municipal work, and U.S. federal work are seen as
fected, and about two-thirds of the delayed
stable sectors, while infrastructure, healthcare and technology are expected to out-
projects still more than 50% staffed by proj-
perform, according to the survey results. The least attractive areas are oil & gas,
ect teams. With only 7.5% of projects ‘post-
airports/aviation, hospitality and other private-sector client work. Less than 5% of
poned indefinitely’ and only 3% ‘canceled’,
firms surveyed pointed to environmental services as the area that would be hardest
one can see why much of the environmental
hit during the downturn, but at the same time less than 5% said the environmental
industry project community remains pretty
sector would provide the best opportunities during and after the downturn. EFCG
much on task in terms of billability and
noted that environmental business units serve many client sectors, making it more
short-term forecasts as of June 2020.
resilient in general, but firms providing environmental services to sectors expected to
be particularly hit hard will be more exposed. Looking at project continuations by sector
on the table on page 3 provides some inter-
8 Strategic Information for a Changing IndustryEnvironmental Business Journal, Volume XXXIII, Numbers 5/6, 2020
2020-2021 Forecast: Ranking of Environmental Markets by Media esting highlights. First, it is somewhat under-
standable that 44% of hospital and healthcare
2020
Ranked by Next 2 Years’ Growth 2020 2019 projects were accelerated by the crisis, but
Change
notable that 14% of tech industry and 10%
EHS/Industrial hygiene & safety 1 10 9 of education sector projects were accelerated
as well. Ranking high in the “projects are to
Water 2 1 -1
continue as normal” column were the essen-
Wastewater 3 2 -1 tials like water and wastewater, transportation
and public infrastructure, although some may
Environmental information 4 4 0 be surprised that only two thirds of the latter
two categories were unaffected and only three
Renewable energy 5 5 0
quarters of water/wastewater projects were
Energy mgmt/efficiency 6 6 0 unaffected — so no area of the economy have
been truly immune to coronavirus impacts.
Air quality 7 14 7
Ranking highest in the projects “must slow
Hazardous waste mgmt 8 7 -1 down or be delayed” column were the afore-
mentioned commercial development and oil
Solid waste mgmt 9 9 0 & gas sectors but, notable for environmental
Climate adaptation/resilience 10 8 -2 consultants, over half of the work in natural
resource agencies and the Department of In-
Sustainability/corporate responsibility 11 3 -8 terior and EPA is reported as delayed, despite
their status as federal markets.
Remediation 12 11 -1
Ranking highest in the “project work must
Natural resources 13 13 0 stop” column was the education sector, which
appears to contradict the previously noted
Climate/carbon: mitigation 14 12 -2
higher ranking in project accelerations but can
Source: EBJ 2020 & 2019 Snapshot Survey. Question was: Please rate the following media market areas in terms be explained perhaps by the desire to close the
of prospects for growth in 2020-2021. © 2020 EBI Inc.
Media Category Prospect for Growth - Ratings for 2020-2021
Slow Modest
Very strong Strong Good Flat Big decline
growth decline
EHS/Industrial hygiene & safety 8% 19% 33% 13% 17% 10% 0%
Water 2% 13% 36% 21% 26% 2% 0%
Wastewater 4% 11% 32% 19% 32% 2% 0%
Environmental information 2% 10% 32% 32% 17% 5% 2%
Renewable energy 2% 7% 29% 27% 22% 10% 2%
Energy mgmt/efficiency 0% 6% 23% 46% 17% 9% 0%
Air quality 4% 8% 16% 24% 35% 10% 2%
Hazardous waste mgmt. 0% 7% 21% 26% 35% 12% 0%
Solid waste mgmt 0% 3% 14% 38% 38% 8% 0%
Climate adaptation/resilience 3% 5% 31% 23% 21% 8% 10%
Sustainability/corporate responsibility 3% 5% 25% 18% 33% 10% 8%
Remediation 0% 7% 11% 33% 30% 16% 4%
Natural resources 0% 5% 21% 29% 24% 19% 2%
Climate/carbon: mitigation 3% 5% 21% 24% 26% 11% 11%
Source: EBJ 2020 Snapshot Survey. Question was: Please rate the following environmental media areas in terms of prospects for growth in 2020-2021. © 2020 EBI Inc.
Strategic Information for a Changing Industry 9Environmental Business Journal, Volume XXXIII, Numbers 5/6, 2020
Environmental Services Trends: 2019 to 2020 book on school work as virtually all schools and educational
2020 2019 2020 institutions went into shutdown, and overwhelmed districts
Ranked by Next 2 Years’ Growth
Rank Rank Change focused on the unenviable task of educating tens of millions
Outsourcing EHS functions 1 8 7 of youngsters over the internet.
Resiliency planning 2 2 0 Survey respondents were also asked to rate the specific im-
pact of COVID-19 economic shutdowns on service or me-
Water recycling/reuse 3 18 15
dia market areas. The table at the top of page 4 presents the
Operations & maintenance 4 9 5 aggregated responses and shows the unsurprising tilt to the
Monitoring & analytical work 5 13 8 negative across almost all service categories. Environmental
health & safety (EHS) and industrial hygiene was the only
Industrial waste mgmt/in-plant services 6 5 -1
category for which positive impact ratings outweighed nega-
Project mgmt./Construction mgmt 7 1 -6 tive impact ratings — but not by a very high margin. Another
Design and project engineering 8 3 -5 eight sectors had positive impact ratings in the 10-20% range,
although these were mostly outweighed by negatives by a fac-
Permitting/compliance 9 6 -3
tor of at least 2 to 1.
Energy: Performance contracting 10 12 2
Water and waste water again ranked one and two in terms
Investigations/assessments/audits 11 15 4 of “no impact” from coronavirus, but only slightly more than
Smart growth/“green” planning 12 10 -2 half selected “no impact,” with negatives outweighing the
Gov’t remediation/ base conversion 13 20 7
positives in the other responses. The largest negative impacts
in 2020 are expected to be on the arguably more discretionary
Impact assessment & permitting 14 16 2 short-term services like greenhouse gas emissions, sustainabil-
Solid waste diversion/recycling 15 17 2 ity, climate adaptation and environmental information.
Waste minimization 16 19 3 Remediation is low rated and suffers from a freeze on many
IT/EMIS software/systems/training 17 4 -13 development projects that have become an increasing share of
the remediation market as opposed to government-mandated
Ecological restoration 18 14 -4
or regulation-driven projects. The sector also suffers from
Private remediation/redev/brownfields 19 11 -8 postponements of projects dealing with non-functioning cor-
Green building design/construction 20 7 -13 porate or industrial assets that pose some future but not im-
Source: EBJ 2020 & 2019 Snapshot Survey. Question was: Please rate the following service
market areas in terms of prospects for growth in 2020-2021. © 2020 EBI Inc.
Geographic Trends Outside the USA
2020 Rank 2019 Rank
Geographic Trends in North America
Australia/NZ 1 2
2020 Rank 2019 Rank
Nordic Europe 2 6
US: Southern California 1 2 Central America 3 15
US: Northern California 2 3 Japan 4 4
US: Southeast 3 4 Germany 5 10
All United States 4 7 China 6 12
US: Rockies 5 6 Russia 7 17
UK 8 16
US: Midwest 6 12
South America 9 9
US: Gulf Coast/Texas 7 1
Southeast Asia 10 3
US: New England 8 10 India 11 1
US: Pacific Northwest 9 5 France 12 5
US: Southwest/Desert 10 9 Brazil 13 7
US: Mid-Atlantic 11 8 Middle East 14 14
Eastern Canada 12 13 Eastern Europe 15 11
Southern Europe 16 13
Mexico 13 14
Africa 17 8
Western Canada 14 11
Source: EBJ 2020 & 2019 Snapshot Surveys. Question was: International -
Source: EBJ 2020 & 2019 Snapshot Surveys. Question was: North America - Please rate Please rate the regions outside the USA in terms of prospects for growth in
the following regions in terms of prospects for growth in 2020-2021. © 2020 EBI Inc. the next two years. © 2020 EBI Inc.
10 Strategic Information for a Changing IndustryEnvironmental Business Journal, Volume XXXIII, Numbers 5/6, 2020
Economist Intelligence Unit World Economy: May 2020 Forecast Summary
2015 2016 2017 2018 2019 2020 2021 2022 2023 2024
Real GDP growth (%)
World (PPPa exchange rates) 3.4 3.3 3.8 3.5 2.7 -3.4 4.1 3.5 3.5 3.3
World (market exchange rates) 2.8 2.5 3.2 2.9 2.2 -4.2 3.7 2.9 2.8 2.7
US 2.9 1.6 2.4 2.9 2.3 -4.0 2.4 2.2 2.0 1.8
Euro area 2.0 1.9 2.7 1.9 1.2 -8.0 3.8 2.1 1.7 1.6
Europe 2.0 1.9 2.8 2.1 1.5 -7.1 3.4 2.2 1.9 1.7
China 6.9 6.7 6.8 6.6 6.1 1.0 8.0 5.3 5.1 4.7
Asia and Australasia 4.6 4.5 4.9 4.3 3.9 -1.6 5.1 4.0 4.1 3.8
Latin Americab 0.1 -0.3 1.9 1.7 -0.3 -5.4 3.7 2.7 2.7 2.6
Middle East & Africa 2.3 4.9 1.3 1.0 0.2 -4.1 1.4 3.0 3.3 3.4
Sub-Saharan Africa 2.7 0.8 2.3 2.4 2.0 -3.5 1.7 3.7 3.9 4.3
World inflation (%; av)b 3.0 3.1 3.2 3.5 3.5 3.1 3.2 3.3 3.2 3.1
World trade growth (%) 2.2 2.1 5.8 3.7 0.9 -24.8 20.9 4.0 3.8 3.8
Commodities
Oil (US$/barrel; Brent) 52.4 44.0 54.4 71.1 64.0 38.1 44.0 58.5 65.0 62.5
Industrial raw materials -15.2 -2.2 20.2 2.2 -8.6 -8.5 6.5 3.0 5.1 3.0
Food, feedstuffs & beverages -18.4 -3.5 -1.0 1.6 -4.3 0.9 2.0 1.6 1.8 1.5
Source:The Economist Intelligence Unit. a. Purchasing power parity. b. Excludes Venezuela. Commodities in US$ % change
mediate risks to public health, liability or
non-compliance. Year-by-Year Operating Margin Change: 2015-2020
Geographic trends in North America
illustrate the long-term clouds over the oil 2014
& gas and petrochemical industries as the
Gulf Coast region suffered the largest drop
in the 2020 rankings to #7 out of 14 in
2020, down from #1 in the 2019 Outlook. 2015
Western Canada fell to the bottom spot. Down
Regions with resilient, diversified econo-
mies and more progressive state programs Same
like California are expected to fare better 2016
Up
and have ascended in the geographic mar-
ket rankings, as have urbanized regions of
the Midwest and New England, in a some- 2017
what predictable Blue City versus Red
State pattern that has infected U.S. politics
and policy.
2018
Globally environmental companies are
more likely to be conservative in interna-
tional expansion in recessions, and there-
fore will stay closer to home. Or if they 2019
expand outside their borders, they are even
more likely to venture into markets with
the closest cultural ties. Responses to the 0% 10% 20% 30% 40% 50% 60% 70%
Source: Environmental Business Journal 2020, 2019, 2018, 2017, 2016 and 2015 EBJ Snapshot Surveys. ©
EBJ survey seem somewhat anomalous,
2020 EBI Inc.
with Central America and Russia ascend-
Strategic Information for a Changing Industry 11Environmental Business Journal, Volume XXXIII, Numbers 5/6, 2020
EBJ Respondent Opinion on the 2020 Stock Market: S&P 500 ing the rankings for no apparent reason.
However, established economies Australia,
Germany, Japan and the Nordics featured
20%+ gain
in 4 of the top 5 rated regions for growth.
Notable in the emerging economies is China
15-20%
climbing the table and India taking a notice-
able drop, likely reflecting their relative stag-
10-15% es in adjusting to the coronavirus.
5-10% Pertinent to longer-term global planning
is the Economist Intelligence Unit May
1-5% gain
2020 forecast out to 2024 on page 11. Chi-
na is the only region in which EIU expects
GDP growth in 2020, with Europe and the
flat or 1% to -1%
United States expected to suffer alarming
-8% and -4% GDP declines, respectively.
-1 to -5%
The EIU forecasts growth for 2021, but in
most cases not enough to make up for the
-5 to -10%
decline in 2020, and barely perceptible an-
nual growth mostly in the 1.5-2% per year
-10 to -15% range in Europe and the United States from
2022 to 2024. In mid-June 2020 the U.S.
-15 to -20% Federal Reserve announced its forecast, es-
timating that the U.S. economy will shrink
-20% or more 6.5% in 2020 as it promises to keep inter-
est rates close to zero through 2022. The Fed
0% 5% 10% 15% 20% 25% expects the GDP to grow 5% in 2021 and
Source: EBJ 2020 Snapshot Survey; Question was:The S&P 500 gained 29% in 2019 after -4% in 2018, +19% 3.5% in 2022.
in 2017 and +10% in 2016.What do you predict for 2020? n=74, responses in April 2020. © 2020 EBI Inc.
Moody’s Analytics paints a somewhat
EBJ Respondent Opinion on Housing Prices in Next Two Years different but similar picture of the recovery
in its comparison chart to previous U.S.
recessions entitled ‘Not a V-Shaped Recov-
Decline of 10%+ ery’ (see page 15). The dramatic impact of
the economic shutdown and extent of the
drop in GDP by quarter as depicted on the
Decline of 5-10% chart indeed shows a V at the beginning, but
hardly the quick recovery more optimistic
forecasters have hoped for. The Moody’s fore-
Modest Decline of
cast doesn’t show growth returning until the
2-5%
7th quarter from the beginning of the reces-
sion in Q2 2020 for what could be termed
Flat or Stagnant
Markets
a Check-Mark-Shaped Recovery. Only the
financial crisis of 2007 to 2009 lasted longer
than what is expected this time, although the
Modest Market:
Gains of 2-5%
depths of the initial setback was much more
dramatic in 2020, leaving a much bigger hole
to dig out of. The Conference Board June
Good Market: Gains
of 5-10%
2020 forecast estimates a 2020 U.S. GDP de-
cline of 5.7% and adopts a ‘Swoosh-shaped
recovery as its base forecast but doesn’t rule
Strong Market:
Gains of 10%+ out a resurgence of the virus leading to a W-
shaped scenario (see page 61).
0% 10% 20% 30% 40%
Moody’s charting of deviation from ex-
Source: EBJ 2020 Snapshot Survey. Question was:What do you think is the most likely scenario for housing
prices in the next two years. n=74, responses in April 2020. © 2020 EBI Inc. pected GDP growth by sector by month for
the remainder of 2020 shows a somewhat en-
12 Strategic Information for a Changing IndustryEnvironmental Business Journal, Volume XXXIII, Numbers 5/6, 2020
Not a V
‘NotReal
U.S. a V-Shaped
GDP, %Recovery’: U.S.beginning
change since Real GDP of
% recession…
Change Since Beginning of Recession by Quarter
8
6 1980 1990 2001
4 2007 2020
2
0
-2
-4
-6
-8
-10
0 2 4 6 8 10 12
Business Lockdowns Hit Hard
Source: Moody’s Analytics May 2020 presentation; U.S. Bureau of Economic Analysis and Moody’s forecast; X axis is quarters after the beginning of the recession
Sources: BEA, Moody’s Analytics
Deviation from
Business typical U.S.
Lockdowns GDP,Deviation
by Sector: ann ppts, by Typical
From industryor 2020
Expected GDP Growth in 2020
May 2020 10
March April May June July August Sep-Dec
5
-5
Enter Accom. Transp. Wholesale
Manufact. Misc. Real Est. Energy
-15
Constr. Educ. Finance Public admin.
Prof. Other service Info Healthcare
Total
Global
-25 Oil Glut
Source: Moody’s Analytics May 2020 presentation
Mil barrels
Source: Moody’sper day
Analytics
Global Oil Glut: Supply & Demand and Overall Balance (mil bbl/day)
20 110
April 2020 4
Global balance (L)
16 Global demand (R) 105
Global supply (R)
12
100
8
95
4
0 90
-4 85
17Q1 18Q1 19Q1 20Q1
Sources:
Source: International
International Energy Agency, Energy Agency,
Moody’s Analytics May Moody’s Analytics
2020 presentation
April 2020 7
Strategic Information for a Changing Industry 13Environmental Business Journal, Volume XXXIII, Numbers 5/6, 2020
Job Market Will Struggle to Recover
U.S. Job Market Forecast: Job Change & Unemployment Rate 2019-2023
15 10
8.1
13 5
0.5 0.4 0.6 0.6 1.0 1.3 1.4 1.4 1.3 1.2
0.4 0.0
11 0
-0.6 -0.3
9 -5
7 -10
Employment Change (Mil., R)
5 -17.1
-15
Unemployment Rate (L)
3 -20
19 20 21 22
Not Since the Great Depression
Source: Bureau of Labor Statistics, Moody’s Analytics May 2020 presentation
Sources: BLS, Moody’s Analytics
U.S. unemployment rate,U.S.
% Unemployment Rate: 1930-2020
April 2020 16
25
1930s Depression COVID crisis
20 April 2020
15 Fed slays
inflation Financial crisis
WW II
10
5
0
30 40 50 60 70 80 90 00 10 20
Source: U.S. Federal Reserve; Bureau of Economic Analysis; Moody’s Analytics
Sources: Federal Reserve, BEA, Moody’s Analytics
April 2020 14
couraging trend of deceleration in decline Q2 2020 loss of 17 million jobs in the 10 Based on EBJ’s annual surveys that in
from the expected norms of growth, but subsequent quarters. numbers of respondents tilt to the small-
still not enough growth in most categories er and more privately owned companies,
to even register on the chart on the positive EBJ BASELINE FORECAST forecasts for their company and predic-
side, even in the last four months of 2020. So what does this all mean for the en- tions for their industry segment have his-
vironmental industry? It is hard to be op- torically been on the optimistic side, but
Looking at more U.S. federal govern-
timistic, but prudent to be realistic. EBJ not wildly so. A summary of last year’s re-
ment analysis and employment forecasts by
and other engineering consulting and ported growth, and current and next-year
the Bureau of Labor Statistics reveals the
AEC industry analysts generally assert that forecasts for the last four EBJ surveys is
shocking 17 million jobs lost in Q2 2020
environmental executives are among the presented in tabular form on page 7.
and a forecast bounce-back of 8 million
jobs restored in the reopening expected to more optimistic of forecasters, and have The aggregate forecast for EBJ’s 2020
span the 3rd quarter of 2020 as stores, res- historically undershot their forecasts more survey population is -0.4% in 2020 and
taurants, gyms, bars, entertainment venues often than not. (See boxes on page 8.) 2.6% in 2021 for their company—and
and transportation systems slowly open. Other segments and companies hardened -0.3% in 2020 and 2.1% in 2021 for their
But the BLS forecasts net job losses for the by the quarterly cycles of being publicly segment of the industry, And while these
last quarter of 2020 and the 1st quarter of traded or investor-owned like Solid Waste forecasts are certainly more realistic than
2021, with net jobs only positive again in or Water Utilities are understandably more wildly optimistic, we would contend that
the 2nd quarter of 2021. In addition, the ‘realistic’ as a euphemism for ‘cautious’ or the industry as a whole would be fortunate
BLS job forecast out to the end of 2022 ‘negative’ and virtually all have suspended to be 2 points ahead of the economy. If the
still does not anticipate making up for the their guidance on revenues for their cur- U.S. government and EIU global forecast
rent fiscal year.
14 Strategic Information for a Changing IndustryEnvironmental Business Journal, Volume XXXIII, Numbers 5/6, 2020
2020-2021 Environmental Industry Exposure to Key Clients by Segment
Muni W/ Ind’l W/ 2020-2021
Market / EI Segment SWM HWM R/IS C&E Labs RE CC
WW WW Impact Weight
State & Local Gov’t 5 3 2 3 5 1 3 2 4 4
Federal Government 1 3 5 4 2 1 4 2 3 2
Oil & Gas/Resources 2 3 4 4 1 4 2 4 3 5
Power 1 2 4 3 1 4 2 4 3 3
Industrial 3 5 4 3 2 4 3 2 3 3
Commercial 5 3 2 2 4 3 2 4 2 5
Residential 5 2 2 1 4 1 2 4 2 2
Institutional 4 4 2 2 3 3 1 4 3 3
Development 2 2 3 4 1 1 4 2 2 4
Transportation Authorities 1 1 2 3 1 1 2 2 2 3
Environmental Industry 1 3 3 2 2 2 5 2 2 3
Negative Index 100 102 107 105 84 86 97 106 96
Source: Environmental Business Journal June 2020 analysis © 2020 EBI Inc. Rows represent relative exposure of each environmental industry segment to each client market
segment;The final column represents the respective weight put on the client sector for the relative impact of the coronavirus shutdown on the sector; 5 being the highest negative.
Environmental Industry Segments represented include: Solid Waste Management, Hazardous Waste Management, Remediation/Industrial Services, Consulting & Engineering,
Municipal Water/Wastewater, Industrial Water/Wastewater, Labs, Renewable Energy, Climate Change Mitigation and Adaptation & Resilience
is correct in anticipating -6% to -4% in
GDP for 2020, then a -2% to -3% decline
Environmental Industry vs. GDP Growth: 1990-2024
10%
for the environmental industry could be a
viewed as a good result. 8%
But given that the sizeable economic 6%
collapse was based more heavily in service
4%
economy sectors having little impact on
the environmental industry, then perfor- 2%
mance in 2020 of 4 points better then the 0%
overall economy is not outside the realm of 89 91 93 95 97 99 01 03 05 07 09 11 13 15 17 19 21 23
possibility. EBJ believes an interim forecast -2%
between these two numbers or a negative -4% USA GDP growth
2-3% for 2020 is most likely, adding our
-6% Environmental Industry growth
presumption that the U.S. economy will
retract about 5-6% in 2020, but recover -8%
only partially in 2021. Forecasts for each of
EBJ’s 13 environmental industry segments
U.S. Environmental Industry Revenues: 1970-2024
500
have been re-set in a baseline forecast as
depicted on page 16 with further scenarios
being developed for EBJ’s Environmental 400 Resource Segments
Industry Overview edition in late summer. Equipment Segments
300 Service Segments
Another trend in survey responses that
can’t escape comment is the comparison of
environmental industry executive forecasts 200
for their own companies versus for their
segment of the industry. Here 2020 was the 100
first year that environmental companies in
aggregate forecast better performance for
0
their segment than for their own company.
1970 1975 1980 1985 1990 1995 2000 2005 2010 2015 2020
The rows labeled “Co-Segment Delta” on Source: EBI Inc; EBI annual models of the U.S. environmental industry based on segment-by-segment models
page 7 show a simple product of subtract-
Strategic Information for a Changing Industry 15Environmental Business Journal, Volume XXXIII, Numbers 5/6, 2020
U.S. Environmental Industry Forecast: Pre- and Post-COVID ($billion in current $)
Pre-COVID Forecast: January 2020
INDUSTRY SEGMENT 2019 2020 2021 2022 2023 2024
SERVICES
Analytical Services 2.1 2.1 2.2 2.2 2.3 2.3
Wastewater Treatment Works 65.3 67.7 70.7 73.2 75.8 78.3
Solid Waste Management 66.4 68.3 69.6 70.8 72.0 73.2
Hazardous Waste Management 11.0 11.1 11.1 11.2 11.2 11.2
Remediation/Industrial Services 14.4 14.6 14.8 15.0 15.2 15.3
Consulting & Engineering 33.8 34.8 35.8 36.8 37.8 38.7
EQUIPMENT
Water Equipment and Chemicals 33.8 34.7 35.7 36.6 37.7 38.7
Instruments & Information Sys 8.3 8.7 9.2 9.7 10.2 10.7
Air Pollution Control Equipment 17.2 17.1 17.0 16.8 16.7 16.5
Waste Management Equipment 16.0 16.3 16.7 17.0 17.4 17.8
RESOURCES
Water Utilities 64.4 67.1 69.9 72.7 75.6 78.6
Resource Recovery 21.6 22.1 22.5 22.9 23.4 23.9
Clean Energy Systems & Power 54.8 59.5 64.0 68.2 71.9 75.2
TOTAL INDUSTRY: 408.9 424.0 439.1 453.3 467.1 480.5
Industry Growth: 3.7% 3.7% 3.5% 3.2% 3.1% 2.9%
Post-COVID Forecast: June 2020
INDUSTRY SEGMENT 2019 2020 2021 2022 2023 2024
SERVICES
Analytical Services 2.1 2.0 2.1 2.1 2.2 2.2
Wastewater Treatment Works 65.3 64.7 67.0 69.3 71.7 74.1
Solid Waste Management 66.4 64.6 65.9 67.0 68.2 69.3
Hazardous Waste Management 11.0 10.4 10.4 10.5 10.5 10.5
Remediation/Industrial Services 14.4 13.7 13.9 14.1 14.3 14.5
Consulting & Engineering 33.8 33.0 34.1 35.0 36.0 37.0
EQUIPMENT
Water Equipment and Chemicals 33.8 32.7 33.6 34.6 35.5 36.5
Instruments & Information Sys 8.3 8.2 8.6 9.0 9.5 10.0
Air Pollution Control Equipment 17.2 15.8 15.6 15.5 15.3 15.2
Waste Management Equipment 16.0 15.4 15.8 16.1 16.5 16.8
RESOURCES
Water Utilities 64.4 63.7 65.8 68.2 70.7 73.2
Resource Recovery 21.6 19.6 20.0 20.4 20.8 21.2
Clean Energy Systems & Power 54.8 56.7 61.0 65.0 68.6 71.7
TOTAL INDUSTRY: 408.9 400.6 413.8 426.9 439.9 452.3
AVERAGE GROWTH RATE: 3.7% -2.0% 3.3% 3.2% 3.0% 2.8%
Source: Environmental Business International, Inc., San Diego, CA, units in $billion.; Annual models of the U.S. environmental industry based on segment-by-segment analysis
© 2020 EBI Inc. EBI environmental industry forecast is updated on a quarterly basis depending on new inputs derivied from surveys, interviews, secondary data or economic and
government statistics on client sectors or environmental industry segments.
16 Strategic Information for a Changing IndustryEnvironmental Business Journal, Volume XXXIII, Numbers 5/6, 2020
ing the segment growth forecast from the billion in environmental industry revenue A long-awaited infrastructure bill may
company growth forecast for the current in 2020, with the drop from 3.7% growth indeed materialize, but limitations on
year of the survey and the outlook year or forecast in the pre-COVID era to -2.0% funding will likely make it less impact-
one year into the future. Historically this for 2020 in midst of the COVID era. ful than many once foresaw, and woefully
delta was usually in the 2-3 percentage Ironically many analysts and economists short of U.S. infrastructure needs. A New
point range, showing the optimistic nature have been referring to the inevitability of Deal type of public works program remi-
of companies expecting to outperform the ‘the next recession’ for some time given the niscent of the 1930s recovery from the
market. (The Co-Segment Delta was 3.1 fairly consistent recent 10-year cycles of Great Depression is a distinct possibility,
percentage points different in 2017 for the recessions. Although such talk was more though likely more the product of a Dem-
‘current year’ as a fairly representative ex- prevalent in 2018 than in 2019 and early ocratic than a Republican administration.
ample of surveys previous to 2017.) But 2020, it was widely presumed and assumed At this point the objective is more to con-
this delta has narrowed noticeably in the that a recession of undetermined induction tain the recession enough so as not to let
last four years of EBJ surveys as we pre- was on the horizon. But it’s fair to say the it become the Coronavirus Depression,
sume executives increasingly see their firms timing and severity of the coronoavirus re- regardless of the hue such a New Deal of
as less ‘exceptional’. cession was completely unexpected. 2021 will be branded. So while we believe
the impact of the coronavirus shutdown in
More granular than an environmental- Much will be written about the lack of
anticipation and preparedness for the pan- 2020 will be more negative on the overall
industry-wide forecast based on historical
demic—and the initial under-reaction and economy than on the environmental in-
comparisons to the economy in a post-
possible later over-reaction to the virus— dustry, we expect environmental industry
recession period, is an analysis of segment-
but perhaps it will heighten the awareness growth in 2021 to lag the U.S. economy
by-segment exposure to the most afflicted
of the fragility of biological systems here and possibly also in 2022.
client sectors. The table on page 15 lists
key environmental industry segments in on Earth, and humankind’s role in disrupt- In the grand scheme of things, as the
vertical columns and key client sectors in ing what are proving to be more delicately chart at the bottom of page 15 illustrates,
horizontal rows, and measures each seg- balanced resource systems than even many the long-term prospects for environmen-
ment’s exposure to the negative impacts ecologists imagined. The atmosphere is one tal industry growth remain pretty secure.
from coronavirus in a subjective 1 to 5 thing, but while Sunday school also taught Short-term hitches in 2009 and 2020 are
rating. We then combine that with an im- many of us that we had dominion over ev- not to be sneezed at but hardly take gen-
pact weighting of each sector based on the ery creature that crawleth upon the Earth, erations to recover from. Most environ-
extent of its exposure to the 2020 corona- it didn’t command that we eat each and ev- mental companies have been shocked by
virus economic shutdown and related mat- ery last one of them. the global pandemic and forced to adjust
ters. The product of these factors gives us a For the big picture on the environmen- to a series of ‘new normals’ such as digital
crude negative index rating that ranks the tal industry, the graph on page 15 shows meetings, working at home, and the aban-
segments in terms of exposure to the eco- a comparison of environmental industry donment of the handshake. But few if any
nomic conditions in 2020, offering guid- growth to the U.S. GDP through the last are contemplating an existential crisis of
ance to segment and company forecasts. 35 years—and through the last four reces- whether or not their business or the envi-
sionary cycles, including EBJ’s forecast for ronmental industry can survive.
The C&E segment does not fare too
well compared to the other segments, but the Coronavirus Recession. The resiliency The assembled comments of EBJ’s 2020
it is fair to note that the broad diversifica- of the environmental industry is perhaps survey community following this review
tion of its client universe counts against it more apparent in the past three recessions are indicative of the resilience of the com-
in this crude model as all client sectors are when observing the chart, and particularly panies and people that make up the envi-
in the recovery years of 2010 and 2011
weighted in the negative. However, given ronmental industry. They also illustrate the
when the aforementioned ARRA provid-
that each company is exposed at different variety of conditions and situations that
levels to each of these major client sectors, ed more opportunities to environmental have been endured, and the reactions of
it can be a useful instrument to rate sus- companies than many other sectors. We the industry and its participants have had
ceptibility to the current situation between believe the Coronavirus Recession recov- to make since March 2020. We have been
companies in the same segment. ery period will not feature such stimulus subjected to a crisis of global proportions,
or Congressional acts that will support en- and it is not over yet. Some say the worst
EBI’s June 2020 forecast for the entire vironmental companies to a greater extent is behind us and the storm clouds have
environmental industry out to 2024 is pre- than other more needy sectors. Consumer passed; others say the worst is yet to come.
sented at the bottom of page 16 to com- services sectors are more likely to be the Regardless, the world and the environmen-
pare with January 2020—or a pre-COVID focus of support in order to bring relief to tal industry has become more aware and
versus post-COVID forecast comparison. families and get more Americans back to possibly more in tune with the economy,
Segment-by-segment adjustments to the work in 2020—but first paying people not communities, people, and viruses around
EBI forecast model based on a variety of to work then giving them spending money
us. We just wonder what it all looks like
inputs result in a loss of more than $20 is hardly a blueprint for a recovery.
from space. ¤
Strategic Information for a Changing Industry 17You can also read