COVID-19 Disease Outbreak Outlook Arizona and Pima County - Tucson Weekly
←
→
Page content transcription
If your browser does not render page correctly, please read the page content below
COVID-19 Disease Outbreak Outlook
                                        Arizona and Pima County
                                                   Updated January 7, 2022

Disclaimer: This information represents my personal views and not those of The University of Arizona, the Zuckerman College of Public
Health, or any other government entity. Any opinions, forecasts, or corresponding recommendations should be considered in conjunction
with other corroborating and conflicting data. Past updates can be accessed at https://publichealth.arizona.edu/news/2021/covid-19-
forecast-model.

    For the week ending January 2nd, 53207 Arizonans were diagnosed with COVID-19, a 120% increase from
the 24196 cases reported during the prior week (Figure 1). The largest weekly pandemic total, 64981 cases,
occurred the week ending January 10, 2021. We will almost certainly exceed this sum in next week’s report.
Cases are currently being diagnosed at a rate of 731 cases per 100K residents per week. Rates are highest
among those 15 – 24 years, 1005 cases per 100K residents. They are lowest among those ≥65 years and 50
years to ward off infection from the newly dominant Omicron variant.

  Figure 1. Weekly COVID-19 Cases in Arizona and Number of Individuals Undergoing COVID-19 Diagnostic Testing
  March 1, 2020 – January 2, 2022.
Created by Joe K. Gerald, MD, PhD (Associate Professor, Zuckerman College of Public Health, geraldj@email.arizona.edu)
with assistance from Patrick Wightman, PhD from the UA Center for Population Health Sciences.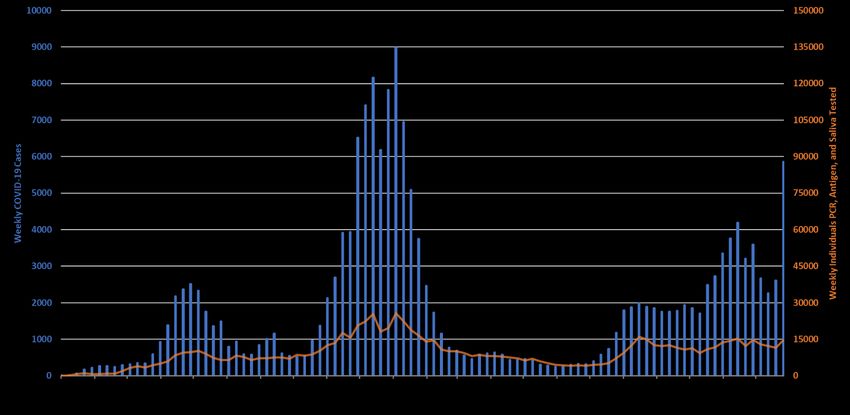
Figure 2a. COVID-19 Cases in Arizona by Age Group March 7 – January 2, 2022 (Data from week ending November
 28 suppressed).

    Figure 2a shows transmission among all age groups is increasing; however, the largest increases are among
adolescents and working-age adults. These findings are consistent with Omicron’s early impact in other states
and countries. Figure 2b shows transmission among children is also increasing with the largest increases among
adolescents. Resumption of in-person activities among K – 12 and higher education couldn’t occur at a worse
time. Given the background rate of community transmission, many schools will struggle to implement effective
mitigation protections. Expect high rates of absenteeism among students, faculty, and staff throughout January.

  Figure 2b. COVID-19 Cases in Arizona among Children by Age Group March 7 – January 2, 2022. (Data from week
  ending November 28 suppressed).

Created by Joe K. Gerald, MD, PhD (Associate Professor, Zuckerman College of Public Health, geraldj@email.arizona.edu)
with assistance from Patrick Wightman, PhD from the UA Center for Population Health Sciences.
Test positivity exploded this week rising to 50%. Obviously, testing remains inadequate for public health
practice and many cases are going undiagnosed (Figure 3). Test positivity below = individuals with any positive
test in the past week / all unique individuals who have a test result in the past week. This formula will tend to
yield higher values than elsewhere. At-home tests, also contribute to under-reporting because few results are
transmitted to authorities.
Figure 3. Weekly Number of Patients Undergoing Traditional Nasopharyngeal PCR Testing and Associated Percent
Positivity March 1, 2020 – January 2, 2022.
As of January 6th, 2562 (29%) of Arizona’s 8769 general ward beds were occupied by COVID-19 patients,
a 12% increase from last week’s 2283 occupied beds (Figure 4 and Figure 5 Panel A). Another 483 (5%) beds
remained available for use which is lower than last week’s 555 available beds. Six-hundred eight (608, 37%) of
Arizona’s 1667 ICU beds were occupied by COVID-19 patients, a 1% decrease from last week’s 613 occupied
beds (Figure 4 and Figure 5 Panel B). An additional 95 (6%) ICU beds remained available for use which is lower
than last week’s 116 beds.
Figure 4. Arizona Daily COVID-19 General Ward and ICU Census April 9, 2020 – January 6, 2022.
Created by Joe K. Gerald, MD, PhD (Associate Professor, Zuckerman College of Public Health, geraldj@email.arizona.edu)
with assistance from Patrick Wightman, PhD from the UA Center for Population Health Sciences.While peak occupancy will not reach prior levels, the Delta, and now Omicron, waves have placed much
higher levels of chronic stress on our health system. We have so far seen 146 consecutive days with a
combined occupancy >2000 patients whereas the summer 2020 and winter 2021 waves saw 57 and 98 days,
respectively. Until last week, we had experienced 37 consecutive days with >3000 combined occupancy whereas
the summer 2020 and winter 2021 waves saw 35 and 78 days, respectively. After a 10-day respite over
Christmas-New Years, we are once again >3000 combined occupancy (last 4 days).
Figure 5. COVID-19 Occupancy as a Percent of Listed General Ward (A, left) and ICU (B, right) Capacity in Arizona
April 20, 2020 – January 6, 2022.
Hospital occupancy remains far above seasonal levels with safety margins, as measured by available beds,
just above historical lows (Figure 6). Hospitals should prepare for >25% ward occupancy and >35% ICU
occupancy for some time to come. There is no let-up in sight!
Figure 6. Observed Excess Non-Surge General Ward and ICU Capacity in Arizona March 26, 2020 – Jan 6, 2022.
Created by Joe K. Gerald, MD, PhD (Associate Professor, Zuckerman College of Public Health, geraldj@email.arizona.edu)
with assistance from Patrick Wightman, PhD from the UA Center for Population Health Sciences.The week ending December 12th has now recorded 511 deaths to date, crossing the 500 deaths per week
threshold for the first time during the Delta wave (Figure 7). At least 24616 Arizonans have lost their lives to
COVID-19. However, as an updated mortality report from the Arizona Public Health Association indicates, excess
deaths are considerably higher than the official COVID-19 death statistics. Also, a new report indicates the life
expectancy fell the largest amount in 75 years from 78.8 years (2019) to 70.0 years (2020), a drop of 1.8 years.
Figure 7. Weekly Arizona COVID-19 Deaths March 16, 2020 – January 2, 2022.
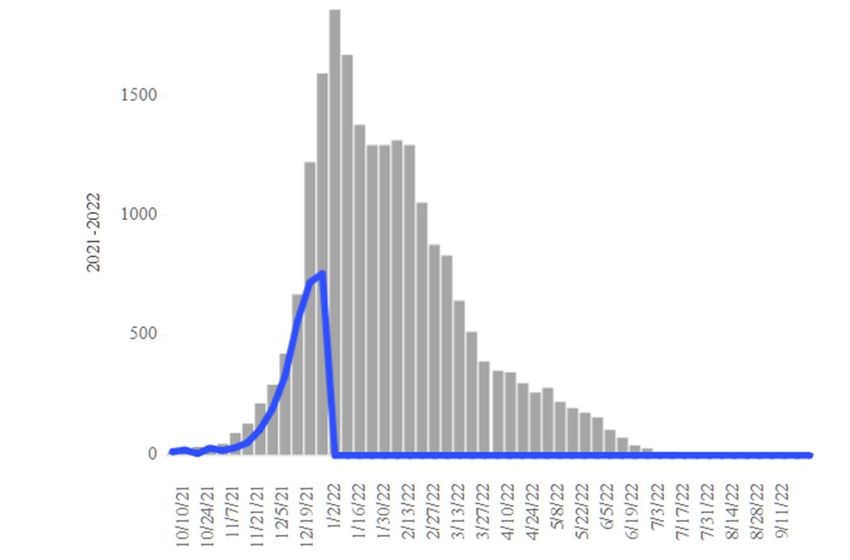
Seasonal influenza cases in Arizona (blue line) remain below the 5-year historical average (grey bars, Figure
8) with a marked departure over the past two weeks suggesting individual COVID-19 mitigation efforts may be
paying dividends for the less transmissible flu virus. Continued observation over the next 4 weeks is warranted.
Figure 8. Arizona Influenza Cases in 2021 (blue) versus 5-Year Historical Average (grey)
Created by Joe K. Gerald, MD, PhD (Associate Professor, Zuckerman College of Public Health, geraldj@email.arizona.edu)
with assistance from Patrick Wightman, PhD from the UA Center for Population Health Sciences.Pima County
For the week ending January 2nd, 5858 Pima County residents were diagnosed with COVID-19, a 125%
increase from the initial tally of 2607 cases last week (Figure 9). Trends across the various age groups show
rapidly increasing local transmission across all age groups consistent with the overall state data (Figure 10).
Figure 9. Weekly COVID-19 Cases in Pima County and Number of Individuals Undergoing COVID-19 Diagnostic
Testing March 1, 2020 – January 2, 2022.
Figure 10. COVID-19 Cases in Pima County by Age Group March 7, 2020 – January 2, 2022. (Data from week
ending November 28 are suppressed).
Created by Joe K. Gerald, MD, PhD (Associate Professor, Zuckerman College of Public Health, geraldj@email.arizona.edu)
with assistance from Patrick Wightman, PhD from the UA Center for Population Health Sciences.Summary:
• Arizona is experiencing historic levels of community transmission attributable to the newly dominant
Omicron variant. Test positivity is extremely high reminding us that test capacity, accessibility, and/or
uptake is wholly inadequate. Arizona, like much of the United States, is in the midst of another large
pandemic wave. Expect transmission to peak in late January with very large numbers of hospitalizations
continuing into February. The greatest burden on our health care system will shift towards emergency
department and general wards and away from our ICU facilities.
o As of January 2nd, new cases were being diagnosed at a rate of 731 cases per 100K
residents per week. Given the experience of eastern states, we can expect this rate to at least
triple before the end of the month.
o Mask mandates are urgently needed at municipal and county levels to reduce
transmission, blunt the worst of the Omicron wave, and relieve overwhelmed hospitals.
Regardless of public action, individuals should mask in indoor settings using a well-fitting KN-95
or better mask.
• Waning vaccine immunity makes it imperative that all adults who were previously vaccinated
obtain a booster, particularly those 50+ years of age.
o Risk factors for breakthrough hospitalization and death were recently elucidated in the British
Medical Journal: https://www.bmj.com/content/374/bmj.n2244. These findings were replicated in
the MMWR with poor outcomes among those age >40 years, immunocompromised or with
underlying chronic illness. https://www.cdc.gov/mmwr/volumes/71/wr/mm7101a4.htm
• COVID-19 hospital occupancy is once again increasing and should continue to do so throughout
January. Hospitals should prepare for >25% occupancy in general wards and >35% occupancy in
the ICU. Access to care will continue to be even further restricted in the face of looming staff shortages
owing to infections among healthcare workers.
o January is poised to be a very difficult month for Arizona hospitals with the tail of the Delta wave,
below average but still meaningful seasonal influenza, and a large Omicron wave.
o While not ideal, the 2-dose Pfizer primary sequence provided 70% protection against
hospitalization in South Africa during their Omicron wave. Therefore, our immunity wall may
hold just enough to prevent collapse of our hospital systems, but it will be close
https://www.nejm.org/doi/full/10.1056/NEJMc2119270
o For those willing to read, INARC has released a detailed report documenting how Omicron
changed utilization and outcomes among ICUs in England. https://www.icnarc.org/our-
audit/audits/cmp/reports
• Weekly COVID-19 deaths have now reached 500 per week and should remain near this level even
in the face of growing community immunity and less virulent Omicron variant. So far, 24616
Arizonans have lost their lives to COVID-19.
o As an updated mortality report from the Arizona Public Health Association indicates excess
deaths are considerably higher than the official COVID-19 statistics.
o The CDC recently documented the largest decline in life expectancy in 75 years
https://www.cdc.gov/nchs/products/databriefs/db427.htm
• The United Kingdom continues to publish excellent summaries of Omicron’s impact (Dec 31):
https://assets.publishing.service.gov.uk/government/uploads/system/uploads/attachment_data/file/1044481/T
echnical-Briefing-31-Dec-2021-Omicron_severity_update.pdf
Created by Joe K. Gerald, MD, PhD (Associate Professor, Zuckerman College of Public Health, geraldj@email.arizona.edu)
with assistance from Patrick Wightman, PhD from the UA Center for Population Health Sciences.Appendix Figure 1A. Minimum, Maximum and Current COVID-19 Cases Rates by County April 1, 2020 – January 2, 2022. Figure 2A. COVID-19 Cases in Arizona by Age Group March 1, 2020 – January 2, 2022. Created by Joe K. Gerald, MD, PhD (Associate Professor, Zuckerman College of Public Health, geraldj@email.arizona.edu) with assistance from Patrick Wightman, PhD from the UA Center for Population Health Sciences.
You can also read