COVID-19 Snapshot Monitoring (COSMO) Saudi Arabia - Wave 1 - PsychArchives
←
→
Page content transcription
If your browser does not render page correctly, please read the page content below
COVID-19 Snapshot Monitoring (COSMO) Saudi Arabia - Wave 1
Results from repeated cross-sectional monitoring of knowledge, risk perception, protective
behaviour and trust during the current outbreak in Saudi Arabia

Nurah M Alamro, MD. DrPH.1,2,3, Lyan H Almana1, Abeer A Alabduljabbar1, Aljoharah I Alshunaifi1,
Mashel M AlKahtani1, Rema A AlDihan1, Alanoud K Almansour1, Nada A Alobaid1, Norah M
AlOthaim1

   1. College of Medicine, King Saud University, Riyadh, Saudi Arabia
   2. Department of Family and Community Medicine, King Saud University Medical City,
      Riyadh, Saudi Arabia
   3. Prince Sattam bin Abdulaziz Research Chair for Epidemiology and Public Health, King Saud
      University, Riyadh, Saudi Arabia

Target

The aim of this study is to assess changes in risk perceptions, the level of knowledge, trusted
sources of information, trust in healthcare workers, correct knowledge about and uptake of
preparedness and protective behaviours. As well as, to explore how changes in risk
perceptions relate to characteristics of the outbreak and other psychological variables such as
knowledge, affect, and misinformation. It also aims at exploring the relationship between
psychological variables and characteristics of the outbreak situation (i.e. how closely the
perceived risk mirrors reported cases, relative import risk, media reports).

Such information gained from our study intends to serve different sectors of the society. For
example, it can serve authorities by understanding what affects people's perception and
protective behaviour thus it helps in the distribution of efforts and available resources. Not
only does it serve the general population but also the different stakeholders across
government, private sector, and third sector.

All data and conclusions are to be regarded as provisional and are subject to constant change.
A review team of academic colleagues also ensures the quality of the data and conclusions.
Despite the greatest scientific care and the multiple-eyes principle, the participating scientists
are not liable for the content.

                                                                                                 1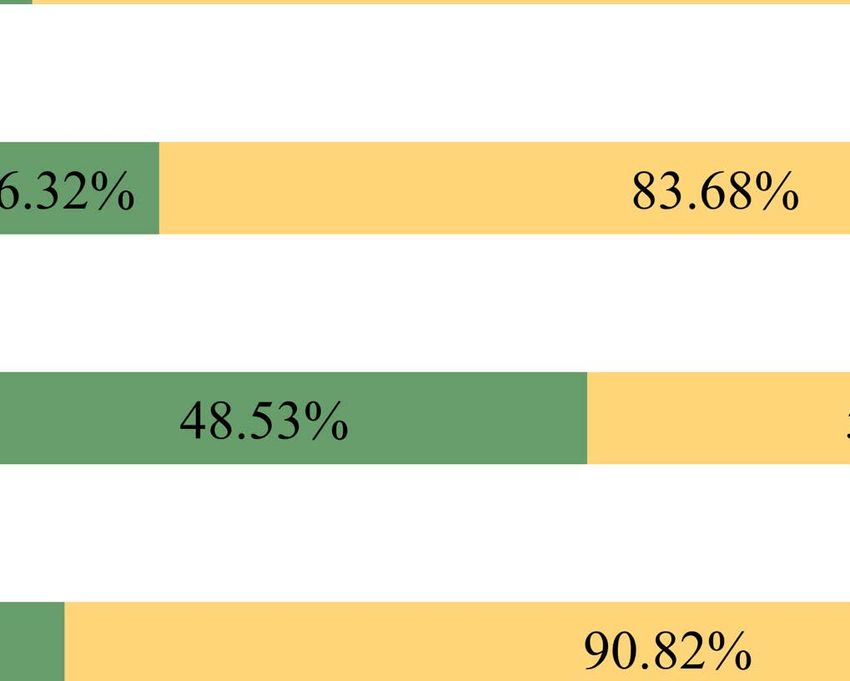
Information about COVID-19 and the outbreak

Important: Here you will NOT find any information about COVID-19 and the pandemic in
Saudi Arabia. If you are looking for that, please click here:
Ministry Of Health:
https://www.moh.gov.sa/en/HealthAwareness/EducationalContent/PublicHealth/Pages/coron
a.aspx
COSMO Saudi Arabia Study protocol1: http://dx.doi.org/10.23668/psycharchives.2878
Contact: nmalamro@ksu.edu.sa

1. Summary

1.1. Results of the current wave

Analysis of the 1st wave data collection (Date 29.04.2020 - 30.04.2020). The data collection
takes place every two weeks.

2984 respondents filled out the online questionnaire which was shared via social media for
higher reach. We used an IP-Based duplicate protection system to avoid participants to
respond to the link survey more than once. IP addresses can be traced to a single device,
proxy server, or group of devices on the same network, but can’t be traced to an individual
person. This procedure ensures both anonymity of participants and identification of
duplicates.

Psychological Situation:

30% of the population estimated their probability of getting infected with the new
coronavirus as likely/very likely. 50% of the population perceived their probability of getting
infected with the new coronavirus as neither likely nor unlikely. While 20% perceived their
probability of getting infected with the new coronavirus as unlikely/very unlikely. Around
31% of the population believed that they are susceptible/very susceptible to an infection with
the new coronavirus, while 22% believed they are insusceptible/very insusceptible. Around
70% of the population perceived the disease as moderately to very severe. 46.1% of the
population reported that they think about the new coronavirus frequently and 42.19%
reported that they find it worrying. Around third of the population found the new coronavirus
to be fear inducing. All the findings might change with time and events; and it will be shown
in the following waves from upcoming data collection.

Higher risk perception was seen in older people, those who are or might be infected with the
new coronavirus, those who know anyone who is or might be infected with the new

                                                                                               2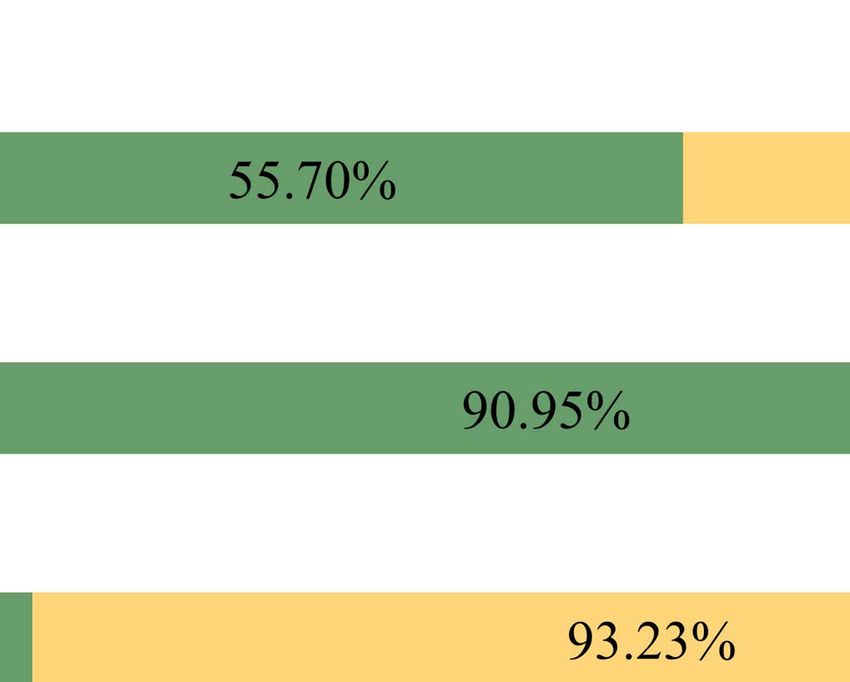
coronavirus, healthcare workers, people with higher incomes, those who feel that the new
coronavirus is close, makes them feel helpless, makes them feel worried and people with
chronic diseases. On the other hand, lower risk perception was seen in females and those who
take ineffective protective measures. Although low severity risk perception was seen with
people who have higher incomes and higher education; high levels of probability and
susceptibility risk perception was seen in them. High severity risk perception was seen in
Saudis, those who received the flu vaccine in 2019 and those who feel that the new
coronavirus is fear inducing. High probability risk perception was seen in those who feel that
COVID-19 is new to them and something they think about. Low susceptibility risk
perception was seen in those who feel that the new coronavirus is spreading slowly.

Knowledge and Behaviour:

Overall, the population is well informed about transmission routes, incubation times and
effective protective behaviours. Almost all of the population knew that avoiding close contact
with infected others, cough hygiene, avoiding crowds, staying home when sick, and social
distancing are effective. Approximately 20% didn’t know that washing hands for 20 seconds
is effective.

On a subjective level, respondents felt well informed about COVID-19 and protection
options. Yet perceived and actual knowledge about COVID-19 were very weakly related. In
addition, feeling like you know how to protect yourself from COVID-19 and actually taken
effective protective behaviour were also weakly related.

Effective protective behaviour was taken more by people who are older and by people with
higher levels of actual knowledge of COVID-19.

Knowing someone who is or might be infected with the new coronavirus had little impact on
effective protective behaviour and ineffective protective behaviour. But people who
personally knew a suspected/confirmed case in their environment perceived more risk
(probability, susceptibility).

Adverse Behaviour

Actionism (taking ineffective protective behaviour such as taking herbal supplements) was
relatively low, with the highest actionism percentage being taking precaution when opening
packages. While the lowest actionism percentage was avoiding eating meat. Actionism was
seen more in older people, females, people with higher actual knowledge and in those who
feel that COVID-19 is media hyped. Less actionism was seen in people who believed they
have a low probability of being infected with COVID-19.

                                                                                             3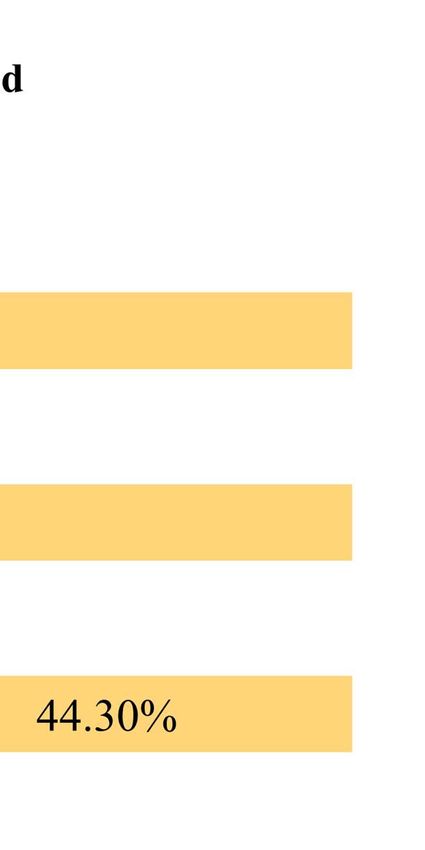
Individual Pandemic Preparation

A very small percentage of the population bought extra disinfectants and regular medications
or was planning to do so. On the contrary, more than half of the population stayed away from
social events and avoided people who came from infected countries but only around a quarter
of the population are planning to do so. Less than 6% of the population bought food supplies
on a large scale or are planning to do so. Pandemic preparation was seen more in people who
trust healthcare workers, in those who believe that COVID-19 would infect them severely
and in people who feel that the new coronavirus is close.

Sources of Information

To find information about the new coronavirus, our participants ranked the following sources
as the most relevant: Consultation with healthcare workers, Television channels, social media
and online news pages. In general, participants were feeling that the new coronavirus is
somewhat not media hyped.

1.2. Change to the previous wave
In the future you will find a comparison with the previous survey here.

2. Conclusions (based on our data analysis; recommendations)

Implementing Protective Behaviour:

The level of actual knowledge was high among the population, yet it was lower than the
perceived level of knowledge. The majority of people were feeling sure about the protective
measures and were actually implementing them.

Managing Risk Perception:

Younger people, those who were not infected with the new coronavirus and those who feel
that the new coronavirus is spreading slowly have low perception of susceptibility. This
might actually affect their implementation of protective measures. We recommend clarifying
that immunity varies among individuals and the perceived immunity might not be always
accurate.

                                                                                              4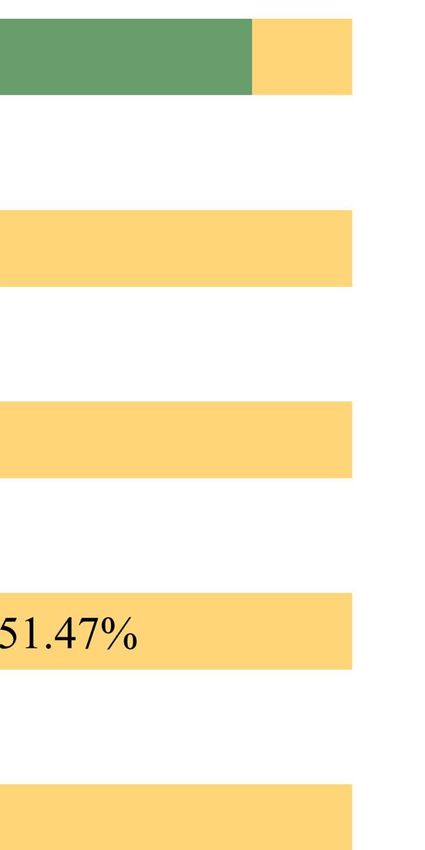
Precautionary Purchases:

People who feel that the new coronavirus is close to them were more likely to buy extra food
supplies. While those who perceived the new coronavirus as media hyped were more likely to
buy extra medications and disinfectants. People who search for information about the new
coronavirus more frequently were more likely to buy extra disinfectants.

Information Seeking Behaviour

71% of the population were searching for information about the new coronavirus frequently.
The most used sources of information were social media and online websites. The most
trusted and the most relevant sources were consultations with health care workers and TV
channels. Moreover, the most needed type of information were details about the curfew and
scientific progress in development of the treatment and the vaccine.

3. The Pandemic Status:
The reported total number of COVID-19 cases during the period of data collection was 21402
with the following breakdown: 18292 active cases, 2953 recovered cases, 157 deaths, and
125 critical cases.

Saudi Arabia has instated early measures and below are key measures that were in place
during the period of data collection:
1- Suspension of entry for Umrah in Mecca.
2- Schools closure
3- Mosques closure
4- Travel bans to and from Saudi Arabia.
5- Travel bans between administrative regions of Saudi Arabia.
6- Work from distance.
7- Partial curfew from 5 pm to 9 am in most administrative regions of Saudi Arabia
    excluding Makkah and previously isolated districts which remained under a 24-hour
    curfew.

4. Methods2
4.1. The Sample
The study was conducted with an online electronic survey employing convenience sampling
technique using an IP-Based duplicate protection system to avoid participants to respond to
the link survey more than once. Data was collected through a 20 minutes web link from
citizens of Saudi Arabia (Saudis and Non-Saudis) that are 18 years and older. We got 2984
complete responses in the first wave which was opened for 24 hours on 29\04\2020.

                                                                                              5
4.2. Measurements
• Demographic Data:
Age, gender, education, size of residence, region of residence, working in the health
sector, chronic illnesses, the number of inhabitants living in the same residence,
having children living in the same residence, marital status, monthly income,
nationality and whether they are currently in Saudi Arabia or not and if not which
country are they at.
• Risk Perceptions3:
3 questions about perceived susceptibility, probability and severity of infection,
answers are assessed on 5-point scale.
• Perceived and Actual knowledge about the New Coronavirus and COVID-19:
Perceived Knowledge4:
3 questions about awareness and level on knowledge of the new coronavirus
Actual Knowledge:
- Groups at risk of severe illness related to the new coronavirus (8 items, e.g.
Pregnant women) assessed by 3-points scale.
- Symptoms of the new coronavirus, (9 items, e.g. Fever) assessed by 3- points
scale.
- General knowledge of COVID-19 with items for the correct treatment,
transmission path, incubation time and immunity against the new coronavirus.
• Infection with the New Coronavirus:
3 questions about being infected or knowing people that have been infected with the
new coronavirus, answers are assessed by 4-points scale.
• Feeling Prepared (self-efficacy):
2 questions about protection 5 and avoiding6 an infection with the new coronavirus,
assessed by 5-points scale.
• Knowledge about and Uptake of Preparedness and Protective Behaviours:
- Questions about effectiveness and actual applications of the recommended
protective measures7 e.g. social distancing, we also included items for
distraction (actionism) e.g. Avoid eating meat to look for irrelevant protective
behaviour.
- 19 items about the knowledge of effective measures to prevent the spread and
infection of the new coronavirus e.g.: hand washing for 20 seconds.
- 18 items about the measures taken to prevent infection of the new coronavirus
e.g.: hand washing for 20 seconds.
6• Information Seeking Behaviour:
Information search frequency: Question about frequency of searching
Information about the new coronavirus answers are assessed on 5-point scale.
Trust and frequency of use: 9 items about trust8,9 and frequency of use for
different media e.g. Newspapers and assessed by a 5-point scale.
Type of information needed: 9 items about information needed the most e.g.
Symptoms of the new coronavirus.
• Public life Restoration after Curfew
8 items about public life restoration after curfew e.g. only people over the age of 70
should stay at home, assessed by 5-point scale.
• Feelings and Behaviours:
Seeing people: 2 items about emotions related to not seeing friends and family,
assessed by 5-point scale.
Spread control plan implementation and crisis Behaviour: 9 items about
spread control plan implementation and crisis behaviour e.g. Bought food supplies
on a large scale, assessed by 3-point scale.
• Risk Perception of Influenza
3 items about probability, severity and vulnerability of getting influenza10, assessed
by 5-point scale.
• Influenza Vaccine
Question about receiving the seasonal influenza vaccine in 2019.
• Policies
9 items about acceptance of policies, vaccine and resurrections, assessed by 5-point
scale.
• Affective Assessment:
8 items about the new coronavirus and how it feels 11 is assessed by 5-point scale e.g.
(1) worrying - (5) not worrying and (1) spreading slowly - (2) spreading fast.
• Resilience
Resilience12 is measured using the Brief Resilience Scale e.g. I don't need much time,
to recover from a stressful event assessed by 5-point scale.
• Fears
9 items about fears13 e.g. losing someone I love assessed by 5-point scale.
74.3.! Execution The online survey was carried out for test subjects from Wednesday 29/4/2020 till Thursday 30/4/2020. All subjects were actively consented to data processing. Based on the socio- demographic data, subjects who are under the age of 18 were filtered out. Subjects who accepted to participate in the survey were given instructions and if necessary, a brief explanation of the new coronavirus and the current outbreak. The online survey was shared via social media for higher reach, we used an IP-Based duplicate protection system to avoid participants to respond to the link survey more than once. IP addresses can be traced to a single device, proxy server, or group of devices on the same network, but can’t be traced to an individual person. This procedure ensures both anonymity of participants and identification of duplicates. 5.! Psychological Situation Risk perception can be defined as the individual’s judgement regarding a threat, thus it plays an important role in the process of decision making, health behaviour, and emotions such as fear, stress, or feeling threatened. 5.1.! Risk Perception The following three graphs show different aspects of risk perception in the course of the survey. ! 8
!

!

!   9
5.2.! Coronavirus and Emotions

The following three graphs show different emotional aspects about the course of the surveys.
!

                                              !
                                              !

!                                                                                         10
! ! ! ! 11
5.3.! Perceived and Actual Knowledge

Actual knowledge, feeling prepared and self-efficacy to avoid an infection with the
coronavirus are important factors as they enable protective behaviour.

The following graph shows this wave’s level of and difference in perceived and actual levels
of knowledge.

           How would you rate your knowledge level on the new coronavirus?
                              Overview of actual knowledge
Actual knowledge of the participants about the name of the virus, treatment options,
vector and incubation period;

The graph shows mean perceived and actual knowledge over time. Error bars are 95% CI.

!                                                                                         12
5.4.! Preparedness The following graphs show mean preparedness and self-efficacy over time. Error bars are 95% CI. ! 13
! 14
5.5. Relationships
The following examine how strongly subjective assessments are related to actual knowledge
and behaviour.

Interpretation: In the following overview, higher values indicate a stronger connection, values close
to zero show that there is no connection. Values around 0.3 show a medium relationship, from 0.5 one
speaks of a strong relationship. A negative sign means that high values occur on one variable with
low values on the other variable. Bold print shows statistically significant relationships.

    •   Correlation:
           o Perceived knowledge and actual knowledge about COVID-19: 0.12
           o Find it easy to avoid an infection with the new coronavirus and protective
              behaviour (number of seized effective protective measures): -0.05
           o Measures that are currently being taken are exaggerated and your own
              protective behaviour: 0.01
           o Measures that are currently being taken are exaggerated and own pandemic
              preparedness: 0.01
           o Knowing how to protect yourself from an infection with the new
              coronavirus and taken effective protective behaviour: -0.09

                                                                                                  15
6. What influences risk perception
Due to the evolving circumstances, the perception of risk among the population is likely to
change. Risk is recorded as the probability of becoming ill, the severity of the disease and
one's own susceptibility.
Table below describes the factors related to risk perception. Demographic variables along
with the following factors: Perception of the new coronavirus, actual knowledge about the
new coronavirus, being infected with the new coronavirus, knowing someone who is/might
be infected, actionism and trust in media were analyzed.
The analysis of the probability shows: Older people, males, those who are or might be
infected with the new coronavirus, people who know anyone who is or might be infected by
the new coronavirus, healthcare workers, people who feel that the new coronavirus is close to
them, is new to them, makes them feel helpless, is something they think about, is worrying,
people with higher actual knowledge about COVID-19, people with higher education and
higher income had higher perception of the disease probability. Participants who took
ineffective protective measures had lower perception of disease probability.
The analysis of the degree of severity shows: Males, Saudis, people who feel that the new
coronavirus is close to them, makes them feel helpless, is worrying, is fear inducing, people
with chronic health conditions, people with higher actual knowledge about COVID-19 and
those who received the flu vaccine in 2019 had higher perception of disease severity. People
with higher monthly income and those with higher education had lower perception of disease
severity.
The analysis of perceived Susceptibility show: Older people, males, those who are or might
infected with the new coronavirus, people who know anyone who is or might be infected
with the new coronavirus, healthcare workers, people who feel that the new coronavirus is
close to them, is worrying, people with chronic health conditions, people with higher income
and higher education had higher perception of disease susceptibility. Participants who feel
that the new coronavirus is spreading slowly and those who took ineffective protective
measures had lower perception of disease susceptibility.
As soon as several measurement times are available, the change over time is also considered.
Interpretation: The results of a linear regression analysis are shown. Influencing factors in bold are
significant and have a statistically significant influence. For values with a positive sign, this means
that higher values on this influencing factor lead to more risk perception. That means for values with
negative sign: higher values on this influencing factor lead to less risk perception.
16Probability Severity Susceptibility Predictors Beta standardized CI p Beta standardized CI p Beta standardized CI p (Intercept) 0.00 -0.03 – 0.03
6.! What Affects Behaviour

6.1.! Effective Protective Behaviour

Protective behaviour in this section reflects on the effective protective behaviour. Protective
behaviour is recorded as a percentage: the higher the value, the more effective protective
measures. As well as, the more measures taken by a participant the higher the percentage. In
the following table factors that affect the effective protective measures can be seen.

The analysis shows (see table): Protective behaviour is taken more by people who are older
and those with higher actual knowledge about COVID-19.

Interpretation: The results of a linear regression analysis are shown. Influencing factors in bold
are significant and have a statistically significant impact. For values with a positive sign:
higher values on this influencing factor lead to more protective behaviour. That means for           !
values with negative sign: higher values on this influencing factor lead to less protective
behaviour.

                                  Effective Protective Behaviour
       Predictors                                      Beta       standardized CI          P
       (Intercept)                                     0.00         -0.04 – 0.04
6.2. Actionism (Ineffective Protective Behaviour)
Actionism which is ineffective protective behaviour is recorded as a percentage: the higher
the value, the more the ineffective protective measures. The more measures taken by a
participant the higher the percentage as well. The following table shows which factors
influence the ineffective behaviour (which was asked in the questionnaire).
The analysis shows (see table): Actionism is seen more in older people and females.
Actionism is also seen in people with higher actual knowledge and those who feel that
COVID-19 is media hyped. Less actionism is seen in people who believe they have a low
probability of being infected with COVID-19.
Interpretation: The results of a linear regression analysis are shown. Influencing factors in bold are
significant and have a statistically significant impact. For values with a positive sign: higher values
on this influencing factor lead to more actionism. That means for values with a negative sign: higher
values on this influencing factor lead to less actionism.
Ineffective Protective Behaviour (Actionism)
Predictors Beta standardized CI P
(Intercept) 0.00 -0.04 – 0.046.3. Pandemic Preparedness
Pandemic preparation (preparedness) includes multiple behaviours such as buying large
scales of food, staying away from social events and more. Preparedness is recorded as a
percentage: the higher the value, the higher preparedness measures. The following table
examines factors that influence the preparation for a pandemic.
The analysis shows (see table): Pandemic preparation is seen more in people who trust
healthcare workers, in those who believe that COVID-19 would infect them severely and in
people who feel that the coronavirus is close.
Interpretation: The results of a linear regression analysis are shown. Influencing factors in bold
are significant and have a statistically significant impact. For values with a positive sign:
higher values on this influencing factor lead to more crisis preparation. That means for values with a
negative sign: higher values on this influencing factor lead to less crisis preparation.
Pandemic Preparedness
Predictors Beta standardized CI P
(Intercept) 0.00 -0.04 – 0.046.4. Precautionary Purchases
This section examines which factors are related to whether people have
a) bought extra food as a precaution
b) bought extra medications which include buying extra over the counter medications, extra
prescription medication and extra medications that they take regularly.
c) purchasing extra disinfectants.
“Data in Detail” lists how often these behaviours are shown.
People who know someone who is or might be infected, those who received the flu vaccine in 2019
and those who feel that the new coronavirus is close to them were more likely to buy extra food.
Older people, males and those who feel that the new coronavirus is media hyped were more likely to
buy extra medications.
People who received the flu vaccine in 2019, people who feel that the new coronavirus is media
hyped, people who are married, those who live in larger houses and those who search for information
about the new coronavirus more frequently were more likely to buy extra disinfectants. People who
live in Riyadh were less likely to buy extra disinfectants.
Interpretation: The table presents the results of three linear regression analyses (backwards
elimination). Best statistical model is presented in this table. Odds ratio makes a statement about the
extent to which the presence or absence of a feature A (e.g. perceived closeness) is related to the
presence or absence of another feature B (e.g. precautionary purchases). Influencing factors in bold
are significant and have a statistically significant influence. Values above 1: higher values on this
influencing factor lead to more buying behaviour. Values below 1: smaller values on this influencing
factor lead to less buying behaviour.
21Purchasing extra
Purchasing food Purchasing disinfectants
medications
Odds Odds Odds
Predictors CI p CI p CI p
Ratios Ratios Ratios
(Intercept) 0.15 0.08 – 0.307.! Information Seeking Behaviours 7.1.! Information Search Frequency How often do you inform yourself about the new coronavirus / COVID-19? Answers are assessed on 5-point scales from never - very often, 1-2 lowest category, 3 mid category, 4-5 highest category. ! 23
7.2.! Use

How often do you use the following sources of information to stay informed about the new
coronavirus?

!                                                                                          24
7.3.! Trust

How much do you trust the following source of information in their reporting about the new
coronavirus?

The graph displays mean trust, error bars are 95% CIs.

!

!                                                                                        25
7.4.! Relevance

Relevance is the normalized mathematical product of trust x frequency of use

The graph displays mean relevance, error bars are 95% CIs.

!                                                                              26
7.5.! Type of Information

The type of information I need the most is related to the following items

!                                                                           27
7.6.! Coronavirus as a Media Hype

!

!

!

!

!

!                                   28
8.! Data in details
8.1.! Knowledge about COVID-19

!                                29
! 30
! 31
8.2.! Know and Take Effective Protective Measures
Which of the following measures are effective protective measures to prevent the spread and infection
with the new coronavirus? (Illustration: effective protective measures)

!                                                                                                 32
! 33
8.3.! Ineffective Protective Measures and Actionism
Which of the following measures are effective protective measures to prevent the spread and infection
with the new coronavirus? (Illustration: ineffective protective measures, interpreted as actionism)

!                                                                                                     34
!

!

    !

    !

    !

!

!       35
8.4.! Pandemic Preparedness ! 36
9. Data by Demography
The following tables show variables for the current wave split according to key demographic
characteristics of the respondents.

9.1. Age

                                                                 Age

 Administrative regions            18-29 years     30-49 years     50-64 years     65 and above

 Riyadh (n=1329)                     67.94%          27.91%            3.83%           0.30%

 Makkah (n=551)                      68.96%          29.94%            1.08%            0%

 Madinah (n=184)                     74.45%            25%             0.54%            0%

 Qassim (n=204)                      74.50%          22.54%            2.45%           0.49%

 Tabuk (n=67)                        64.17%          34.32%            1.4%             0%

 Northern Border (n= 19)             78.94%          21.05%             0%              0%

 Jawf (n=17)                         76.47%          23.52%             0%              0%

 Hail (n=56)                         78.57%          19.64%            1.78%            0%

 Baha (n=18)                         72.22%           27.7%             0%              0%

 Jizan (n=39)                        56.41%          41.02%            2.56%            0%

 Asir (n=80)                          67.5%          31.25%            1.25%            0%

 Najran (n=20)                         60%             40%              0%              0%

 Eastern Region (n=365)              64.93%          33.15%            1.91%            0%

                                                                                                  37
9.2. Gender
Gender
Administrative regions Female Male
Riyadh (n=1329) 52.44% 47.55%
Makkah (n=551) 54.49% 45.55%
Madinah (n=184) 46.73% 53.26%
Qassim (n=204) 59.80% 40.19%
Tabuk (n=67) 47.76% 52.23%
Northern Border (n= 19) 57.89% 42.10%
Jawf (n=17) 29.41% 70.58%
Hail (n=56) 66.07% 33.92%
Baha (n=18) 38.88% 61.11%
Jizan (n=39) 46.15% 53.84%
Asir (n=80) 47.5% 52.5%
Najran (n=20) 20% 80%
Eastern Region (n=365) 43.01% 56.98%
389.3. Education
Education
Administrative regions LH H ND D B PG
Riyadh (n=1329) 1.12% 23.10% 10.98% 6.99% 51.31% 6.47%
Makkah (n=551) 3.08% 20.87% 10.88% 5.98% 54.80% 4.35%
Madinah (n=184) 0.54% 21.19% 12.5% 10.86% 51.08% 3.80%
Qassim (n=204) 1.47% 22.54% 12.25% 6.37% 45.83% 3.43%
Tabuk (n=67) 1.49% 2.98% 11.94% 4.47% 55.22% 2.98%
Northern Border (n= 19) 0% 15.78% 5.26% 10.52% 57.89% 10.52%
Jawf (n=17) 0% 17.64% 11.76% 0% 70.58% 0%
Hail (n=56) 0% 21.42% 7.14% 1.78% 66.07% 3.57%
Baha (n=18) 5.55% 22.22% 11.11% 11.11% 44.44% 5.55%
Jizan (n=39) 2.56% 7.69% 7.69% 5.12% 74.35% 2.56%
Asir (n=80) 0% 12.55% 11.25% 10% 61.25% 5%
Najran (n=20) 0% 10% 5% 15% 70% 0%
Eastern Region (n=365) 0.82% 17.26% 13.15% 13.97% 51.23% 3.56%
“LH” = Less than high school degree, “H” = High school degree, “ND” = Some college but no degree, “D” =
Diploma degree, “B” = Bachelor degree, “PG” = Post-graduate degree
399.4. Type of housing
Type of housing
Administrative regions A DV V FTH FV TH T
Riyadh (n=1329) 20.01% 6.92% 60.42% 0.75% 10.91% 0.82% 0%
Makkah (n=551) 57.16% 3.26% 22.86% 3.26% 6.71% 6.53% 0.18%
Madinah (n=184) 55.97% 2.71% 21.73% 3.80% 4.34% 11.41% 0%
Qassim (n=204) 11.27% 10.29% 62.25% 3.43% 9.80% 2.94% 0%
Tabuk (n=67) 38.80% 1.49% 23.88% 5.97% 16.4% 10.44% 2.98%
Northern Border 21.05% 0% 57.89% 5.26% 5.26% 10.52% 0%
(n= 19)
Jawf (n=17) 17.64% 5.88% 52.94% 11.76% 5.88% 5.88% 0%
Hail (n=56) 14.28% 1.78% 67.85% 0% 5.35% 10.71% 0%
Baha (n=18) 27.77% 0% 27.7% 5.55% 27.77% 11.11% 0%
Jizan (n=39) 46.15% 2.56% 26.64% 5.12% 5.12% 5.12% 0%
Asir (n=80) 23.75% 2.5% 47.5% 2.5% 15% 8.75% 0%
Najran (n=20) 40% 0% 20% 5% 15% 20% 0%
Eastern Region (n=365) 34.79% 6.30% 50.95% 0.27% 4.83% 3.28% 0%
“A” = Apartment, “DV” = Duplex villa. “V” = Villa, “FTH” = A floor in a traditional house, “FV” = A floor in
a villa, “TH” = Traditional house, “T” = Tent.
4010. References:
1. Alamro, N., Almana, L., Alabduljabbar, A., AlKahtani, M., AlDihan, R., Almansour, A., ... &
Alshunaifi, A. (2020). Saudi Arabia COVID-19 Snapshot MOnitoring (COSMO Saudi): Monitoring
knowledge, risk perceptions, preventive behaviours, and public trust in the current coronavirus
outbreak in Saudi Arabia.
2. WHO Regional Office for Europe. (2020). COVID-19 Snapshot MOnitoring (COSMO Standard):
Monitoring knowledge, risk perceptions, preventive behaviours, and public trust in the current
coronavirus outbreak-WHO standard protocol.
3. Brewer, N. T., Chapman, G. B., Gibbons, F. X., Gerrard, M., McCaul, K. D., & Weinstein, N. D.
(2007). Meta-analysis of the relationship between risk perception and health behaviour: the example of
vaccination. Health psychology, 26(2), 136.
4. Krawczyk, A., Stephenson, E., Perez, S., Lau, E., & Rosberger, Z. (2013). Deconstructing human
papillomavirus (HPV) knowledge: objective and perceived knowledge in males' intentions to receive
the HPV vaccine. American Journal of Health Education, 44(1), 26-31.
5. Bandura, A. (2006). Guide for constructing self-efficacy scales. Self-efficacy beliefs of adolescents,
5(1), 307-337.
6. Renner, B., & Schwarzer, R. (2005). The motivation to eat a healthy diet: How intenders and
nonintenders differ in terms of risk perception, outcome expectancies, self-efficacy, and nutrition
behaviour. Polish Psychological Bulletin, 36(1), 7-15.
7. Steel Fisher GK et al (2012). Public response to the 2009 influenza A H1N1 pandemic: a polling study
in five countries. Lancet Infectious Diseases 2012; 12: 845–50
8. Schweitzer, M. E., Hershey, J. C., & Bradlow, E. T. (2006). Promises and lies: Restoring violated trust.
Organizational behaviour and human decision processes, 101(1), 1-19.
9. Pearson, S. D., & Raeke, L. H. (2000). Patients' trust in physicians: many theories, few measures, and
little data. Journal of general internal medicine, 15(7), 509-513.
10. Brewer, N. T., Chapman, G. B., Gibbons, F. X., Gerrard, M., McCaul, K. D., & Weinstein, N. D.
(2007). Meta-analysis of the relationship between risk perception and health behaviour: the example of
vaccination. Health psychology, 26(2), 136.
11. Bradley, M. M., & Lang, P. J. (1994). Measuring emotion: the self-assessment manikin and the
semantic differential. Journal of behaviour therapy and experimental psychiatry, 25(1), 49-59.
12. Smith, B. W., Dalen, J., Wiggins, K., Tooley, E., Christopher, P., & Bernard, J. (2008). The brief
resilience scale: assessing the ability to bounce back. International journal of behavioural medicine,
15(3), 194-200.
13. McCarthy-Larzelere, M., Diefenbach, G. J., Williamson, D. A., Netemeyer, R. G., Bentz, B. G., &
Manguno-Mire, G. M. (2001). Psychometric properties and factor structure of the Worry Domains
Questionnaire. Assessment, 8(2), 177-191.
41You can also read