Does Smartphone Use Drive our Emotions or vice versa? A Causal Analysis
←
→
Page content transcription
If your browser does not render page correctly, please read the page content below
CHI 2020 Paper                                                                                          CHI 2020, April 25–30, 2020, Honolulu, HI, USA

   Does Smartphone Use Drive our Emotions or vice versa?
                    A Causal Analysis

             Zhanna Sarsenbayeva1 , Gabriele Marini1 , Niels van Berkel2 , Chu Luo1 , Weiwei Jiang1 ,
             Kangning Yang1 , Greg Wadley1 , Tilman Dingler1 , Vassilis Kostakos1 , Jorge Goncalves1
             1 The University of Melbourne, Melbourne, Australia, firstname.lastname@unimelb.edu.au
                        2 Aalborg University, Aalborg, Denmark, nielsvanberkel@cs.aau.dk

ABSTRACT                                                                                      and the adoption of technology [43], and asserting the impor-
In this paper, we demonstrate the existence of a bidirectional                                tance of designing technology to create desirable emotional
causal relationship between smartphone application use and                                    experiences [67]. Recently, researchers have studied this in
user emotions. In a two-week long in-the-wild study with                                      more specific contexts. For example, the use of digital techno-
30 participants we captured 502,851 instances of smartphone                                   logies as diverse as smartphones [61], videogames [20], social
application use in tandem with corresponding emotional data                                   media [48], online videos [64], music streaming services [49]
from facial expressions. Our analysis shows that while in                                     and virtual reality [94] are known to influence emotions.
most cases application use drives user emotions, multiple
                                                                                              Recent research has also examined the ‘inverse’ causal direc-
application categories exist for which the causal effect is in the
                                                                                              tion: how emotional states influence technology use. States of
opposite direction. Our findings shed light on the relationship
                                                                                              joy and anger have been shown to affect interaction, such as in-
between smartphone use and emotional states. We furthermore
                                                                                              crease joystick movements, speed, and acceleration compared
discuss the opportunities for research and practice that arise
                                                                                              to states of sadness [4]. Even typing speed is affected by our
from our findings and their potential to support emotional
                                                                                              emotional state: Khanna and Sasikumar [47] found that when
well-being.
                                                                                              experiencing negative emotional states users type slower com-
                                                                                              pared to when experiencing positive states. Likewise, a user’s
Author Keywords                                                                               emotional states influence interaction with mobile devices [13].
Smartphones, emotions, mobile interaction, mobile                                             For example, Cairns et al. show in their study that users in a
application use, emotion detection, emotional well-being                                      negative emotional state are more likely to make errors when
                                                                                              completing a simple task of number entry on a tablet [13]. Mo-
INTRODUCTION                                                                                  reover, Mottelson and Hornbæk [63] demonstrate that a user’s
Emotions are integral to human behaviour and influence the                                    emotional state has a behavioural effect on mobile interaction.
way we think and act [53]. They incline people to respond                                     The authors show that the participants with neutral affective
effectively to environmental challenges and opportunities [31].                               state had a higher acceleration when performing touch tasks
Thus, emotions are inextricably intertwined with people’s inte-                               as compared to participants with positive affective state.
ractions with the world. This is a bidirectional influence: our
                                                                                              Given the prominence of smartphones, and the evidence on
experiences in the world engender emotional reactions, and in
                                                                                              the effect of emotional state on smartphone use, we set out to
turn these emotions shape our behaviour and interactions [78].
                                                                                              further investigate the relationship between smartphone use
In this paper, we investigate the bidirectional causal relation-
                                                                                              and users’ emotions. In particular, we address the challenge
ship between emotions and the most ubiquitous interactive
                                                                                              of understanding whether specific emotions drive particular
device: smartphones.
                                                                                              smartphone use, and/or whether smartphone use leads to cer-
As digital technology use becomes an increasingly important                                   tain emotions. A study by Mehrotra et al. [61] was one of the
component of our daily experience, it is to be expected that                                  first to identify a causal impact of users’ emotions on mobile
the experience of using technology will also sometimes be                                     interaction. The study collected participants’ self-reported
imbued with emotion. Indeed, prior work has long shown this                                   emotional states and mapped these to their phone use beha-
to be the case, with the earliest results in HCI research em-                                 viour in the subsequent hour. We extend this work by 1)
phasising the importance of emotion in user experience [58]                                   utilising a non-administered in situ method for the passive
                                                                                              and continuous assessment of emotions from facial expres-
Permission to make digital or hard copies of all or part of this work for personal or
                                                                                              sions during application use, and 2) applying the Convergent
classroom use is granted without fee provided that copies are not made or distributed         Cross Mapping (CCM) [89] method, published in Science in
for profit or commercial advantage and that copies bear this notice and the full citation     2012 and recently extended to the HCI domain to combine,
on the first page. Copyrights for components of this work owned by others than ACM
must be honored. Abstracting with credit is permitted. To copy otherwise, or republish,       visualise, and evaluate multiple participants [95], to carefully
to post on servers or to redistribute to lists, requires prior specific permission and/or a   investigate the bidirectional causal relationship between user
fee. Request permissions from permissions@acm.org.                                            emotions and smartphone use. This is made possible due to
CHI ’20, April 25–30, 2020, Honolulu, HI, USA.
Copyright is held by the owner/author(s). Publication rights licensed to ACM.
ACM ISBN 978-1-4503-6708-0/20/04 ...$15.00.
http://dx.doi.org/10.1145/3313831.3376163

Paper 36                                                                                                                                            Page 1
CHI 2020 Paper CHI 2020, April 25–30, 2020, Honolulu, HI, USA
the fine granularity of our data, unlike self-report data which smartphone task. The authors found that the participants were
is often sparse. quicker to perform the task but made more errors after viewing
unpleasant pictures compared to the other two conditions [21].
To conduct the study, we developed ‘ApplicationTracker’ — an
Android application used to collect information on the user’s
application use as well as their emotional state, as derived from Emotion Detection Mechanisms
the user’s facial expressions captured with the smartphone’s Emotion detection has recently gained significant attention
front-facing camera. ‘ApplicationTracker’ utilises the AWARE across different scientific disciplines, including Computer
Framework [28] to collect smartphone application use and the Science [107]. For example, Epp et al. suggested using typing
Affectiva Emotion SDK 1 for detecting emotions from facial patterns on a standard computer keyboard to detect user emo-
expressions. This combination allows us to record and analyse tions [26]. The authors modelled six emotions (confidence,
emotional states during smartphone interaction. Our analysis hesitance, nervousness, relaxation, sadness, and tiredness)
shows that, overall, phone use drives certain emotions rather with accuracy rates ranging between 77.4% and 87.8%. Savva
than the other way around. Furthermore, we identify specific and Bianchi-Berthouze [84] propose a system to recognise
application categories which actually drive users’ emotions. user emotions while playing a Wii tennis game.
The contribution of our work is three-fold: Another method of measuring emotions is through self-reports.
1. Methodologically, we use simultaneous and continuous A common way to assess a person’s emotional state is to ask
mapping of users’ facial expressions and application use them to rate their feelings according to the Valence-Arousal
traces to study the relationship between emotional state and dimensions [72]. Techniques such as the self-assessment man-
smartphone application use. nequin (SAM) [50], circumplex model of affect [79], photo-
graphic affect meter (PAM) [74], and positive and negative
2. Analytically, we show that smartphone application use dri- affect schedules (PANAS) [101] are widely used to collected
ves user emotions more often than the other way around, self-reported emotional state.
and we shed more light on this relationship.
Finally, previous work has explored the use of physiological
3. Conceptually, we highlight the implications of our findings attributes to detect emotions. Examples include the use of
for both research and practice. In particular, we argue that facial expressions [18], skin conductance [72], and heart rate
understanding the relationship between application use and variability [55]. Facial expressions not only offer insights into
emotions has the potential to promote and facilitate emotio- a person’s emotional state, but they can also provide additio-
nal well-being through emotion regulation practices [40]. nal physiological data (e.g., heart rate, heart rate variability,
skin colour changes, and respiration rate) which can be used
RELATED WORK to detect emotions [18]. For example, Poh et al. used a we-
bcam to extract various features (heart rate, respiratory rate,
Emotions and Their Effects on Human Behaviour and heart rate variability) to detect emotions from the captu-
Emotions are part of everyday experience and are causally red facial images [73]. Although some scientists argue that
intertwined with behaviour [53]. For example, prior literature facial expressions do not reflect the people’s true emotional
has established a positive effect of enjoyment on performance feelings [29], several researchers agree that facial expressions
in education [52]. In particular, Larson et al. [52] found can serve as indicators of people’s mental state [30, 57] and
that students who enjoyed their projects, received a higher reflect emotions as a normal physiological response [106, 25].
grade upon finishing the project (r = 0.44). Furthermore, For example, a person’s visible smile is typically an indicator
positive emotions have been shown not only to improve per- of happiness, appreciation, and desire [106, 80].
formance, but also to facilitate creative, flexible, and divergent
thinking and hence, efficient-problem solving [76]. Positive Detecting Emotions with Smartphones
emotions have also been shown to increase focus attention on
Previous work has shown that smartphone interaction beha-
the task [70]. Negative emotions (e.g., sadness), in contrast
viour and sensor data can be used to detect emotional state of
to positive emotions, have been shown to negatively influence
the user [12, 54]. For instance, a number of studies have asses-
human ability to concentrate [23]. Moreover, medical students
sed mental health using smartphone sensor data by looking at
who were induced with negative emotions took significantly
phone use and contextual data [12, 56], facial expressions [65],
longer time to diagnose patients based on an x-ray as compared
social interaction [54], speech patterns [17, 19], as well as
to students who were induced with positive emotions [45].
sleep and physical activity [77, 100].
Given the established effect of emotions on human cognition
Gao et al. [32] suggested using mobile touch to detect user’s
and behaviour, some researchers have investigated the effect
emotional state. The authors extracted participants finger-
of emotions on mobile interaction. For example, Mottelson
stroke features while playing Fruit Ninja. The researchers
et al. found that participants exposed to positive emotional
achieved an 89.7% accuracy from touch strokes as compared
stimuli were more precise in tapping tasks as compared to
to self-assessed emotional states. However, it is difficult to
participants with neutral-induced affective state [63]. In ad-
generalise these results due to the specificity of the task and
dition, Coombes et al. [21] have investigated the effect of
the limited sample size (15 participants). LiKamWa et al.
neutral, unpleasant, and pleasant pictures on a square-tracing
presented MoodScope – an application which detect user’s
1 https://knowledge.affectiva.com/ mood [56]. In this study, the authors collected contextual data
Paper 36 Page 2CHI 2020 Paper CHI 2020, April 25–30, 2020, Honolulu, HI, USA
(phone calls, text messages, emails, application use, web brow- In this paper, we extend the work by Mehrotra et al. [61],
sing histories, and location data) as well as self-reported mood by investigating the bidirectional causal relationship between
states [56]. MoodScope achieved 66% accuracy for predicting users’ emotional state and their smartphone application use.
participants’ daily average mood with phone calls and appli- However, we utilise emotions derived from facial expressions
cation categories being the most useful features in prediction (not using self-report data collection methods due to their spar-
models [56]. Similarly, Sun et al. utilised sensor data, event sity) and investigate causal relationship between the instant
data, content data, and application use data to predict user’s effect of the application use on emotional state of the user
emotions [90]. Zhang et al. employed application use data, through Convergent Cross Mapping (CCM) analysis.
contextual information, and sensor data to detect user’s com-
pound emotions [107]. Hung et al. [44] used call logs and METHOD
application use together with user’s self-reported emotions to
predict negative emotion. Software – ‘ApplicationTracker‘
We developed a standalone Android application called ‘Ap-
These examples show different efforts in the research com-
plicationTracker’ that uses the AWARE framework [28] to
munity to use an off-the-shelf smartphone to sense emotional
collect smartphone use data. In particular, the application logs
state of the user. In this study, we collect in situ emotions
unlock events and the foreground applications used during the
derived from facial expressions of our participants during their
session following the unlock event.
smartphone application use using a validated tool [87]. This
passive sensing approach provides us with the insights of pe- We integrated the Affectiva Android API [59] into ‘Applica-
ople’s instant emotional reactions to applications in a real tionTracker‘ to track user’s emotional expressions with the
world scenario with a high degree of granularity without being device’s front-facing camera during smartphone use. Thus,
burdensome to the participants. the software continuously logs confidence values (between 0
to 100) for the emotions anger, contempt, disgust, fear, joy,
Application Use Behaviour sadness, and surprise, estimated from the user’s facial expres-
Studies on application use behaviour have gained popularity in sions at the default 30 frames per second. The software starts
recent years [62, 60]. Application use patterns have been used logging user emotions upon unlock and stops logging the emo-
to understand people’s behaviour [71]. For example, Silva et tions when the screen is locked. All emotion and application
al. [85] show cultural differences in eating and drinking habits use data is recorded with a corresponding timestamp. The
from FourSquare use patterns. The authors demonstrate that software runs as a service listening for unlock events and has
in most of the cases, cities from the same country tend to have a simple interface consisting of a button that can be used to
similar drinking and fast food habits [85]. Goodrich and De start the service upon deployment.
Mooij [36] investigate cultural influences of social media on We also collected self-reported emotional states of our parti-
consumerism. They also found that human-sources of infor- cipants (valence and arousal) through Experience Sampling
mation is more valuable in cultures of short-term orientation; Method (ESM) questionnaires [22] in order to triangulate
whereas in cultures of long-term orientation, fact-based infor- against and check the accuracy of the Affectiva data. The
mation (e.g., search-engines) are more important [36]. Song et questionnaires were administered 6 times per day between
al. [86] argue that application use information can provide 9:00 am and 9:00 pm at random times with a minimal interval
opportunities to optimise smartphone systems. The authors of 1 hour between two consecutive questionnaires [96].
present a personalised optimisation framework that enables
prediction of future app launch; hence, reducing unnecessary Affectiva Emotion-Detection API Validation
app restarts by 78.4%.
We evaluated Affectiva’s performance on emotion detection on
There have also been several attempts to derive users’ emo- three publicly available databases in order to increase our con-
tional state from application use data. In a study by Visuri et fidence on the reliability of the API in detecting the different
al. [99], the authors map users’ affective state to applica- emotions. The human models posing for all these databases
tions use. They found that when experiencing positive affect, were trained by Facial Action Coding System (FACS) [24]
the users tend to use Media, Games, Maps and Travel appli- experts to express basic emotions. The three datasets used
cations. However, when the affective state is negative, the were:
users have a tendency to use Internet browsers or Social media
• The Amsterdam Dynamic Facial Expression Set (AD-
apps [99]. A study by Mehrotra et al. [61] is most closely
FES) [97] – Database containing both dynamic (videos)
related to our study. The authors examined the causal rela-
and static (pictures) of facial expressions of anger, con-
tionship between the users’ emotional state and smartphone
tempt, disgust, fear, happiness, sadness, and surprise from
interaction. They collected smartphone use data (e.g., app
22 people. The pictures were validated by 119 non-experts
use, micro-interactions with the device, communication pat-
judges.
terns, and notifications) and used the Experience Sampling
Method to collect users’ self-reported emotional states. Their • The Warsaw Set of Emotional Facial Expression Pictures
findings suggest that user’s activeness levels have a positive (WSEFEP) [68] – Database consisting of 210 images of 30
impact on the use of music applications, and that an increase people, expressing anger, disgust, fear, happiness, sadness,
in stress levels significantly reduces the use of communication and surprise. The pictures were validated by a large number
applications. of non-expert judges (N = 1362).
Paper 36 Page 3CHI 2020 Paper CHI 2020, April 25–30, 2020, Honolulu, HI, USA
• The Radboud Faces Database (RaFD) [51] – Database that of the same events when the software was not running on the
contains 536 pictures of faces expressing basic emotions device. For the 248 unlock events solely, the devices used 8%
(anger, contempt, disgust, fear, happiness, sadness, and of its battery capacity (240mAh). To execute our software after
surprise) from 67 people. The pictures were validated by 248 unlocks, the device uses an additional 11% (330mAh) of
238 non-expert judges. its battery capacity. Considering the large number of software
executions, the energy consumption of our software in prac-
We used a custom automated way to feed the images from tical use is minor (approximately 1% power per 23 unlocks)
the databases to the Affectiva API and recorded the resulting given that the users unlock their phones 10 200 times on
emotion classification. We initially analysed each emotion in- average per day [27].
dividually to check Affectiva’s detection accuracy. We found
that Affectiva was more accurate at detecting certain emotions RESULTS
than others, e.g., surprise (accuracy of 97.46%), joy (accu-
General Descriptive Statistics
racy of 94.17%), disgust (accuracy of 89.92%), and contempt
Overall, we collected 502, 851 data points where application
(accuracy of 81.36%). Whereas, Affectiva was relatively inac-
use was matched to the corresponding emotion records. We
curate in detecting anger (50.82%) and fear (7.5%). Hence, we
analysed our data to count the total number of application
decided to remove these two emotion classifications from our
launches per hour-of-day and visualised it in Figure 1-(a).
user-study dataset to increase the reliability of our findings.
The figure shows that the number of application launches
After the removal of these two emotions, our results show
grows towards the evening. These results are in line with
that Affectiva accurately detected emotions with an overall
previous findings [10]. We then visualised average phone use
accuracy of 85%.
duration per hour in Figure 1-(b). The figure shows that the
Participants and Procedure highest average duration of phone use occurs between 22:00
We recruited 30 participants (15 Female, 15 Male) aged be- and midnight while the lowest phone use occurs between
tween 20 and 45 (M = 29, SD = 6.07) via our university’s ma- 2:00 am and 7:00 am.
iling lists and through snowball recruiting. Participants were
required to own an Android-based smartphone to enrol in the
experiment. In addition, our participants had a diverse range
of educational background (e.g., Accounting, Biomedicine,
Computer Science, Education, Linguistics, Neuroscience) and
each participant was assigned a unique anonymous ID. More-
over, almost all participants (29 out of 30) had a standard 5 (a) (b)
days work week with 2 days of weekend. Figure 1: Statistics on phone usage
We held individual intake sessions for each participant. Upon
arrival to our lab, we briefed them about the purpose of the We then analyse the fluctuations of our participants’ emotion
experiment, and received their consent agreeing to partici- throughout the week. As joy and sadness have been shown to
pate in our study. We then installed the software on their follow day-of-week pattern [88, 35], we chose these emotions
smartphone and explained how it worked. The data collection to demonstrate that the trend also holds in our study. The fluc-
phase lasted for two weeks, during which participants were tuations of emotions, (a) joy and (b) sadness, are presented in
instructed to use their phones as usual. App usage and facial Figure 2. For the data in Figure 2, we averaged and smoothed
expressions data were stored locally on the user’s smartphone the data from all our participants and grouped per day of the
for privacy reasons. week and find a pattern as shown in previous work [88]. The
apparent trend in joy and sadness over the course of the week
After the data collection was finished, we invited participants provides confidence in the detection features of the Affectiva
for individual debriefing sessions. During these sessions we API. We can see that towards the weekend participants’ joy
retrieved the data from each participant’s device, uninstalled increases, while on weekdays it drops; whereas sadness drops
the software, and held semi-structured exit interviews to inqu- towards the weekend and is at its peak on weekdays. Our
ire about their perceptions of their emotions and applications results are in line with previous research [88], and provide
use. Every participant was rewarded with a $10 gift voucher additional confidence in the accuracy of the emotion measure-
for their participation. The experimental design was approved ments collected via the Affectiva API.
by the Ethics Committee of our university.
We also collected participants’ self-reported affective states
Software Power Consumption Test through ESM questionnaires. We followed a protocol pre-
We conducted a test on a smartphone to quantify the power sented by Van Berkel et al. [96] and constructed the ESM
consumption of our software. We selected a Samsung S7 questionnaire according to Russel’s Circumplex Model [79].
with Android 7.0 as the experiment device (battery capacity The ESM questionnaire contained two Likert-scale questions:
3000mAh). We installed our software and launched 248 unlock Miserable–Pleased and Sleepy–Aroused. The use of this scale
events leaving the screen on for 30 seconds each time. This allowed participants to indicate the intensity of their current
number of unlock events is substantially higher than the daily emotion rather than just a label. This aligns more closely with
use of a regular user (10 200 unlocks per day) [27]. To confidence values as obtained through Affectiva and allows
provide a baseline, we also recorded the energy consumption for the subsequent CCM analysis.
Paper 36 Page 4CHI 2020 Paper CHI 2020, April 25–30, 2020, Honolulu, HI, USA
tain emotions, people might use specific applications on their
phone. Such a behavioural loop can be investigated from the
perspective of coupled dynamic systems in order to under-
stand the causality and its direction between emotions and
application use. These insights can be used in the design of
e.g., digital emotional regulation applications and to increase
our understanding of the effect of digital devices on end users.
(a) (b)
Highly established work in the HCI field, such as Don Nor-
Figure 2: Daily fluctuations for joy and sadness throughout the week man’s ‘Gulf of execution and evaluation’, shows that human
(smoothed conditional means) behaviour can be described as a complex system [16, 33, 66].
As we seek to identify causal relationships in our time-series
This enabled us to provide additional validation of the Af- based data, CCM presents itself as an appropriate and ro-
fectiva data beyond the tests described above. Note that this bust method which avoids some of the restrictive assumptions
validation is limited since the ESM data is explicitly entered made by GC. We used the “rEDM” R package by Ye et al.
by participants only up to 6 times per day. Because the fre- [105] to conduct our analysis and follow the analysis approach
quencies of the two datasets are substantially different, and presented in [95].
they also capture slightly different behavioural aspects, our We analysed the causality between emotions and phone use
analysis proceeds as follows. We consider the valence data in terms of 1) the number of applications launched and 2) app
from the ESMs, and we calculate the mean valence over the usage duration. We summarise our results in Tables 1 and 2 as
preceding minute as generated by the Affectiva. Next, we well as in Figures presented in the Supplementary Materials.
consider time segments where both ESM and Affectiva data Tables 1 and 2 are colour-coded according to the direction of
were recorded, and we calculate the correlation of ESM with causal relationship and its effect size: darker colours indicate a
Affectiva data. We find that ESM valence positively correlates stronger effect; blue indicates that phone use drives emotions,
with the mean Affectiva valence values (r = 0.3, p < 0.01). and orange indicates that emotions drive phone use.
This relationship varies in proportion to the time window we
consider. For example, when we consider a 1-hour window, The procedure we follow is identical for all tests we report
the correlation drops to 0.11. When we consider a 5-minute here: we group the emotion data and app usage data into ho-
window, the correlation goes up to 0.23, and for 1-minute urly time-series, and each time-series is fed into the CCM
window it is 0.3. The results validate our expectations since algorithm. Specifically, Affectiva generates one record every
we expect a stronger correlation as the time window closes 250 milliseconds, containing the estimated value for each of
in on the ESM response time, and weaker correlation as we the 7 emotions that it tracks. Therefore, over a period of time,
consider an increasing time period around the ESM instance. we collect an equal number of readings for each of these emo-
tions. We average these values, per participant per emotion,
Convergent Cross Mapping into 1-hour periods, and also calculate for each period how
Next, we applied the Convergent Cross Mapping (CCM) me- many applications were launched, and how much time was
thod introduced by Sugihara et al. [89] to further analyse spent using these applications. Therefore, for each 1-hour
our data. CCM is a method commonly used to distinguish period we have an estimated value for ‘mean joy’, ‘mean sad-
causality from correlation developed for time series variables. ness’, etc., as well as the total number of application launches
CCM is a newly developed alternative to Granger causality and total duration. We did not apply any first-differencing to
(GC), which is a traditional approach to investigate causal the data as CCM has been applied to records in which samples
relationship between two variables in a time series. GC has are not evenly spaced in time (e.g., Van Nes et al. [98]), but
been used empirically to find patterns of correlations in cases the state-space cross-mapping concept demands that the varia-
where the system is purely stochastic [37]. To clarify, CCM is bles being compared are sampled at contemporaneous points.
not a version of GC, but rather both CCM and GC are methods CCM does not assume stationarity, hence there is no need to
for identifying cause and effect in timeseries. Whereas GC detrend the observed time series [41]. These values form our
is used for the analysis of clearly separable variables, CCM time series that we feed into the CCM analysis.
considers timeseries data from a complex and dynamic sys-
CCM Parameters
tems perspective, and investigates the relationships between
variables in a system that is not entirely random. Unlike GC, We grouped the emotion data and application usage data into
hourly time-series, hence used the one hour time delay as it
CCM uses the notion of convergence to distinguish causation
has been shown that emotions persist over time [6, 7]. Using
from correlation.
shorter time-slots (e.g., 1-minute or 5-minute) results in most
Interaction between user and technology can be influenced slots having 0 values, and therefore the data becomes less
by many different factors such as environmental and social meaningful. We also argue that hourly slots do not pose a
context, mood, friends, weather, and applications use which challenge in terms of detecting transient emotions, because
potentially can change by themselves and in relation to each CCM actually identifies cause-and-effect by considering all
other in nonlinear ways. For example, when people interact values in the time series in varying window sizes. In addition,
with their smartphones, their application use might lead them emotions in each 1-hour segment do not “cancel each other out”
to feel certain emotions; and vice versa when feeling cer- (e.g., joy and sadness are aggregated separately over the time
Paper 36 Page 5CHI 2020 Paper CHI 2020, April 25–30, 2020, Honolulu, HI, USA
Metric Contempt Disgust Joy Sadness Surprise
period) as both our data collection (Affectiva) and data analysis
consider each emotion independently. Essentially, having Total Apps 0.203 0.174 0.194 0.108 0.202
“richer” observation periods allows for more confidence in the Launch (0.140) (0.205) (0.132) (0.214) (0.311)
results. Finally, we confirm that the results from our analysis
were matched against interview material with our participants, Communication 0.226 0.059 0.147 -0.002 0.260
and therefore our findings are triangulated. Nevertheless, we Apps Launch (0.261) (0.414) (0.224) (0.391) (0.383)
agree that future work should consider analysing such data
at different time lag configurations as it has been shown to Social Apps 0.305 0.092 0.479 -0.083 -0.015
improve the results of the CCM analysis [104]. Launch (0.403) (0.429) (0.153) (0.555) (0.288)
To identify the optimum value for E (Embedding Dimension) Work Apps 0.484 0.251 0.257 0.070 0.088
we used simplex projection as was recommended in [104]. Launch (0.185) (0.129) (0.252) (0.555) (0.589)
The idea is to use a set of E lagged values of a variable in
order to remodel the behaviour of a dynamic system in E- Entertainment 0.202 0.239 0.487 0.262 -0.151
space (this is consistent with Takens theorem [91]). Each Apps Launch (0.348) (0.542) (0.481) (0.847) (0.621)
point in E-space is formed using the variables’ E lags and
these points construct an ‘attractor’ or an ‘attractor manifold’
Table 1: Effect Sizes (and SD) for Causality between Application Launch
that define the system’s evolution. Then, for each point we and Emotions. Blue: phone use drives emotions; Orange: emotion dri-
find the E+1 nearest neighbours and project them to forecast ves phone use.
future values in order to evaluate the quality of reconstruction.
This forecasting power is calculated as the correlation between
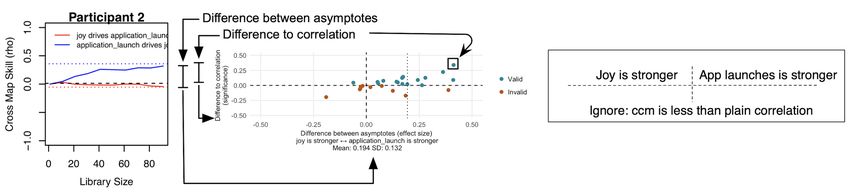
the observed and predicted values (rho value). The optimum E We visualise the results in Figure 5 (Supplementary Materials);
value is the one that maximises this correlation as it provides however a part of the graph is presented in Figure 4. Each
the best out-of-sample predictions of the future. participant in the graph is represented as a dot. For each
participant, the CCM algorithm determines whether variable
Finally, the convergence is visually verified by ensuring that as
1 (e.g., joy) is driven by a variable 2 (e.g., the number of app
the number of points on the manifold increases, the strength of
launches), or vice versa. The direction and magnitude of this
the causal effect increases and then plateaus. The convergence
effect for each participant is indicated by the position of the
is visualised in the left frame of Figure 3. Then, for each
data point on the x-axis. If the point is to the left of the y-axis,
participant we visualise the outcome of the convergence and
it suggests that the effect is in a certain direction (joy drives
position it on the x-y axes. This final graph provides an ove-
application launches); if the point is to the right, then the effect
rview of the causality analysis for the two respective variables.
is in the opposite direction (application launches drive joy).
The distance from the x-axis indicates how much stronger this
forecasting ability is than plain correlation. Finally, the dashed
vertical line indicates the mean effect size of causality across
all participants. When interpreting the data points, we ignore
the red dots as they are labelled by CCM as invalid: for these
dots, CCM is not able to provide explanatory power that is
greater than a plain correlation.
Figure 3: A visualisation of the difference between asymptotes and the
difference to correlation. These two values represent x and y coordinates
of a datapoint in the summary scatterplot.
Application Launches vs. User Emotions
We investigate the bidirectional causal relationship between
the number of app launches and emotional state of the user
to see if applications launches lead participants to experience
certain emotions, and/or vice-versa.
Figure 4: CCM graph visualising the causal relationship between appli-
With CCM, the direction of causality is established by looking cation launches and joy)
at how well variable 1 can forecast variable 2, and comparing it
to how well variable 2 can forecast variable 1. This comparison In the case of Figure 5 (Supplementary Materials), the pre-
establishes the overarching direction of causality between two valence of points to the right of the graphs’ origin indicates
variables. Subsequently, the strength of this forecasting ability that application launch drives emotions for the majority of the
is compared to the raw correlation between the two variables. participants. We note that “drive” is a concept from complex
If the forecasting ability is lower than the plain correlation, systems, and should not be confused with a positive correla-
then the result is discarded. If the forecasting ability is greater tion. Rather, we can think of it in terms of “can predict”, or
than the plain correlation, then the result is retained. Then, we “causality”. Here, the findings show that application launches
calculate the overall direction of causality by averaging the drive – or can predict – emotions, but the exact nature of this
valid data points (i.e., each individual participant). effect can in fact vary substantially over time as it is non-linear.
Paper 36 Page 6CHI 2020 Paper CHI 2020, April 25–30, 2020, Honolulu, HI, USA
Metric Contempt Disgust Joy Sadness Surprise
When interpreting the data points, we ignore the red dots as
they are labelled by CCM as invalid: for these dots, CCM is Total Apps 0.091 0.047 0.138 0.086 0.144
not able to provide explanatory power that is greater than a Usage Duration (0.172) (0.220) (0.191) (0.214) (0.247)
plain correlation.
Communication Apps -0.118 0.131 0.124 0.122 0.177
In our results, however, there are also some participants for Usage Duration (0.534) (0.393) (0.331) (0.388) (0.363)
whom emotion drives application launch (blue dots to the left
of the graphs’ origin). For example, contempt (1 participant), Social Apps 0.221 0.093 0.129 0.168 -0.025
disgust (1 participant), joy (1 participant), sadness (3 parti- Usage Duration (0.387) (0.680) (0.360) (0.215) (0.469)
cipants), and surprise (2 participants) drive the number of
launched applications, which means that once these partici- Work Apps -0.060 0.064 -0.180 0.034 0.265
pants experienced certain emotions, those emotions influenced Usage Duration (0.558) (0.574) (0.316) (0.547) (0.315)
the number of applications they launched.
Next, we repeat the analysis but this time considering the app Entertainment Apps 0.149 -0.010 0.256 -0.050 -0.359
Usage Duration (0.302) (0.616) (0.471) (0.680) (0.379)
launches across different application categories, to see if the
causal relationship varies between categories. First, we pre-
sent causality between Communication apps (e.g., Messenger, Table 2: Effect Sizes (and SD) for Causality between Application Usage
WhatsApp, Telegram) and emotions in Figure 6 (Supplemen- Duration and Emotions. Blue: phone use drives emotions; Orange: emo-
tion drives phone use.
tary Materials), and observe that for most of the emotions
(besides sadness) application launches drive emotions, with
a stronger effect for surprise and contempt as compared to
disgust and joy. (Supplementary Materials) – we can observe that for such
emotions as disgust, joy, sadness, and surprise, duration drives
We also investigate the causal relationship between emotions emotions. Nevertheless, there exist several participants for
and Social applications (e.g., Facebook, Instagram) and pre- whom emotions drive use duration of communication applica-
sent it in Figure 7 (Supplementary Materials), where we obse- tions. Moreover, contempt drives use of communication apps
rve a strong effect of application launches on joy and contempt. for most participants.
However, the causal effect of application launch on disgust is
not as strong when using social applications. Conversely, sad- Second, the results for social applications are shown in Fi-
ness and surprise drive application launches in this category. gure 12 (Supplementary Materials) – we can observe that for
most of the emotions (excluding surprise) use duration of so-
We consider the causal relationship between Work applications cial apps drives emotions. However, for certain participants,
(e.g., Productivity, Education, and Business apps) and user their emotions drive social app use. The plot does not show
emotions in Figure 8 (Supplementary Materials). We find that a strong causal effect between social apps use duration and
application launches drive most of the emotions, with a strong surprise.
causal effect on contempt, disgust, and joy, as compared to
sadness, and surprise. For this category of apps, user emotion Third, the results for work applications are presented in Fi-
does not drive app launches. gure 13 (Supplementary Materials) – we can see that surprise
is driven by application use duration; same as for disgust, and
Finally, we examine causality between Entertainment appli- sadness, however the effect for disgust, and sadness is not very
cations (e.g., games, YouTube, Netflix) and user emotions, strong. In contrast, contempt and joy drive application use
which we visualise in Figure 9 (Supplementary Materials). We duration of work applications.
observe a strong causal effect of application launch on joy,
as compared to contempt, disgust, and sadness. We can also Finally, the results for entertainment apps are presented in
observe that surprise drives application launches. Figure 14 (Supplementary Materials) – we can observe that
entertainment applications use duration drive the experience
of contempt and joy. Conversely, the experience of sadness
Application Use Duration vs. User Emotions and surprise drives the use of entertainment applications. We
We also analyse the causality between emotions and app use can also see that there is no causality relationship between
duration (for all application categories), which we visualise disgust and use duration for entertainment apps, as the effect
in Figure 10 (Supplementary Materials), where we observe size value is close to zero for this emotion.
that for the majority of participants, application use duration
drives emotions. However, there are some participants for
Qualitative Results
whom certain emotions drive app use duration. For example,
We used thematic analysis to analyse the data collected from
contempt drives app use duration for 1 participant, disgust
our semi-structured interviews with participants. First, we
drives app use for 4 participants, joy drives app use for 1
read through each of the responses. Then three of the authors
participant, and sadness and surprise drive application use
duration for 3 and 2 participants respectively. independently completed initial coding on the data. Next, the
researchers compared initial codes and agreed on the final
We also studied the causality between emotions and duration codes according to their similarity (e.g., “I try to focus on so-
of different application categories. First, we visualise causa- mething else” and “I get myself distracted” would be merged
lity between Communication apps and emotions in Figure 11 to “Diverting attention”). We then independently coded par-
Paper 36 Page 7CHI 2020 Paper CHI 2020, April 25–30, 2020, Honolulu, HI, USA
ticipants’ responses according to the finalised codes. Finally, don’t do anything special, continue working or doing what I
we reviewed our coding and identified the themes described was doing, nothing on the smartphone” (P20).
below.
A few participants (N = 6) reported that when experiencing
negative emotions, they seek distractions and some use their
Theme 1 – Content Matters
smartphones as a distraction. “I try to focus on something else,
Whereas we categorised our data with regard to specific apps, or talk to other people. Phone can also be a distraction: call
many apps deliver variable content. The majority of our par- or text someone” (P03). Using different apps on the phone is
ticipants (N = 23) mentioned that their emotional states can also seen as a distraction: “I avoid things that make me feel
be affected by the content of the applications, e.g., positive negative, I try to distract myself by using Facebook, reading a
content directs their emotions towards positive emotions, and book, talking to people. I play music on my phone (sad music)”
negative content drives them towards negative emotions: “It’s (P13). Moreover, one participant states that when feeling sad,
the content of the app, for example videos or news, that can they use Communication or Social Media applications to find
be sad or funny” (P01), “Depending on content of the app my support: “If I am depressed or sad, I use Facebook or WeChat
emotions change” (P08). Many participants (N = 10) mentio- to seek support” (P25).
ned that Social media and Communication apps in particular
affect their emotions: “Instagram or Facebook, depending on Validating the Presence of Outliers
the content, make me feel either happy or sad” (P06). Overall, our results show that application use drives partici-
pants’ emotions more than vice-versa. However, when looking
Theme 2 – App Use Drives Emotions at the detailed graphs produced by CCM, we find that there
Some participants (N = 5) claim that particular apps drive exist certain “outlier” participants: for them, emotions drive
their emotions towards certain directions. According to their application use. We chose to conduct additional analysis for
comments, entertainment apps (e.g., Reddit, Quora, YouTube, these participants, to investigate whether the quantitative re-
9GAG, or music apps) cause positive emotions. For example: sults are reliable or can be attributed to “noise”. We conducted
“YouTube or humour sites (9GAG) make me feel happy” (P04). our analysis by contrasting the CCM results to the comments
A couple of participants stated that social media apps lead these participants made during the interview. For instance, we
to negative emotions as they lead participants to compare observed that certain participants (N = 3) mentioned in the
themselves to their friends on social media. “Facebook and interviews that they prefer to do work when they experience
Instagram make you reflect on your life compared to others’, positive emotions. When we look at their individual quantita-
Facebook is not really a happy app” (P30). tive data, we found that they were the participants for whom
joy drives use of work apps (e.g., Productivity and Business
Several participants (N = 7) mentioned that apps that connect apps) (Figure 13, Supplementary Materials).
them to their families lead to certain emotions depending on
their personal situation and relation to the family or friends. We also investigated the causal relationship between sadness
Positive for some: “WhatsApp and Instagram make me feel and Entertainment apps. We found that sadness drives en-
good as I talk to my close people” (P28), and negative for tertainment app use for two participants (P07, P16). In their
others: “Seeing my family on Facebook makes me sad as I feel interview answers, they both stated that when experiencing
excluded” (P14). negative emotions they listen to music (P07) and play games
(P16) (Figure 14, Supplementary Materials). In addition, in
Theme 3 – Emotions Drive App Use Figure 7 (Supplementary Materials) we see that for two parti-
We asked our participants if their emotions influence the choice cipants, sadness drives social application launch. We examine
of the application they use. Some participants (N = 12) said those participants’ data individually and find that one of them
that when experiencing negative emotions, they seek content (P25) mentioned in their interview that when feeling sad, they
to feel uplifted: “If sad, then I use web browser to find funny use social media applications to feel better. Same participant
or interesting content to read to cheer me up” (P26), “If I happens to be an “outlier” in a causal relationship between
am sad, then I use apps to make me happy (e.g., 9GAG)...” communication applications and their use duration (Figure 12,
(P16), whereas other participants seek for motivation: “I use Supplementary Materials). These examples demonstrate that
Pinterest to look up for ideas and motivation. For example, I causal relationship between application use and user emotions
am now into fitness so I look up motivations to do fitness, or I can operate at an individual level. For some people, emo-
look up for motivation to do something creative” (P28). tions drive application use; however for others, application use
drives their emotions.
Some participants (N = 5) also reported being more active on
social media when they are experiencing positive emotions: DISCUSSION
“If I am happy I post more and use social media more” (P15),
Understanding Smartphone Use and User Emotions
partially to share their happiness: “When happy, I use social
media to share my happiness, or messaging apps” (P13). Our results suggest that the number of launched applications
drives our participants’ emotions for the majority of partici-
In contrast, many participants reported a decrease in phone use pants. This means that the more applications our participants
when they are experiencing positive emotions. Instead they launched, the more likely participants are to experience a wi-
prefer outdoor activities and spending time with friends (N = der range of emotions. This might be due to the fact that
12) or working (N = 10): “When feeling positive emotions I different applications lead to different emotions, based on the
Paper 36 Page 8CHI 2020 Paper CHI 2020, April 25–30, 2020, Honolulu, HI, USA
content of the application. This finding is also supported by Second, we do not need to interrupt our study participants.
our qualitative data, where participants mention that depen- Third, previous work shows that the reliability of self-report
ding on the content of the application, they might experience data deteriorates after several weeks [96], whereas automated
positive or negative emotions. However, for some participants methods should maintain a consistent quality level over long
the causality is reversed: emotions drive the number of ap- periods of time. Today’s smartphones are widely used in pe-
plication launches. This finding can be explained by the fact ople’s day-to-day lives for various purposes and are equipped
that when experiencing certain negative emotions, people tend with many sensors (e.g., accelerometer, gyroscope). As such,
to find distractions and divert their attention [1, 93]. More- they can act as a scientific tool to collect contextual informa-
over, this interpretation is supported by our qualitative data, tion on user’s emotional, social and physical behaviour.
as some of our participants mention this being the case for
In such work it is important to not only accurately detect emo-
them. For example, when asked about their activities when
tions, but also to reliably analyse the relationships between
experiencing negative emotions several participants mentioned
emotions and other phenomena. In this work we use the Co-
they would seek distraction. Alternatively, a strong emotional
nvergent Cross Mapping method, as it has previously been
experience, positive or negative, may motivate someone to
shown to best identify causality (rather than merely correla-
share the experience using their phone. Therefore, the number
of app launches might be an indicator of participants trying to tion) between two variables [89]. The method is applicable to
divert their attention, or share their experience. our work, as we investigate the causal relationship between
users’ emotional state and application use (number of laun-
As for our investigation of the causal relationship between ches and duration), and have very granular data. Our results
duration of application use and participant emotions, we found show that for some participants application use causes them
that for the majority of participants application use duration to experience certain emotions, while for other participants
drives emotions. This finding is supported by our qualitative their emotional states influence their smartphone use. These
results, in which participants mentioned that application use findings are in line with our qualitative data, as our partici-
drives emotions particularly when exposed for a longer dura- pants mention that certain application use leads them to feel
tion: positive content can lead to positive emotions, whereas certain ways, and that the way they feel plays a role on de-
negative content tends to lead to negative emotions. We also ciding which applications to use. Furthermore, recent work
found that for work applications, joy drives application use has utilised CCM to determine the leader and the follower
duration for the majority of participants. Our qualitative data of the facial expressions between the two interlocutors. The
supports the finding that when experiencing positive emotions, results of the study reveal the presence of bidirectional causal
participants tend to continue working, which has also been couplings of the facial dynamics; hence, CCM can establish
showcased in prior literature [92]. evidence for causal behavioural interactions [75].
However, we also observe in our results that for certain ap- Finally, it is important to consider the underlying reliability of
plications categories (e.g., Entertainment, Social) the causal our emotional data. As facial expressions are commonly used
relationship between emotions and application use is stronger. to detect emotional states [18], we used the Affectiva SDK
For example, in the case of entertainment applications, the to collect the user’s emotional state from their facial expres-
causal effect of applications use duration and joy or sadness is sions. We acknowledge that there is an ongoing debate in the
considerably stronger than the relationship between app use research community that facial expressions may not reflect pe-
and other emotions. This is most likely due to the diverse ople’s true emotional feelings [29]. Nevertheless, we validated
content of entertainment applications that can lead to the user the reliability of emotions derived from facial expression in
experiencing both joyful (e.g., watching a comedy on Netflix) numerous ways to ensure the robustness of our findings. First,
and distressing emotions (e.g., losing in a game [42]). The there is a statistically significant positive correlation between
same explanation can be applied to Social applications [5]. the self-reports and the Affectiva valence data, even though
both are measured at different frequencies. Second, we plotted
Emotion Detection and Analysis
the weekly trends of joy and sadness, which are in line with
previous work [88], in that towards the weekend participants’
In recent years there has been a rapid growth of research in the
joy increases while it drops during the week days; whereas
area of affective state sensing, particularly within the HCI com-
sadness drops towards the weekend, and is at its peak on week
munity [107]. The potential benefits of successfully sensing
days. Third, our outlier analysis confirms the agreement be-
affective states have been discussed in e.g., Calvo et al. [14].
tween our quantitative and qualitative data from participants
However, mood and emotional state sensing is challenging,
that reported using certain apps when they were feeling a cer-
especially when conducted in-the-wild, such as data collection
tain way. Finally, the results of our validation study show
issues. Therefore, investigating and developing effective mood
a high level of reliability in detecting surprise, joy, disgust,
and emotional state detection techniques using accessible ubi-
sadness and contempt. However, the accuracy of Affectiva in
quitous and wearable technology, without relying on high-cost
detecting anger and fear was considerably lower. Therefore,
bespoke hardware [107], is an important challenge. Although
we removed these emotions from our analysis.
self-report methods such as the Experience Sampling Method
have seen increased popularity in our community, automated
sensing techniques have a number of potential advantages. Implications for Research and Practice
First, we can collect many more samples throughout the day – One of the objectives of HCI, and in particular UbiComp re-
providing a more detailed report on the user’s affective state. search, is to surround humans with sensitive and responsive
Paper 36 Page 9CHI 2020 Paper CHI 2020, April 25–30, 2020, Honolulu, HI, USA
technology, unobtrusively embedded in the environment [102]. and not a participant specific issue. This is an identified pro-
To sense and respond to human needs, the environment should blem and was recently brought up by Khamis et al. [46].
be able to invigilate humans’ physical, mental, and emotional Although the authors suggest instructing participants to hold
state [11]. Previous work has shown that smartphones can be the phone in specific ways, we did not follow this recommen-
successfully leveraged to detect physical context (e.g., environ- dation, in order to allow more realistic phone use conditions.
ment [2, 82], physical [103] and situational impairments [34, Furthermore, we ran the study for an extensive period of time
83]) as well as to the cognitive context of the user, such as to ensure sufficient data points were collected. Moreover, we
their emotional state [8, 61] or stress [81]. recognise that Affectiva performs better on high-quality ima-
ges when compared to lower quality images that are more
Although prior work has studied the effect of smartphone use likely to occur in a real-world scenario. Therefore, we went
on a user’s emotional state [61, 65], in our work we show
beyond a laboratory validation by inclusion of ESMs and ana-
that the causal relationship between emotions and application
lysis of daily/weekly trends.
use is in fact bidirectional. Furthermore, our findings demon-
strate that the causal relationship between emotional state and In addition, there is an ongoing debate about the CCM me-
smartphone use varies between people. This is unsurprising, thod within the research community. For example, Palušand
as emotions and behaviour are intrinsically personal. What colleagues argue that CCM cannot be used to infer the di-
remains unclear from our analysis is whether the stark diffe- rection of causality, but rather capture forecasting ability. In
rences between participants are ephemeral or persistent. In particular, they state that CCM lacks any arrow of time in its
other words, do participants experience causality in the same formulation [69]. Nevertheless, Sugihara et al. state that if
direction over long period of times, or does causality reverse variables are mutually coupled, they will cross map in both
over time. For instance, it may be plausible to expect that directions. Moreover, the authors state that the strength of
under stress, the direction of the causality may change. coupling defines the relative strength of causal effect [89].
It is also important to consider the implications of our findings Furthermore, due to emerging challenges related to battery
that emotional states can drive application use, as a great deal conservation and privacy protection, Android Accessibility
of HCI work promotes emotional well-being [3, 9, 15]. If services were switched off from time to time, which resulted
someone’s experience of a particular emotional state leads to in application data not being collected. In some cases our
a certain type of smartphone use which can in turn influence participants switched on the Accessibility services instantly
emotional states, it may be that the person is using their phone when they saw the notification from the ‘ApplicationTracker’,
in an attempt to influence their emotional state. “Emotion but in some cases they did not. This resulted in data loss on
regulation” [38] has been defined as: “all of the conscious smartphone use. Finally, some participants noticed a slight
and non-conscious strategies we use to increase, maintain, or increase in battery use due to constant data collection during
decrease one or more components of an emotional response”. phone use. Although no participants reported a major com-
A large body of work in psychology has demonstrated the plaint about battery drain, this issue could be mitigated by
importance of emotion regulation in daily life and its important lowering the scanning rate.
influence on well-being [39].
Some emotion regulation strategies that have been studied by CONCLUSION
psychologists, such as distraction, may be particularly suited In this work, we investigate the bidirectional causal relation-
to technological mediation. Our findings suggest that the in- ship between the emotional state of users and their phone
vestigation of digital emotion regulation using smartphones use. Our results show that for some participants, the use of
should be conducted at the level of individual users, since particular apps causes them to experience certain emotions;
different participants exhibited different relationships between however, for other participants, their emotions drive app use
emotion and phone use. Personalised predictive models would behaviour. We also found noticeable differences between
produce more accurate results in detecting emotion regulation different application categories with regards to their causal
for particular users, as those are built and trained on a single relationship with the users’ emotional state. These quantitative
user’s data. Such an approach could also extend existing smart- findings corresponded with qualitative results showing that
phone features designed to help people understand their phone participants mentioned that certain applications cause them to
use. For example, Apple’s iOS now allows users to track how experience certain emotions, and that feeling certain emotions
much time they spend on applications. Personalised models led them to use certain applications. Our findings are a step
that incorporate a user’s emotional state during phone use co- towards building personalised models which can help users
uld help users understand how their phone use may be driven better understand the relationship between their phone use is
by their emotions and vice-versa. This could allow users to intertwined with their emotional states. This could potentially
better understand the emotional causes and consequences of lead to more effective decision-making with regards to smart-
their phone use habits and, if appropriate, try to change them. phone use as well as better technology-mediated support for
emotion regulation.
Limitations
Our study has a number of limitations. We lost 5.5% of the
emotions data due to Affectiva not being able to detect emo- ACKNOWLEDGEMENTS
tions when the participants’ face was not in full view of their This work is partially funded by ARC Discovery Project
smartphone’s frontal camera. This is a generalised limitation DP190102627 and NHMRC grant 1170937.
Paper 36 Page 10You can also read