DRAFT - ECONOMIC DEVELOPMENT STRATEGIC PLAN BORON, CA - Kern ...
←
→
Page content transcription
If your browser does not render page correctly, please read the page content below
FEBRUARY 2017

ECONOMIC DEVELOPMENT
STRATEGIC PLAN
BORON, CA

DRAFT
BORON, CA                                                                                                  DRAFT

ACKNOWLEDGEMENTS
TIP Strategies would like to thank the many individuals who participated in the creation of this Economic
Development Strategic Plan. We are especially grateful to the community and business leaders in Boron who
contributed their time and input throughout this planning process. Their expertise helped us build a better
understanding of the community’s assets and opportunities. We are also thankful for the US Department of Defense
Office of Economic Adjustment for their visionary investments and support which helped make this project a reality.
We also want to thank the leadership and staff of Kern County and the Kern EDC for their essential support,
guidance, and feedback during the development of this plan.

BORON KEY STAKEHOLDERS
This is an incomplete list and will need to be completed before the document is finalized and released.

 Isabelle Brassard, Managing             Tania Lewis, Community Affairs        Nathan Francis, AICP
 Director, Borate Operations             Advisor                               Land Manager
 Rio Tinto Minerals                      Rio Tinto Minerals                    Rio Tinto Minerals
 Name, Title                             Name, Title                           Name, Title
 Organization                            Organization                          Organization

KERN COUNTY PROJECT TEAM
 Supervisor Zach Scrivner, Chairman of the Kern County Board of Supervisors & 2nd District Supervisor
 Teresa Hitchcock, Assistant County Administrative Officer for Policy & Economic Development
 Thomas Brown, Administrative Analyst
 Richard Chapman, President & CEO, Kern Economic Development Corporation
 Ryan Rush, Field Representative, Office of Supervisor Zach Scrivner

TIP STRATEGIES CONSULTING TEAM
 Tom Stellman, President/CEO
 John Karras, Senior Consultant
 Meredith Eberle, Project Support

CHABIN CONCEPTS CONSULTING TEAM
 Audrey Taylor, President & CEO
 Vicki Doll, Principal
 Fawn McLaughlin, Principal, FJMcLaughlin & Associates

ECONOMIC DEVELOPMENT STRATEGIC PLAN                                                                       PAGE | I
BORON, CA                                                                                                                                 DRAFT

CONTENTS
ECONOMIC DEVELOMPENT STRATEGIC PLAN............................................................................................ 1
   INTRODUCTION................................................................................................................................... 1
   2016 REAFFIRMATION OF BORON VISION ............................................................................................ 2
   SITUATIONAL ANALYSIS ........................................................................................................................ 2
   2017-2021 IMPLEMENTATION............................................................................................................... 4
   30-60-90 DAY LAUNCH SCHEDULE ...................................................................................................... 13
APPENDIX A: ECONOMIC ASSESSMENT & SWOT ANALYSIS ................................................................... 14
   SWOT ANALYSIS ............................................................................................................................... 14
   BUSINESS, INDUSTRY, & EMPLOYMENT TRENDS ................................................................................... 15
   WORKFORCE TRENDS & CHARACTERISTICS ......................................................................................... 25
   COMMUTING PATTERNS..................................................................................................................... 30

Image Credits: TIP Strategies staff photo by John Karras.

ECONOMIC DEVELOPMENT STRATEGIC PLAN                                                                                                   PAGE | II
BORON, CA DRAFT
ECONOMIC DEVELOPMENT STRATEGIC PLAN
INTRODUCTION
Kern County and community leaders in the unincorporated community of Boron completed a visioning effort for the
community’s downtown business area in 2014. The project area was defined as the commercial areas along Boron
Avenue and Twenty Mule Team Road, comprising approximately 150 acres, forming an upside-down “T” extending
along Boron Avenue from the State Route 58 interchange at the northern end to the railroad tracks at the southern
end. It also follows Twenty Mule Team Road west from Wesley Street to Green Street on the east. The 2014 Boron
Revitalization Vision Plan was initiated to revitalize and enhance Boron. The Kern County Planning and Community
Development Department, with the support of Second District Supervisor Zack Scrivner, funded and spearheaded
the project. The long-range Vision Plan depicts the community’s desired future over the next 20-30 years and serves
as a guide for decision making.
In 2014, Kern County applied for and received funding from the Department of Defense’s Office of Economic
Adjustment for an economic diversification study intended to guide investment in the east county area. In addition to
a regional East Kern Economic Diversification Plan, the grant included the preparation of six community strategies,
Boron among them.
Rather than start anew and in order to make the best use of the grant funds and community members’ time, the
consulting team proposed—and the County and the community agreed—that the best approach was to revisit and
update the 2014 Boron Revitalization Vision Plan.
From July through September 2016, the consulting team met individually and with groups to:
Confirm the validity of the 2014 Vision.
Review and update each of the action items in the 2014 Vision Plan.
Assess the progress/status of priority projects and/or identify new projects.
The recommended action items presented in this 2017 Economic Development Strategic Plan are intended to move
the community forward, lead to an improved business climate, expand economic development opportunities and
support, and build on priority actions currently underway. Unlike the 2014 Boron Revitalization Vision Plan, the
2017 Strategic Plan focuses on actions in the near term (3-5 years) and especially on building the community
capacity and infrastructure needed to support economic growth.
ECONOMIC DEVELOPMENT STRATEGIC PLAN PAGE | 1BORON, CA DRAFT
2016 REAFFIRMATION OF BORON VISION
The 2014 Boron Revitalization Vision Plan identified Boron’s future vision as follows:
Small town atmosphere and quaint character where families live for generations
Home to friendly people who are welcoming to neighbors and visitors with places to gather and socialize
Safe, healthy, and clean environment
Beautiful desert location
Proud of its rich mining history and heritage
Unique and quirky place that is one-of-a-kind in the region
Vibrant, enjoyable, and prosperous place to live, visit, and work
A place for people of all ages to learn, create, and be active in the community
On July 21, 2016, at a Boron community meeting, this vision was validated as still relevant for inclusion in the
2017 Economic Development Strategic Plan.
SITUATIONAL ANALYSIS
These findings are taken from the 2014 Visioning Plan, 2016 site visits, focus groups, community meetings, and
personal interviews.
COMMUNITY ASSETS:
Friendly and welcoming community
Generations of families
Small town and rural location
Mining heritage
Museums
COMMUNITY NEEDS:
New businesses and shopping options, especially hardware and auto parts stores
Medical care, pharmacy, hospital, clinic and doctors
Gas station
New jobs in general and, specifically, new job opportunities for local residents
Sidewalks, crosswalks, and street furnishings
Manufacturing, wholesale, and distribution jobs
ECONOMIC DEVELOPMENT STRATEGIC PLAN PAGE | 2BORON, CA DRAFT
OPPORTUNITIES FOR PROJECTS AND PROGRAMS
Community-Led
Entrepreneurial growth from working with regional partners such as GAVEA, Kern EDC, the CSU-Bakersfield
SBDC, and other organizations
Collaborate with other communities for tourism (Twenty Mule Team Museum, Borax Museum, Aerospace
Museum, reach out to other cities to help with the packaging) rack cards at hotels, California City Chamber
of Commerce, social media, Facebook, limited options for OHV (but may have potential)
Youth activities
Adult and youth education/job training programs
Community gardens
Building restoration and maintenance
Beautification and cleanup events
Marketing and promotions
County-Led
Sidewalks, maintenance, and repair (especially in front of museum) to encourage people to use the
crosswalk
Freeway 58 being completed between here and Barstow
Building façade improvement program
Business recruitment and retention program
Local hiring program
Code compliance/enforcement, street lighting, landscaping, sidewalks, and safe crossings
Wayfinding strategy, consistent design theme, and improvements for public signs
ECONOMIC DEVELOPMENT STRATEGIC PLAN PAGE | 3BORON, CA DRAFT
2017-2021 IMPLEMENTATION
Listed below are the projects presented in the 2014 Boron Revitalization Vision Plan that were identified as priorities
to be implemented within the next five years and the additional strategies identified at the 2016 Boron community
meetings. Along with the accomplishments that have been made to date are the recommended actions for 2017.
These implementation action items are in keeping with the original 2014 Plan and the priorities that were agreed
upon at the July 2016 Boron community meeting.
2016 PRIORITY ACTION SECTORS
1. Education and Training
2. Retail and Professional Recruitment (medical care facilities and gas stations)
3. Marketing and Promotions (businesses and visitors)
4. Manufacturing and Distribution (companies and jobs)
2017 IMPLEMENTATION: BORON REVITALIZATION STRATEGY
Each 2014 action is accompanied by documentation of its progress as of 2016 and any activities needed to move the
action forward in 2017. The following symbols are used to provide an at-a-glance description of the status for each
action.
2016 STATUS No Activity Completed Underway
2017 ACTIONS Actions Assigned No Actions Required
COMMUNITY-LED ACTIONS
ACTION: Revitalize Boron 2016 STATUS 2017 ACTIONS
Create a leadership team to coordinate and oversee implementation of
the community project priorities to increase the economic vitality and
prosperity of Boron.
1. Identify a group of community leaders to coordinate the implementation actions, including youth leaders.
2. Develop a marketing theme including a logo and slogan to establish and strengthen Boron’s image. Encourage
local students to participate in the process.
3. Develop strategies to fill gaps in retail, professional services, manufacturing, and distribution jobs.
2016 ACCOMPLISHMENTS AND STATUS:
1. Boron has not yet developed the Revitalize Boron Leadership Team; however, they are in the process of
reviewing a new list of volunteers to revisit the Vision Plan and this Revitalization Strategy.
2. Boron slogan developed: “Boron Rocks”.
3. Boron has been very successful in recruiting targeted businesses including a new Shell gas station, Karl’s
Hardware, and a Dollar General Store. The Hospital District is in communication with Adventist Health to
investigate the feasibility of establishing a rural clinic in Boron.
ECONOMIC DEVELOPMENT STRATEGIC PLAN PAGE | 4BORON, CA DRAFT
2017 ACTION ITEMS:
1. Form Revitalize Boron Leadership Team.
2. Review this 2017 strategy and develop a meeting schedule and agendas for the upcoming year.
3. Initiate the 30-60-90 implementation strategy.
4. Continue discussions with the Hospital District and Adventist Health to locate additional health facilities and
professionals in Boron.
5. Promote the use of small business incentives and financing tools in Boron and link entrepreneurs to programs.
Provide technical assistance to entrepreneurs to help them secure financing by developing better networking to
resources such as the Kern SBDC and Kern EDC.
6. Assemble a business recruitment package to include a market profile sheet, information on available buildings and
land for sale/lease, and information on available financial assistance programs and development incentives.
7. Continue health services recruitment efforts.
ACTION: Beautify Boron 2016 STATUS 2017 ACTIONS
Project to include activities such as:
1. Park enhancements
2. Public art/murals
3. Adopt a “__” Program (e.g. bench, planter, gateway, etc.)
4. Cleanup events
5. Repainting of buildings
6. Building restoration
2016 ACCOMPLISHMENTS AND STATUS:
1. Installation of a new bench and a new “Welcome to Boron” gateway sign installed on Twenty Mule Team Road
at the east end of town.
2. In 2015, the library and the adjacent building received new façades using RenewBiz funding.
3. New landscaping at the Muroc Hospital District building and improvements to the building interior (new tile,
lighting, ADA compliant, paint, etc.) were completed.
2017 ACTION ITEMS:
1. Replace the old gateway sign on the west side of town. Also, consider a gateway sign off of the freeway on
Boron Ave.
2. Continue to apply for RenewBiz funding for building façade and interior improvements.
3. Continue to work with community volunteers for new benches and street furniture.
ACTION: Enrich Boron 2016 STATUS 2017 ACTIONS
This should include activities such as:
1. After-school and summer youth programs
2. Counseling and support group program
3. Mentoring program
ECONOMIC DEVELOPMENT STRATEGIC PLAN PAGE | 5BORON, CA DRAFT
4. Special interest classes for all ages, such as emergency preparedness, CPR, art, music, computer skills, baking,
robotics, finances, and safety
5. Education and technical assistance to enhance business operating practices
2016 ACCOMPLISHMENTS AND STATUS:
1. Creation of Boron Alive, a new nonprofit, working on education and training needs in Boron. Representatives
have been in conversation with Susan Clipperton (ROP coordinator for Mojave USD) to expand education and
training offerings in Boron.
2. A welding class is offered through ROP at the high school.
3. Vocational training (e.g., information technology), graphic arts, business, and web building classes are offered
at the high school. However, these offerings are not supported by industry-certified curriculum and qualified
instructors, so enrollment is very low.
Lack of transportation is a serious barrier to education and training. Public transit is available to Mojave on
Wednesdays only at four scheduled times.
2017 ACTION ITEMS:
1. Collaborate with the Kern County Office of Education (http://kern.org/cte/) and the Desert Junior/Senior High
School to develop more robust CTE offerings in Boron.
2. Explore opportunities to reuse vacant buildings as venues to host community education classes, activities, and
career events such as job fairs for local and regional industries.
3. Explore other possible transportation options for youth and adults commuting to school/training in the region
such as carpooling, Lyft, and Uber. Consider eligibility for transportation stipends associated with a social
service program.
ACTION: Connect Boron 2016 STATUS 2017 ACTIONS
This action can be achieved through:
1. Regular community meetings
2. Concerts in the park
3. Craft fairs
4. Flea markets
5. Volunteerism and volunteer recruitment program
2016 ACCOMPLISHMENTS AND STATUS:
Local events help build community. The Chamber of Commerce is the local forum for these events. The community is
interested and supportive, but obtaining and sustaining the number of volunteers needed to host events is challenging.
2017 ACTION ITEMS:
1. Continue to petition the community for volunteers and support for community enrichment activities and events.
2. Continue to seek regional partnerships (Mojave and Rosemond, California City, etc.) to identify mutually shared
goals and strategies for implementation of these goals.
ECONOMIC DEVELOPMENT STRATEGIC PLAN PAGE | 6BORON, CA DRAFT
ACTION: Create a safe Boron 2016 STATUS 2017 ACTIONS
This action can be achieved through:
1. A Neighborhood Watch program
2. Code compliance
3. Sheriff and community partnership meetings
4. Sheriff-sponsored classes on safety
2016 ACCOMPLISHMENTS AND STATUS:
1. Boron initiated and has sustained an active Neighborhood Watch program for the past 18 months.
2. Boron has a code compliance committee that meets with the County code compliance officer(s) monthly. This
committee also works with community members who wish to file complaints.
3. Deputy Sheriff Partnership meetings are just starting. The Deputy Sheriff has been attending lunches on a bi-
monthly basis at the Senior Center. In addition, the Deputy is starting a “Coffee with the Sheriff” program. This
program will be actively promoted through the Chamber’s new/updated website and flyers.
2017 ACTION ITEMS:
1. Continue to support the Neighborhood Watch program.
2. Continue the code compliance committee and investigate new programs/activities to assist Boron property
owners/tenants identify resources/options to help them come into and stay in compliance.
3. Continue to sponsor Sheriff partnership events and activities.
ACTION: Enhance visitor attraction 2016 STATUS 2017 ACTIONS
This action can be achieved through:
1. A tourism attraction group
2. Marketing and promotions plan
3. A visual storefront/window display training workshop and contest
4. A business window holiday decorating contest
5. An advertising training workshop
6. A business engagement mixer where investors, business leaders, and customers can network
7. Positive media stories/press releases to enhance Boron’s image and support its brand
2016 ACCOMPLISHMENTS AND STATUS:
1. The chamber is collaborating with other communities and cities in the region to promote the region to visitors. In
2015, the three communities (Rosemond, Mojave, and Boron) received three grants (totaling $18,000) through
the Kern County Board of Trade. This collaboration is an excellent example of the benefits of working together.
The three communities have sustained and built on their shared experiences with the Visioning Plan. The funds
are being used to develop:
A Desert Triangle Website (Highways 58, 395, and 14): The plan is to visit every visitor attraction on these
routes and promote them (Mojave is the lead).
ECONOMIC DEVELOPMENT STRATEGIC PLAN PAGE | 7BORON, CA DRAFT
A social media platform to showcase and keep the three communities “top of mind” for visitors (Friends of
Jawbone is the lead).
A brochure that captures the events, activities, and assets of the three communities (Rosemond is the lead).
2017 ACTION ITEMS:
1. Finish the Boron Chamber of Commerce’s new website and include more information about the community,
businesses, venues, and events geared toward both visitors and residents. Include a celebration of recent
successes and projects. Also provide links to regional partners’ websites (Desert Triangle, Rosemond, Mojave
and California City, etc.).
2. Develop a “promotions” plan for distribution of new Desert Triangle brochures.
3. Commit to the placement of a monthly press release, through local media and Desert Triangle’s social media
outlets, on interesting new events/activities in Boron.
4. Invite the Kern SBDC to host an advertising and promotions workshop in Boron for local merchants.
ACTION: Fund Boron 2016 STATUS 2017 ACTIONS
This action can be achieved through activities such as:
1. Establishing a group to seek funding and apply for grants to fund
implementation of this Revitalization Strategy.
2. Establishing a group to discuss private funding sources, including grants from local industry/major employers to
invest in the economic revitalization of Boron.
2016 ACCOMPLISHMENTS AND STATUS:
1. Partnering with Rosemond and Mojave, the community obtained an $18,000 Kern County Board of Trade grant.
2. Obtained annual RenewBiz grants for building facades and improvements to the Hospital District building.
3. A major employer (Rio Tinto) has financially supported the Chamber of Commerce and its efforts to increase the
economic viability of the community.
2017 ACTION ITEMS:
Continue to seek and secure funding for implementation of the Economic Revitalization Strategy from both private
and public sector entities.
COUNTY-LED ACTIONS
ACTION: Develop a Capital Improvement Plan for priority projects and 2016 STATUS 2017 ACTIONS
continue to provide funding and seek funding.
2016 ACCOMPLISHMENTS AND STATUS:
No activity.
2017 ACTION ITEMS:
Continue conversations with County offices and reinforce Boron’s interest in developing and implementing a Capital
Improvement Plan for priority projects.
ECONOMIC DEVELOPMENT STRATEGIC PLAN PAGE | 8BORON, CA DRAFT
ACTION: Continue to fund commercial façade improvements 2016 STATUS 2017 ACTIONS
2016 ACCOMPLISHMENTS AND STATUS:
Boron has successfully obtained RenewBiz grants through the County for
building interior and façade improvements.
2017 ACTION ITEMS:
Continue to seek grant funding through RenewBiz for façade and interior building improvements.
ACTION: Identify and adopt a selection of development incentives 2016 STATUS 2017 ACTIONS
appropriate for Boron.
2016 ACCOMPLISHMENTS AND STATUS:
No activity.
2017 ACTION ITEMS:
Continue conversations with County offices and reinforce Boron’s interest in developing and implementing
development incentives to encourage and support business expansion.
ACTION: Establish design guidelines for residential and commercial 2016 STATUS 2017 ACTIONS
properties in compliance with adopted design preferences and materials.
2016 ACCOMPLISHMENTS AND STATUS:
No activity.
2017 ACTION ITEMS:
Continue conversations with County offices and reinforce Boron’s interest in establishing design guidelines that
support the adopted design preferences and materials.
ACTION: Consider offering development incentives for submittals for 2016 STATUS 2017 ACTIONS
development along Twenty Mule Team Road and Boron Avenue that
integrate adopted development standards as listed in the Vision Plan.
2016 ACCOMPLISHMENTS AND STATUS:
No activity.
2017 ACTION ITEMS:
Continue conversations with County offices and reinforce Boron’s interest in offering development incentives to
stimulate new development along Twenty Mule Team Road and Boron Avenue.
ACTION: Promote the use of vacant buildings along Twenty Mule Team 2016 STATUS 2017 ACTIONS
Road and Boron Avenue for temporary commercial or public uses.
2016 ACCOMPLISHMENTS AND STATUS:
No activity.
2017 ACTION ITEMS:
Continue conversations with County offices and reinforce Boron’s interest in offering incentives and other
development options to promote the use of vacant buildings along Twenty Mule Team Road and Boron Avenue.
ECONOMIC DEVELOPMENT STRATEGIC PLAN PAGE | 9BORON, CA DRAFT
ACTION: Seek designs for the Miners Plaza through any of the 2016 STATUS 2017 ACTIONS
following approaches:
• Professional RFP process
• Local design competition
• Student course project
• Internships
2016 ACCOMPLISHMENTS AND STATUS:
No activity.
2017 ACTION ITEMS:
Since the development of the 2014 Vision, the community has determined that the location of the proposed “Miners
Plaza” may be better suited for retail than a “gathering place.” This finding should be communicated to the County
Planning Department and deleted from this Strategic Plan.
ACTION: Utilize RFP process to seek designs for the medical campus. 2016 STATUS 2017 ACTIONS
2016 ACCOMPLISHMENTS AND STATUS:
No activity.
2017 ACTION ITEMS:
Continue conversations with County offices and reinforce Boron’s interest in developing a medical campus.
ACTION: Enforce code compliance. Ensure properties within the 2016 STATUS 2017 ACTIONS
project area meet current code requirements.
2016 ACCOMPLISHMENTS AND STATUS:
The Boron Chamber of Commerce has a subcommittee that meets regularly with the County-assigned code
compliance officers to discuss new and ongoing code compliance issues.
2017 ACTION ITEMS:
Continue conversations with County code compliance officers to identify and mitigate code violations. In addition to
citing code violations, the subcommittee is looking for options for helping locals comply. Noncompliance sometimes
results from a lack of money to mitigate the issues.
ACTION: Install continuous sidewalks, curbs, and gutters throughout the 2016 STATUS 2017 ACTIONS
project area.
2016 ACCOMPLISHMENTS AND STATUS:
The Main Street area has been surveyed for continuous sidewalks, but no timeline has been set with the County for
installation.
2017 ACTION ITEMS:
Continue conversations with the County to complete the installation of continuous sidewalks, curbs, and gutters
through the downtown project area.
ECONOMIC DEVELOPMENT STRATEGIC PLAN PAGE | 10BORON, CA DRAFT
ACTION: Install circulation improvements along Boron Avenue and 2016 STATUS 2017 ACTIONS
Twenty Mule Team Road to include improved crossings and safer
intersections for pedestrians.
2016 ACCOMPLISHMENTS AND STATUS:
Speed limit signs were posted, and crosswalks were given new striping in 2016.
2017 ACTION ITEMS:
Continue conversations with County offices and reinforce Boron’s interest in providing safe pedestrian crossings,
especially in heavily trafficked visitor destination areas.
ACTION: Add bike lanes along Twenty Mule Team Road and along 2016 STATUS 2017 ACTIONS
roads connecting to the high school.
2016 ACCOMPLISHMENTS AND STATUS:
The County is seeking grant funding.
2017 ACTION ITEMS:
Continue conversations with County offices and reinforce Boron’s interest in developing bike lanes in key areas of
the community for visitors and locals.
ACTION: Initiate a Safe Routes to School program. 2016 STATUS 2017 ACTIONS
2016 ACCOMPLISHMENTS AND STATUS:
No activity.
2017 ACTION ITEMS:
Continue conversations with County offices and reinforce Boron’s interest in developing safe routes to school.
ACTION: Assess needed improvements to transit service, including 2016 STATUS 2017 ACTIONS
increased frequency and additional bus stop locations at the library and
the new medical campus.
2016 ACCOMPLISHMENTS AND STATUS:
No activity.
2017 ACTION ITEMS:
Continue conversations with County offices and reinforce Boron’s need for enhanced public transit to education and
training providers, employment, and medical centers.
ACTION: Develop a streetscape and furnishings palette and a 2016 STATUS 2017 ACTIONS
landscaping palette that reflect community design preferences for
furnishings and materials.
2016 ACCOMPLISHMENTS AND STATUS:
The 2014 Vision Plan contained designed preferences for streetscape furnishings and materials as well as a color
pallet.
ECONOMIC DEVELOPMENT STRATEGIC PLAN PAGE | 11BORON, CA DRAFT
2017 ACTION ITEMS:
Continue to review and apply the design preferences with new and rehabilitation of structures and work with
property owners and the County building and planning departments to encourage their application in Boron.
ACTION: Install special gateway features (e.g., welcome sign, public 2016 STATUS 2017 ACTIONS
art monument, pillars, landscaping) at the three major entrances into
town.
2016 ACCOMPLISHMENTS AND STATUS:
A new gateway sign was installed on Twenty Mule Team Road at the east end of town.
2017 ACTION ITEMS:
1. Continue to work with the County to replace the old gateway sign on the west side of town.
2. Work with the County and property owners to install a new gateway sign off the freeway on Boron Avenue.
ACTION: Develop a design concept for the Desert Rock Walk and 2016 STATUS 2017 ACTIONS
Heritage Walk to include a location map, materials and furnishings
palette, and site plan.
2016 ACCOMPLISHMENTS AND STATUS:
No activity.
2017 ACTION ITEMS:
Continue conversations with County offices and reinforce Boron’s desire for a design concept for the Desert Rock
Walk and Heritage Walk.
ACTION: Develop and implement a wayfinding program that promotes 2016 STATUS 2017 ACTIONS
the marketing theme for Boron (both pedestrian and vehicles).
2016 ACCOMPLISHMENTS AND STATUS:
No activity.
2017 ACTION ITEMS:
Continue conversations with County offices and reinforce Boron’s interest in developing and implementing a
wayfinding program.
ACTION: Construct the Miners Plaza.
2016 STATUS 2017 ACTIONS
2016 ACCOMPLISHMENTS AND STATUS:
No activity.
2017 ACTION ITEMS:
No action necessary since the development of the 2014 Vision, the community has determined that the location of
the proposed “Miners Plaza” may be better suited for retail than a “gathering place.”
ECONOMIC DEVELOPMENT STRATEGIC PLAN PAGE | 12BORON, CA DRAFT
ACTION: Continue to seek grants or funding sources for water 2016 STATUS 2017 ACTIONS
treatment equipment and/or facilities.
2016 ACCOMPLISHMENTS AND STATUS:
No activity.
2017 ACTION ITEMS:
Continue conversations with County offices and the water district to reinforce Boron’s interest in seeking grants or
funding for water treatment equipment and/or facilities.
30-60-90 DAY LAUNCH SCHEDULE
This launch schedule is provided as a guide to getting organized and started on 2017 activities.
30 DAYS
Form the Revitalize Boron Leadership Team
1. Establish a chairperson.
2. Develop meeting schedule.
3. Review 2017 Boron Revitalization Strategy and select priority projects/tasks for the first 12 months.
Boron depends on community volunteers to successfully implement this strategic plan. To avoid “volunteer burnout”,
engage as many people as you can. Those who are already involved in the economic development of Boron should
look for every opportunity to invite others to participate and allow for varying levels of participation and time
commitment. Consider business owners, commercial property owners, retirees, students, and workers (including
commuters).
60 TO 90 DAYS
Meet with Relevant Partners.
For the priority projects selected for the first 12 months, contact the external partners relevant to the successful
implementation of the project (e.g., County departments, District Supervisor, KEDC, GAVEA, School District,
individuals, etc.). Review the projects, action items, schedules, etc. The objective is to get buy-in and establish
reasonable timelines for accomplishing the project/activity. Revise the 12-month project/task timeline as needed.
QUARTERLY
Communicate with residents, local businesses, external partners, Kern County Supervisors, and relevant Kern
County departments on the status of implementation, including any challenges the leadership team is having.
ANNUALLY
Annually monitor achievements, update status, record performance metrics, and reaffirm or establish new goals and
projects. Prepare a year-end report and share with relevant partners and the community. Include priority projects for
the following year, milestones to achieve, and an invitation to volunteers to assist with Boron Revitalization efforts.
ECONOMIC DEVELOPMENT STRATEGIC PLAN PAGE | 13BORON, CA DRAFT
APPENDIX A: ECONOMIC ASSESSMENT &
SWOT ANALYSIS
To provide a foundation for the planning process, TIP conducted an assessment of demographic and economic
factors that impact Boron’s competitiveness. Our economic assessment provides a quantitative understanding of the
demographic and economic trends impacting the community. Except where specified, the data in this section is for
the 93516 ZIP Code, which covers Boron.
SWOT ANALYSIS
In addition to our review of economic and demographic data, our understanding of Boron was informed by
discussions with local community and business leaders. Based on this work, as well as our experience working in
communities across the US, we have developed an analysis of the community’s strengths, weaknesses,
opportunities, and threats, commonly referred to as a SWOT analysis. The results of this analysis are outlined
below.
STRENGTHS
• Twenty Mule Team Museum
• Saxon Aerospace Museum
• Boron Alive! nonprofit organization
• New planned medical clinic associated with new Tehachapi hospital
WEAKNESSES
• Limited retail options, services, and amenities
• Lack of municipal city government is a barrier, limiting the resources (financial and political) available for
local economic development
OPPORTUNITIES
• Boron Vision Plan recommendations and funding for improvements
• Make connections with the thousands of annual visitors to Twenty Mule Team Museum and Saxon
Aerospace Museum
• Establish a Municipal Advisory Council (similar to Rosamond)
• Boron/Desert Lake pedestrian path
THREATS
• Over-reliance on a single large employer (Rio Tinto)
ECONOMIC DEVELOPMENT STRATEGIC PLAN PAGE | 14BORON, CA DRAFT
BUSINESS, INDUSTRY, & EMPLOYMENT TRENDS
EMPLOYMENT
Total employment in Boron declined by nearly 20 percent during the 2008-2009 recession, but has since recovered
to its long-run average of approximately 1,200 jobs. Ranked by total employment, Boron is the smallest local
economy of the East Kern communities included in this analysis.
FIGURE 1. EMPLOYMENT TRENDS, 2005-2015
TOTAL ANNUAL EMPLOYMENT IN BORON (93516)
1,400
1,200
1,000
800
600
400
200
0
2005
2006
2007
2008
2009
2010
2011
2012
2013
2014
2015
Source: EMSI 2016.2 – QCEW Employees, Non-QCEW Employees, and Self-Employed
On a percentage basis, Boron led the East Kern region in job growth between 2010 and 2015. Boron was the only
area in the region where total employment increased by at least 20 percent during the five-year period. In fact,
despite its smaller size, Boron’s job growth exceeded many of the other communities in terms of actual numbers.
FIGURE 2. EMPLOYMENT & WAGES
EMPLOYMENT CHANGE, 2010-2015 & MEDIAN HOURLY WAGE, 2015
2010 to 2015 Median
Geography 2010 2015 Net Chg. % Chg. Hourly Wage
Boron (93516) 1,047 1,268 +221 +21.1% $21.86
Kern County 304,055 347,169 +43,114 +14.2% $19.81
California 16,565,942 18,392,737 +1,826,795 +11.0% $23.28
Greater Antelope Valley 106,645 117,602 +10,957 +10.3% $22.17
US 144.2 M 155.3 M +11.2 M +7.7% $20.82
Tehachapi (93531 & 93561) 5,741 6,013 +272 +4.7% $21.01
East Kern 28,754 29,456 +702 +2.4% $24.17
Rosamond (93560) 2,477 2,532 +55 +2.2% $23.55
Ridgecrest (93527 & 93555) 11,586 11,772 +186 +1.6% $24.48
Mojave (93501) 2,828 2,812 -16 -0.6% $23.64
California City (93505) 2,414 2,384 -30 -1.2% $27.82
Source: EMSI 2016.2 – QCEW Employees, Non-QCEW Employees, and Self-Employed. Median hourly wages above the US average are shaded.
ECONOMIC DEVELOPMENT STRATEGIC PLAN PAGE | 15BORON, CA DRAFT
Job growth in Boron spiked in 2011, with gains exceeding 15 percent over the prior year, as the community
recovered much of the losses incurred during the 2008-2009 recession. In subsequent years, however, the trajectory
of employment growth in the community has largely reflected regional trends. Boron’s job growth in 2015 was
modest, rising just 0.4 percent, roughly equivalent to that of East Kern overall, which saw a 0.6 percent increase
over the prior year.
FIGURE 3. EMPLOYMENT TRENDS, 2010-2015
ANNUAL JOB GROWTH RATE (PERCENT CHANGE FROM PRIOR YEAR)
Boron (93516) East Kern Kern County Greater Antelope Valley US
15.0%
10.0%
5.0%
0.0%
-5.0%
-10.0%
2010
2011
2012
2013
2014
2015
Source: EMSI 2016.2 – QCEW Employees, Non-QCEW Employees, and Self-Employed
ECONOMIC DEVELOPMENT STRATEGIC PLAN PAGE | 16BORON, CA DRAFT
Boron’s economy is heavily dependent on employment in the mining sector, which accounts for more than one-
half of all jobs in the community. The next two largest sectors, as a share of total employment, are retail (10.2
percent) and administrative and support services (7.7 percent). Compared to the region as a whole, Boron also
stands out with regard to its share of employment in healthcare, with the sector accounting for less than 4 percent
of local jobs.
FIGURE 4. INDUSTRY DISTRIBUTION (% OF TOTAL), 2015
COMPARISON OF BORON (93516) WITH SELECTED GEOGRAPHIES AND US
Greater
Antelope
NAICS Code & Description Boron (93516) East Kern Kern County Valley US
21 Mining (incl. oil & gas) 55.4% 2.4% 3.4% 0.6% 0.5%
44-45 Retail trade 10.2% 10.4% 9.7% 15.9% 10.6%
56 Admin. & support services 7.7% 5.3% 4.6% 5.5% 6.3%
9011 Federal govt. (civilian) 4.9% 21.1% 2.9% 7.5% 1.9%
72 Lodging, restaurants, & bars 4.8% 8.3% 6.6% 10.5% 8.5%
62 Healthcare & social assistance 3.7% 9.3% 10.5% 19.2% 13.3%
9039 Local govt. 3.6% 2.9% 3.8% 2.8% 3.6%
48-49 Transportation & warehousing 2.9% 2.3% 2.9% 2.7% 3.4%
23 Construction 2.7% 3.0% 6.2% 4.6% 5.4%
9029 State govt. 2.1% 1.7% 2.2% 0.6% 1.5%
22 Utilities 0.4% 0.8% 0.3% 0.3% 0.4%
52 Finance & insurance 0.4% 1.5% 1.7% 2.0% 3.9%
81 Personal & other services 0.4% 4.7% 3.6% 5.7% 4.9%
31-33 Manufacturing 0.4% 4.6% 4.3% 3.0% 8.2%
11 Agriculture & forestry 0.0% 0.0% 18.0% 0.1% 1.3%
42 Wholesale trade 0.0% 1.5% 2.8% 1.5% 3.9%
51 Information 0.0% 0.5% 0.8% 0.9% 1.9%
53 Property sales & leasing 0.0% 1.7% 1.2% 1.8% 1.7%
54 Professional services 0.0% 8.2% 3.6% 5.9% 6.4%
55 Corporate & regional offices 0.0% 0.3% 1.0% 0.1% 1.4%
61 Education 0.0% 8.0% 8.8% 8.0% 9.4%
71 Arts, entertainment, & recreation 0.0% 1.2% 0.9% 0.8% 1.7%
Source: EMSI 2016.2 – QCEW Employees, Non-QCEW Employees, and Self-Employed
Note: Figures exclude military and unclassified employment. Education includes public schools, colleges, and universities. Healthcare & social
assistance includes public hospitals. The three largest industries in each geography are highlighted.
ECONOMIC DEVELOPMENT STRATEGIC PLAN PAGE | 17BORON, CA DRAFT
Location quotient (LQ) analysis can provide an understanding of
an area’s relative strengths. Boron’s LQs highlight the LOCATION QUOTIENT (LQ) ANALYSIS is a
community’s strong concentration of mining employment, which statistical technique used to suggest areas of
is present at more than 100 times the expected level based on relative advantage based on a region’s
employment base. LQs are calculated as an
national patterns. This dramatic LQ is common for communities
industry’s share of total local employment divided
with any amount of mining activity in light of the relatively small
by the same industry’s share of employment at
share the sector comprises of US employment. Other significant
the national level. If the local industry and
concentrations, as measured by LQs, are found in federal and
national industry are perfectly proportional, the
state government (with LQs of 2.69 and 1.52, respectively) and
LQ will be 1.00. LQs greater than 1.25 are
administrative and support services (LQ of 1.33). The analysis presumed to indicate a comparative advantage;
suggests an opportunity to grow Boron’s local services sector, as those below 0.75 suggest areas of weakness but
industries like restaurants; personal services; and arts, may also point to opportunities for expansion or
entertainment, and recreation have much smaller LQs compared attraction.
to East Kern as a whole.
FIGURE 5. CONCENTRATION OF EMPLOYMENT BY SECTOR, 2015
LOCATION QUOTIENT (LQ) ANALYSIS BY SECTOR, US=1.00
Greater
Antelope
NAICS Code & Description Boron (93516) East Kern Kern County Valley US
21 Mining (incl. oil & gas) 116.76 4.93 6.15 1.31 1.00
9011 Federal govt. (civilian) 2.69 11.23 1.55 4.03 1.00
9029 State govt. 1.52 1.19 1.58 0.38 1.00
56 Admin. & support services 1.33 0.81 0.71 0.85 1.00
44-45 Retail trade 1.08 1.05 0.96 1.51 1.00
9039 Local govt. 1.04 0.81 1.08 0.77 1.00
48-49 Transportation & warehousing 0.93 0.70 0.89 0.78 1.00
72 Lodging, restaurants, & bars 0.61 1.02 0.82 1.26 1.00
23 Construction 0.49 0.50 1.05 0.86 1.00
62 Healthcare & social assistance 0.28 0.70 0.79 1.44 1.00
22 Utilities 0.24 2.23 0.87 0.81 1.00
52 Finance & insurance 0.13 0.37 0.42 0.51 1.00
81 Personal & other services 0.09 0.90 0.70 1.15 1.00
31-33 Manufacturing 0.08 0.52 0.51 0.35 1.00
71 Arts, entertainment, & recreation 0.02 0.72 0.58 0.53 1.00
11 Agriculture & forestry 0.00 0.02 14.89 0.07 1.00
42 Wholesale trade 0.00 0.38 0.70 0.37 1.00
51 Information 0.00 0.30 0.50 0.49 1.00
53 Property sales & leasing 0.00 1.03 0.72 1.07 1.00
54 Professional services 0.00 1.20 0.53 0.90 1.00
55 Corporate & regional offices 0.00 0.20 0.67 0.07 1.00
61 Education 0.00 0.85 0.94 0.85 1.00
Source: EMSI 2016.2 – QCEW Employees, Non-QCEW Employees, and Self-Employed
Note: Figures exclude military and unclassified employment. Education includes public schools, colleges, and universities. Healthcare & social
assistance includes public hospitals. LQs greater than 1.25 are presumed to show competitive advantage and are highlighted.
ECONOMIC DEVELOPMENT STRATEGIC PLAN PAGE | 18BORON, CA DRAFT
Boron’s leading employment sectors—mining and administrative services—experienced robust growth between
2010 and 2015 relative to the size of the community’s job base, with more than 100 jobs added to the mining
sector alone during this five-year period. Gains in these two sectors more than offset minor losses in personal
services and federal government during the period.
FIGURE 6. EMPLOYMENT TRENDS BY SECTOR, 2010-2015
NET CHANGE IN JOBS BY SECTOR IN BORON (93516)
Oil, gas, & mining 106
Administrative services 75
Transportation & warehousing 21
Retail trade 14
Restaurants, bars, & hotels 12
Construction 7
Utilities 5
State government 4
Local government 2
Healthcare 2
Manufacturing 0
Finance & insurance 0
Agriculture 0
Wholesale trade 0
Information & media 0
Property sales & leasing 0
Professional services 0
Corporate & regional HQs 0
Education 0
Arts & entertainment -5
Federal government (civilian) -5
Personal & other services -23
Source: EMSI 2016.2 – QCEW Employees, Non-QCEW Employees, and Self-Employed
Note: Figures exclude military and unclassified employment. Education includes public schools, colleges, and universities. Healthcare & social
assistance includes public hospitals.
ECONOMIC DEVELOPMENT STRATEGIC PLAN PAGE | 19BORON, CA DRAFT
RETAIL LEAKAGE
Boron is a small retail market, with total estimated demand from local households of only about $28 million annually.
As a result, the leakage/surplus figures should be viewed with caution. However, the analysis suggests a number of
sectors that could present opportunities for small businesses to start or expand locally. Market opportunities to capture
household expenditures that are currently leaking out of the community include: motor vehicles and parts ($5.5
million), food and beverage stores ($1.6 million), and general merchandise stores ($3.3 million).
FIGURE 7. RETAIL GAP ANALYSIS
BORON (93516)
Estimated Estimated Retail
Retail Sales Purchases of Leakage/
of Area Stores Area Residents Retail Leakage/ Surplus
Retail Sector NAICS (Supply) (Demand) Surplus Percent
Total Retail Sales Incl. Food & Drink $26,469,517 $27,731,758 -$1,262,241 4.6%
Motor Vehicle & Parts Dealers 441 $528,518 $6,069,876 -$5,541,358 91.3%
Automobile Dealers 4411 $0 $4,905,763 -$4,905,763 100.0%
Other Motor Vehicle Dealers 4412 $0 $891,417 -$891,417 100.0%
Auto Parts, Accessories & Tire Stores 4413 $528,518 $272,696 $255,822 93.8%
Furniture & Home Furnishings Stores 442 $52,221 $723,103 -$670,882 92.8%
Furniture Stores 4421 $0 $397,882 -$397,882 100.0%
Home Furnishings Stores 4422 $52,221 $325,221 -$273,000 83.9%
Electronics & Appliance Stores 443 $0 $1,108,337 -$1,108,337 100.0%
Bldg Materials, Garden Equip. & Supply Stores 444 $0 $1,174,464 -$1,174,464 100.0%
Bldg Material & Supplies Dealers 4441 $0 $1,001,066 -$1,001,066 100.0%
Lawn & Garden Equip & Supply Stores 4442 $0 $173,398 -$173,398 100.0%
Food & Beverage Stores 445 $3,272,965 $4,843,329 -$1,570,364 32.4%
Grocery Stores 4451 $2,772,168 $4,187,032 -$1,414,864 33.8%
Specialty Food Stores 4452 $0 $441,128 -$441,128 100.0%
Beer, Wine & Liquor Stores 4453 $500,797 $215,169 $285,628 132.7%
Health & Personal Care Stores 446 $1,247,585 $1,842,431 -$594,846 32.3%
Gasoline Stations 447 $15,654,967 $1,716,209 $13,938,758 812.2%
Clothing & Clothing Accessories Stores 448 $0 $1,426,622 -$1,426,622 100.0%
Clothing Stores 4481 $0 $1,064,969 -$1,064,969 100.0%
Shoe Stores 4482 $0 $174,195 -$174,195 100.0%
Jewelry, Luggage & Leather Goods Stores 4483 $0 $187,458 -$187,458 100.0%
Sporting Goods, Hobby, Book & Music Stores 451 $266,365 $736,793 -$470,428 63.8%
Sporting Goods/Hobby/Musical Instr Stores 4511 $266,365 $665,357 -$398,992 60.0%
Book, Periodical & Music Stores 4512 $0 $71,436 -$71,436 100.0%
General Merchandise Stores 452 $411,614 $3,755,650 -$3,344,036 89.0%
Department Stores Excluding Leased Depts. 4521 $0 $2,397,127 -$2,397,127 100.0%
Other General Merchandise Stores 4529 $411,614 $1,358,523 -$946,909 69.7%
continued, next page
ECONOMIC DEVELOPMENT STRATEGIC PLAN PAGE | 20BORON, CA DRAFT
FIGURE 7. RETAIL GAP ANALYSIS (continued)
Estimated Estimated Retail
Retail Sales Purchases of Leakage/
of Area Stores Area Residents Retail Leakage/ Surplus
Retail Sector NAICS (Supply) (Demand) Surplus Percent
Miscellaneous Store Retailers 453 $230,708 $1,590,136 -$1,359,428 85.5%
Florists 4531 $58,899 $45,148 $13,751 30.5%
Office Supplies, Stationery & Gift Stores 4532 $0 $181,207 -$181,207 100.0%
Used Merchandise Stores 4533 $0 $70,474 -$70,474 100.0%
Other Miscellaneous Store Retailers 4539 $171,809 $1,293,307 -$1,121,498 86.7%
Nonstore Retailers 454 $0 $606,403 -$606,403 100.0%
Electronic Shopping & Mail-Order Houses 4541 $0 $444,010 -$444,010 100.0%
Vending Machine Operators 4542 $0 $14,073 -$14,073 100.0%
Direct Selling Establishments 4543 $0 $148,320 -$148,320 100.0%
Food Services & Drinking Places 722 $4,804,574 $2,138,405 $2,666,169 124.7%
Full-Service Restaurants 7221 $3,830,224 $1,166,047 $2,664,177 228.5%
Limited-Service Eating Places 7222 $974,350 $897,744 $76,606 8.5%
Special Food Services 7223 $0 $46,405 -$46,405 100.0%
Drinking Places - Alcoholic Beverages 7224 $0 $28,209 -$28,209 100.0%
Source: ESRI Community Analyst
ECONOMIC DEVELOPMENT STRATEGIC PLAN PAGE | 21BORON, CA DRAFT
HOUSING INDICATORS
Boron has the highest rate of vacant housing in the East Kern region. One-third of all housing units in Boron are
vacant, according to the latest estimates available. Boron’s median rent of $561 per month was the lowest in the
region. Only Boron and Mojave had median rents below $600 at the time these estimates were prepared.
FIGURE 8. HOUSING CHARACTERISTICS
SELECTED INDICATORS, RANKED BY % VACANT
Total Median Median Yr.
Housing % Owner % Renter Contract Structure
Geography Units Occupied Occupied % Vacant Rent Built
Boron (93516) 1,259 39.2% 27.8% 33.0% $561 1959
California City (93505) 6,117 48.1% 28.7% 23.3% $638 1991
Mojave (93501) 2,360 42.8% 39.0% 18.2% $571 1975
East Kern 48,191 53.2% 29.4% 17.4% $725 1984
Rosamond (93560) 7,307 53.0% 30.5% 16.5% $842 1992
Tehachapi (93531 & 93561) 13,334 59.5% 24.6% 15.9% $774 1987
Ridgecrest (93527 & 93555) 15,985 56.2% 29.8% 14.0% $701 1980
US 132.7 M 56.3% 31.2% 12.5% $767 1976
Greater Antelope Valley 172,738 56.2% 32.0% 11.9% $896 1986
Kern County 287,775 51.2% 38.4% 10.4% $746 1981
California 13,781,929 50.1% 41.4% 8.5% $1,138 1974
Source: US Census Bureau, 2010-2014 American Community Survey 5-Year Estimates (accessed via ESRI Community Analyst). Shaded figures
are above the US average (median rent) or more recent than US (median year built).
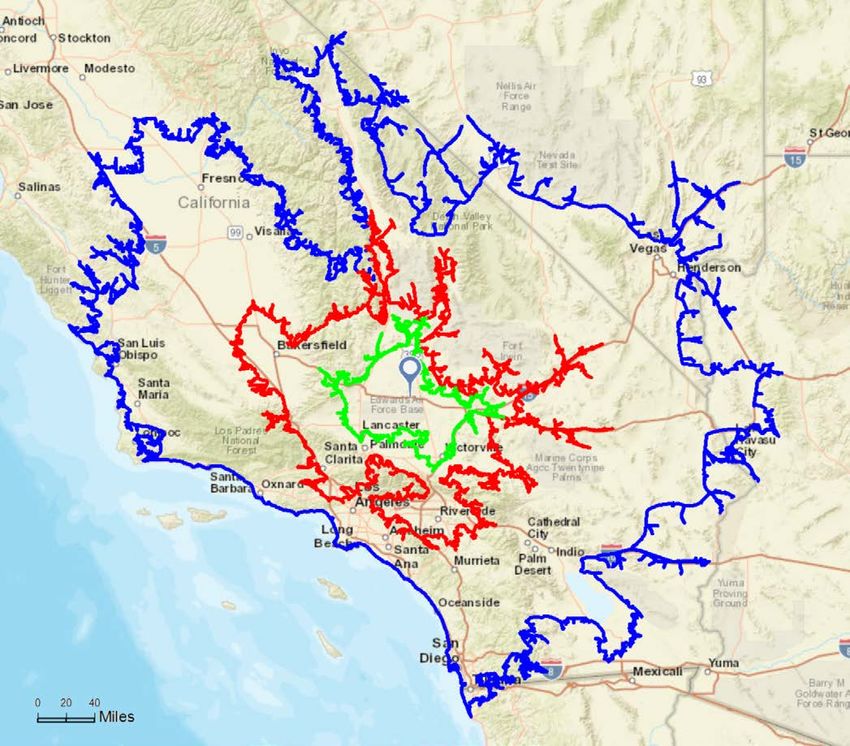
ECONOMIC DEVELOPMENT STRATEGIC PLAN PAGE | 22BORON, CA DRAFT MARKET ACCESS Boron’s one-hour drive time market provides access to a total population of nearly 400,000, with an annual growth rate of approximately 1 percent. The population of Boron’s two-hour drive time market exceeds 7 million and is among the faster growing two-hour drive time markets among the communities include in this analysis. FIGURE 9. DRIVE TIMES MAP: BORON ZIP CODES WITHIN 1-, 2-, & 4-HOUR DRIVE TIMES FROM BORON Source: ESRI Community Analyst ECONOMIC DEVELOPMENT STRATEGIC PLAN PAGE | 23
BORON, CA                                                                                                   DRAFT

Despite its smaller size, Boron’s drive time markets are adding population faster than some larger communities in
the region are. Between 2010 and 2015, Boron’s one-hour drive time market grew by more than 19,000 people,
which represents a larger increase in numeric terms than California City’s one-hour drive time population. Boron’s
two-hour market added nearly 320,000 people during the same period, a level of growth that exceeded the
population gains in two-hour drive time markets for three other East Kern communities.

FIGURE 10. MARKET ACCESS
POPULATION LIVING IN ZIP CODES WITHIN 1-, 2-, & 4-HOUR DRIVE TIMES OF EACH COMMUNITY
1 HOUR
                                                                                      2010 to 2016
Geography                             2010                        2016          Net Chg.           % Chg.
Tehachapi                          874,066                     929,606           +55,540            +6.4%
Rosamond                           607,199                     638,756           +31,557            +5.2%
Mojave                             544,491                     569,639           +25,148            +4.6%
California City                    414,164                     431,520           +17,356            +4.2%
Boron                              372,399                     391,943           +19,544            +5.2%
Ridgecrest                          46,832                      48,136            +1,304            +2.8%

2 HOURS
                                                                                      2010 to 2016
Geography                             2010                        2016          Net Chg.           % Chg.
Rosamond                         13,059,979                 13,559,907          +499,928            +3.8%
Mojave                            9,373,018                  9,736,283          +363,265            +3.9%
Boron                             6,908,695                  7,224,771          +316,076            +4.6%
California City                   5,252,195                  5,478,493          +226,298            +4.3%
Tehachapi                         4,654,457                  4,858,354          +203,897            +4.4%
Ridgecrest                        1,198,858                  1,253,281           +54,423            +4.5%

4 HOURS
                                                                                      2010 to 2016
Geography                             2010                        2016          Net Chg.           % Chg.
Rosamond                         26,280,775                 27,518,233        +1,237,458            +4.7%
Boron                            26,216,513                 27,476,390        +1,259,877            +4.8%
Mojave                           25,936,745                 27,170,207        +1,233,462            +4.8%
California City                  25,856,592                 27,084,228        +1,227,636            +4.7%
Ridgecrest                       25,365,524                 26,586,529        +1,221,005            +4.8%
Tehachapi                        25,049,873                 26,203,551        +1,153,678            +4.6%

Source: ESRI Community Analyst

ECONOMIC DEVELOPMENT STRATEGIC PLAN                                                                  PAGE | 24
BORON, CA DRAFT
WORKFORCE TRENDS & CHARACTERISTICS
Boron’s population is among the region’s oldest with a median age of 40.1 years, a figure second only to
Tehachapi (40.6 years). Population growth in the Boron area trailed the region between 2010 and 2016, declining
by approximately 4 percent, the only one of the East Kern communities to lose population during the period.
FIGURE 11. POPULATION & MEDIAN AGE
POPULATION CHANGE, 2010-2016 & MEDIAN AGE, 2016
2010 to 2016
Geography 2010 2016 Net Chg. % Chg. Median Age
Mojave (93501) 5,408 5,753 +345 6.4% 34.9
Kern County 839,631 888,823 +49,192 5.9% 31.3
US 308.7 M 323.6 M +14.8 M 4.8% 38.0
California 37,253,956 38,986,171 +1,732,215 4.6% 35.8
Greater Antelope Valley 495,354 517,023 +21,669 4.4% 33.0
Rosamond (93560) 18,850 19,548 +698 3.7% 33.4
Ridgecrest (93527 & 93555) 35,023 35,899 +876 2.5% 37.9
California City (93505) 14,054 14,361 307 2.2% 35.2
East Kern 114,449 116,749 +2,300 2.0% 36.9
Tehachapi (93531 & 93561) 35,149 35,260 +111 0.3% 40.6
Boron (93516) 2,295 2,200 -95 -4.1% 40.1
Source: ESRI Community Analyst (2016 forecast); US Census Bureau, Census 2010 (2010 figures). Median age higher than US is shaded.
Boron is among the poorer areas of the East Kern region. According to the latest data available from the US Census
Bureau, the poverty rate in Boron is 36.8 percent, highest among the communities included in this analysis and
more than double national and state rates. Median household income in Boron is $36,567, about one-third lower
than median household income in the region.
FIGURE 12. INCOME LEVELS
INCOME LEVELS, 2016 & POVERTY RATE, 2014
Median Average
Household Household
Geography Income Income Per Capita Income Poverty Rate
California $62,554 $90,812 $30,905 16.4%
Ridgecrest (93527 & 93555) $57,957 $74,855 $29,488 14.7%
US $54,149 $77,008 $29,472 15.6%
Tehachapi (93531 & 93561) $58,847 $82,949 $28,002 12.2%
East Kern $54,987 $72,580 $26,109 17.0%
Rosamond (93560) $53,125 $67,216 $22,677 18.0%
California City (93505) $51,824 $63,378 $22,322 23.9%
Greater Antelope Valley $54,580 $71,887 $22,318 20.4%
Kern County $49,123 $68,628 $21,178 23.4%
Boron (93516) $36,567 $49,015 $19,183 36.8%
Mojave (93501) $36,564 $50,250 $18,733 35.6%
Source: ESRI Community Analyst (2016 forecast); US Census Bureau, 2010-2014 American Community Survey 5-Year Estimates (poverty rate).
ECONOMIC DEVELOPMENT STRATEGIC PLAN PAGE | 25BORON, CA DRAFT
One out of four households in Boron (25.0 percent) has income of less than $15,000 per year, a share that is at least
double the state and US. Boron’s income distribution continues to depart from regional, state, and national patterns as
you move up the scale, with a much larger share of households in brackets below $100,000. At this point, the pattern
reverses, with Boron having much lower percentages of households falling into the upper income cohorts.
FIGURE 13. HOUSEHOLD INCOME DISTRIBUTION
SHARE OF HOUSEHOLDS BY SELECTED INCOME CATEGORIES
$0 to $15k $15k to $35k $35k to $50k $50k to $100k $100k to $150k $150k+
Boron (93516) 25.0% 22.0% 20.4% 21.8% 8.2% 2.6%
East Kern 13.5% 18.5% 12.9% 31.1% 15.6% 8.4%
Kern County 13.9% 22.1% 14.6% 28.7% 12.2% 8.4%
Greater
13.0% 18.3% 14.1% 31.6% 14.3% 8.7%
Antelope Valley
California 10.9% 17.4% 12.0% 28.9% 15.4% 15.4%
US 12.5% 20.1% 13.3% 30.0% 13.4% 10.6%
0% 20% 40% 60% 80% 100%
Source: 2010-2014 American Community Survey 5-Year Estimates (DP-02).
Boron’s age distribution also differs from that of the region, state, and US, skewing towards the older end of the scale.
Seventeen percent of Boron residents are age 65 or older. Likewise, Boron’s young adults (those age 20-64) represent
a much smaller share of the total population in comparison to East Kern (17 percent versus 21 percent).
FIGURE 14. AGE STRUCTURE
SHARE OF POPULATION BY SELECTED AGE GROUPS
Youth (0 to 19) Young adults (20 to 34) Experienced working age (35 to 64) Seniors (65+)
Boron (93516) 27% 17% 39% 17%
East Kern 26% 21% 38% 14%
Kern County 32% 24% 34% 10%
Greater
30% 23% 37% 11%
Antelope Valley
California 26% 22% 38% 13%
US 26% 21% 39% 15%
0% 20% 40% 60% 80% 100%
Source: ESRI Community Analyst
ECONOMIC DEVELOPMENT STRATEGIC PLAN PAGE | 26BORON, CA DRAFT
Boron also trails in educational attainment relative to the rest of the region, as well as when compared to the state and
US. The majority of the population age 25 or older in Boron (59 percent) does not have any education beyond high
school and approximately one in four residents age 25 or older (25 percent) has not completed high school. Only 10
percent of Boron’s adult residents have a bachelor’s degree or higher, about one-third national and state rates.
FIGURE 15. EDUCATIONAL ATTAINMENT
HIGHEST LEVEL OF ATTAINMENT, POPULATION AGE 25+
Less than High School HS Diploma/GED Some College (incl. Associate's) Bachelor's or Above
Boron (93516) 24.9% 34.3% 30.8% 10.0%
East Kern 15.9% 26.9% 38.7% 18.5%
Kern County 27.0% 26.4% 31.4% 15.2%
Greater
20.8% 27.0% 35.9% 16.2%
Antelope Valley
California 18.5% 20.7% 29.8% 31.0%
US 13.7% 28.0% 29.1% 29.3%
0% 20% 40% 60% 80% 100%
Source: 2010-2014 American Community Survey 5-Year Estimates (DP-02).
The Boron area had the highest unemployment rate (26.3 percent) and the lowest labor force participation rate
(37.7 percent) in the East Kern region, according to the latest available data from the US Census Bureau (2014).
Boron’s unemployment rate at that time was nearly three times the national rate and more than double the state’s.
FIGURE 16. LABOR FORCE & UNEMPLOYMENT
LABOR FORCE, UNEMPLOYMENT & LABOR FORCE PARTICIPATION RATES
Labor Force
Population Unemployment Participation
Geography Age 16+ Labor Force Unemployment Rate Rate
Boron (93516) 1,664 627 165 26.3% 37.7%
California City (93505) 10,595 5,751 1,345 23.4% 54.3%
Mojave (93501) 3,928 2,210 497 22.5% 56.3%
Greater Antelope Valley 373,976 209,844 27,778 13.2% 56.1%
Kern County 630,972 372,092 49,041 13.2% 59.0%
Rosamond (93560) 14,843 8,401 1,085 12.9% 56.6%
East Kern 88,971 49,097 6,020 12.3% 55.2%
California 29,934,838 19,108,876 2,084,564 10.9% 63.8%
Ridgecrest (93527 & 93555) 27,036 16,835 1,668 9.9% 62.3%
US 248.8 M 159.0 M 14.5 M 9.1% 63.9%
Tehachapi (93531 & 93561) 28,197 13,570 1,118 8.2% 48.1%
Source: US Census Bureau, 2010-2014 American Community Survey 5-Year Estimates.
ECONOMIC DEVELOPMENT STRATEGIC PLAN PAGE | 27BORON, CA DRAFT
Middle skills occupations—those typically requiring some level of education beyond high school, but less than a
college degree—are a key driver of employment in Boron. The two largest occupational groups, as measured by
their share of all jobs in the community, are transportation & material moving and construction & extraction (which
primarily includes mining occupations). Those two groups account for nearly 40 percent of total employment in
Boron. By comparison, they represent between 10 percent and 14 percent of the other geographies profiled.
FIGURE 17. OCCUPATIONAL DISTRIBUTION (% OF TOTAL), 2015
COMPARISON OF BORON (93516) WITH SELECTED GEOGRAPHIES AND US
Greater
Antelope
SOC Code & Description Boron (93516) East Kern Kern County Valley US
53 Transportation & Material Moving 19.3% 6.2% 7.5% 5.8% 6.6%
47 Construction & Extraction 19.3% 3.4% 6.0% 3.8% 4.5%
43 Office & Administrative Support 10.5% 12.9% 11.2% 15.4% 15.4%
41 Sales & Related 8.6% 8.4% 8.1% 12.1% 10.3%
49 Installation, Maintenance, & Repair 8.5% 5.5% 4.2% 3.6% 3.8%
51 Production 7.4% 3.6% 3.6% 3.1% 6.1%
35 Food Preparation & Serving Related 5.1% 7.8% 6.5% 10.2% 8.4%
11 Management 4.5% 5.0% 4.9% 5.0% 5.5%
13 Business & Financial Operations 2.8% 7.5% 3.5% 4.9% 5.0%
17 Architecture & Engineering 2.4% 6.1% 2.2% 2.3% 1.7%
33 Protective Service 2.3% 4.0% 3.0% 2.2% 2.3%
39 Personal Care & Service 2.2% 3.6% 3.0% 4.5% 4.0%
37 Building/Grounds Cleaning & Maint. 1.9% 3.0% 3.1% 3.7% 3.9%
19 Life, Physical, & Social Science 1.3% 2.0% 0.9% 1.1% 0.8%
29 Healthcare Practitioners & Technical 1.2% 4.8% 3.9% 6.6% 5.4%
15 Computer & Mathematical 0.4% 3.7% 1.4% 2.5% 2.7%
21 Community & Social Service 0.4% 2.1% 1.9% 2.4% 1.6%
23 Legal 0.4% 0.4% 0.4% 0.6% 0.8%
25 Education, Training, & Library 0.4% 6.0% 6.2% 5.6% 5.8%
27 Arts, Design, Entertainment, & Media 0.4% 1.5% 1.1% 1.3% 1.8%
31 Healthcare Support 0.4% 1.8% 2.0% 3.0% 2.8%
45 Farming, Fishing, & Forestry 0.4% 0.5% 15.4% 0.2% 0.8%
Source: EMSI 2016.2 – QCEW Employees, Non-QCEW Employees, and Self-Employed
Note: Figures exclude military and unclassified employment. The three largest occupations in each geography are highlighted.
ECONOMIC DEVELOPMENT STRATEGIC PLAN PAGE | 28You can also read