Driving the Future of Health Care Real Estate - Fixed Income Update May 2021 - Welltower

Page created by Dean Simpson
 
CONTINUE READING
Driving the Future of Health Care Real Estate - Fixed Income Update May 2021 - Welltower
Driving the Future of
Health Care Real Estate
    Fixed Income Update

         May 2021
Driving the Future of Health Care Real Estate - Fixed Income Update May 2021 - Welltower
Forward Looking Statements

This document contains “forward-looking statements” as defined in the Private Securities Litigation Reform Act of 1995. When Welltower uses words such as “may,” “will,”
“intend,” “should,” “believe,” “expect,” “anticipate,” “project,” “pro forma,” “estimate” or similar expressions that do not relate solely to historical matters, Welltower is making
forward-looking statements. Forward-looking statements are not guarantees of future performance and involve risks and uncertainties that may cause Welltower’s actual
results to differ materially from Welltower’s expectations discussed in the forward-looking statements. This may be a result of various factors, including, but not limited to:
the duration and scope of the COVID-19 pandemic; the impact of the COVID-19 pandemic on occupancy rates and on the operations of Welltower and its
operators/tenants; actions governments take in response to the COVID-19 pandemic, including the introduction of public health measures and other regulations affecting
Welltower’s properties and the operations of Welltower and its operators/tenants; the receipt of relief funds under the CARES Act and other future stimulus legislation, the
effects of health and safety measures adopted by Welltower and its operators/tenants related to the COVID-19 pandemic; increased operational costs as a result of health
and safety measures related to COVID-19; the impact of the COVID-19 pandemic on the business and financial condition of operators/tenants and their ability to make
payments to Welltower; disruptions to Welltower's property acquisition and disposition activity due to economic uncertainty caused by COVID-19; general economic
uncertainty in key markets as a result of the COVID-19 pandemic and a worsening of global economic conditions or low levels of economic growth; the status of capital
markets, including availability and cost of capital; issues facing the health care industry, including compliance with, and changes to, regulations and payment policies,
responding to government investigations and punitive settlements and operators’/tenants’ difficulty in cost effectively obtaining and maintaining adequate liability and other
insurance; changes in financing terms; competition within the health care and seniors housing industries; negative developments in the operating results or financial
condition of operators/tenants, including, but not limited to, their ability to pay rent and repay loans; Welltower’s ability to transition or sell properties with profitable results;
the failure to make new investments or acquisitions as and when anticipated; natural disasters and other acts of God affecting Welltower’s properties; Welltower’s ability to
re-lease space at similar rates as vacancies occur; Welltower’s ability to timely reinvest sale proceeds at similar rates to assets sold; operator/tenant or joint venture
partner bankruptcies or insolvencies; the cooperation of joint venture partners; government regulations affecting Medicare and Medicaid reimbursement rates and
operational requirements; liability or contract claims by or against operators/tenants; unanticipated difficulties and/or expenditures relating to future investments or
acquisitions; environmental laws affecting Welltower’s properties; changes in rules or practices governing Welltower’s financial reporting; the movement of U.S. and
foreign currency exchange rates; Welltower’s ability to maintain Welltower’s qualification as a REIT; key management personnel recruitment and retention; and other risks
described in Welltower’s reports filed from time to time with the SEC. Finally, Welltower undertakes no obligation to update or revise publicly any forward-looking
statements, whether because of new information, future events or otherwise, or to update the reasons why actual results could differ from those projected in any forward-
looking statements.

                                                                                                                                                                                  2
Driving the Future of Health Care Real Estate - Fixed Income Update May 2021 - Welltower
Recent Developments
     Seniors Housing Operating (SHO) Portfolio Update(1)

      •    SHO portfolio spot occupancy has increased in recent weeks, with an approximate gain of 60 basis points (“bps”) since a pandemic-low on March 12th
               •       US and UK SHO portfolios reported occupancy gains of approximately 90bps and 120bps, respectively, since March 12 th. Following a nationwide rise in COVID-19 cases, occupancy in Canada has declined by
                       approximately 50bps over the same period
               •       Month-to-date through April 23rd, occupancy continued to strengthen in the US and UK, with gains of approximately 40bps and 90bps, respectively. Total SHO portfolio occupancy has increased
                       approximately 20bps as COVID-driven weakness in Canada resulted in an occupancy decline in the country of approximately 20bps over the same time period
               •       Many communities have returned to pre-COVID conditions in terms of lead generation and resumption of in-person tours, indoor visitation, communal dining, and social activities
      •    Trailing two week resident cases have declined by 98% from mid-January through April 23, 2021; 99% of communities are currently accepting new residents

      Investment Update

      •    Year-to-date, completed $1.3B of pro rata gross investments, exclusive of development funding, through April 27, 2021
      •    During 1Q21, WELL completed $247M of pro rata gross investments excluding development at an initial yield of 6.4%; pro rata dispositions totaled $216M at a yield of 5.5%
      •    Subsequent to quarter-end, WELL completed approximately $1.1B of pro rata gross investments at an initial yield of 8.4%
                   •    Senior loan advancement of £540M ($750M) to HC-One Group completed in April 2021 as part of its recapitalization with additional £30M delayed facility available to fund capital expenditures and working capital
                              •   Welltower’s last pound basis is approximately £40,000 per unit, representing a substantial discount to replacement cost
      •    WELL’s near-term capital deployment pipeline remains robust across a wide range of opportunities; through the first and second quarter, we sold 3.7 million shares of common stock under our ATM program via
           forward sale agreements at an initial weighted average price of $73.43 per share, generating future expected gross proceeds of approximately $272 million

     2Q21 Guidance
       •   Second quarter 2021 net income attributable to common stockholders: $0.31 to $0.36 per diluted share
       •   Second quarter 2021 normalized FFO: $0.72 - $0.77 per diluted share(3). Key assumptions include:
                   •     Provider Relief Funds: Our second quarter guidance does not include the recognition of any Provider Relief Funds which may be received during the quarter
                   •     SHO Portfolio Occupancy: Midpoint of FFO guidance assumes a continuation of recent trends, resulting in an approximate increase of 130bps through the second quarter
                   •     Development: We expect funding approximately $320M of development in 2021 relating to projects underway on March 31, 2021
                   •     Investments: Guidance includes only acquisitions closed or announced year-to-date
                   •     Dispositions: We expect $681M in incremental proceeds in 2021 related to properties classified as held-for-sale as of March 31, 2021
       •   General and Administrative Expense: We expect G&A expense of approximately $135M to $140M for full year 2021

1.
2.
       Occupancy metrics have been revised for all periods presented to be reported at Welltower pro rata share as opposed to 100% ownership.
       As of April 23, 2021, most recent update from operators
                                                                                                                                                                                                                                      3
3.     See Supplemental Financial Measures at the end of this presentation for reconciliations and earnings release dated April 28, 2021 for additional information
Driving the Future of Health Care Real Estate - Fixed Income Update May 2021 - Welltower
Welltower at a Glance

                        World’s Largest Health and Wellness Real Estate Platform

 ~1,300                      ~22M      sq. ft.

 Senior Living
Communities(1)
                             ofOutpatient
                              Facilities(1)
                                                                     S&P    500
                                                                     Baa1 BBB+

                                                                                   4
 1.   As of 3/31/2021
Driving the Future of Health Care Real Estate - Fixed Income Update May 2021 - Welltower
Welltower Purpose

         Addressing societal challenges through
   reimagining and reinventing the built environment
     for effective health and wellness care delivery

                                                       5
Driving the Future of Health Care Real Estate - Fixed Income Update May 2021 - Welltower
Secular Theme | An Aging Population
                                                                                                             80+ U.S. Population Growth(1)

                                                                                                       25                                                                           7%
                                                                                                                            Population 80+ (M)

                                                                                                       23                   YoY Growth (%)
                                                                                                                                                                                    6%

                                                                                                       21
                                                                                                                                                                            19.7M   5%
       The Aging Population is
                                                                                                       19
      growing exponentially,                                                                                                                                                        4%

     and outspends every other                                                                         17
                                                                                                                                                                    15.6M

      age cohort combined on                                                                           15                                                   13.2M
                                                                                                                                                                                    3%

            health care                                                                                                                                                             2%
                                                                                                       13

                                                                                                                                                                                    1%
                                                                                                       11

                                                                                                        9                                                                           0%

1.   United States Census Bureau: Projected Population by Single Year of Age, Sex, Race, Hispanic Origin and Nativity for the United States: 2018 to 2060                                6
Driving the Future of Health Care Real Estate - Fixed Income Update May 2021 - Welltower
Secular Theme | The Need for Value-Based Care
      The US spends the most per capita on health care, yet achieves significantly lower health outcomes

       Health Care vs Social Care Spend(1)                                                                                                           Health Care Spend vs. Life Expectancy(2)
                             Social Care Spend                 Health Care Spend
                                                                                                                                                     84
100%
                                                                                                                                                                                 NOR
                                                                                                                                                                                       NLD

                                                                                                                                                                                                FRA
                                                                                                                                                     82                    AUS
                                                                                                                                                                                 NZL
80%

                                                                                                                  Life Expectancy at Birth (years)
                                                                                                                                                                                              SWE
                                                                                                                                                                                        CAN

                                                                                                                                                                OECD Avg         UK
                                                                                                                                                     80                                 GER
60%

                                                                                                                                                                                                              USA

40%                                                                                                                                                  78

20%                                                                                                                                                  76

 0%                                                                                                                                                  74
          UK       SWIZ      NOR        SWE       FRA       GER       NETH       AUS        NZ         CAN   US                                           4%   6%      8%        10%          12%       14%         16%   18%
                                                                                                                                                                            Health Care Spend (% GDP)
   1. OECD (2020), Health spending (indicator). doi: 10.1787/8643de7e-en (Accessed February 2, 2020)
   2. Organization for Economic Cooperation and Development. Data as of 2017                                                                                                                                                7
Driving the Future of Health Care Real Estate - Fixed Income Update May 2021 - Welltower
Secular Theme | Social Determinants of Health
                            80% of an individual’s health and wellness is influenced by social determinants(1)

                                                                                                              Physical Environment
                                                                                                                                                                     Safety
                                                                                                                               Housing          Transportation    & Accessibility
                                                          10%
                                                                                              40%
                                                                                                                     Socioeconomic factors
     Health Care                              20%
                                                               Drivers of                                                   Food Security         Financial        Community
                                                                Health                                                       & Nutrition           Stability      & Socialization

                                                                          30%                                 Health Behaviors
                                                                                                                       Exercise & Activity         Hygiene       Medical Compliance

                                                                                                                                                                                      8
1. Source: Artiga, S., & Hinton, E. (2019, May 29). Beyond Health Care: The Role of Social Determinants in Promoting Health and Health Equity
Driving the Future of Health Care Real Estate - Fixed Income Update May 2021 - Welltower
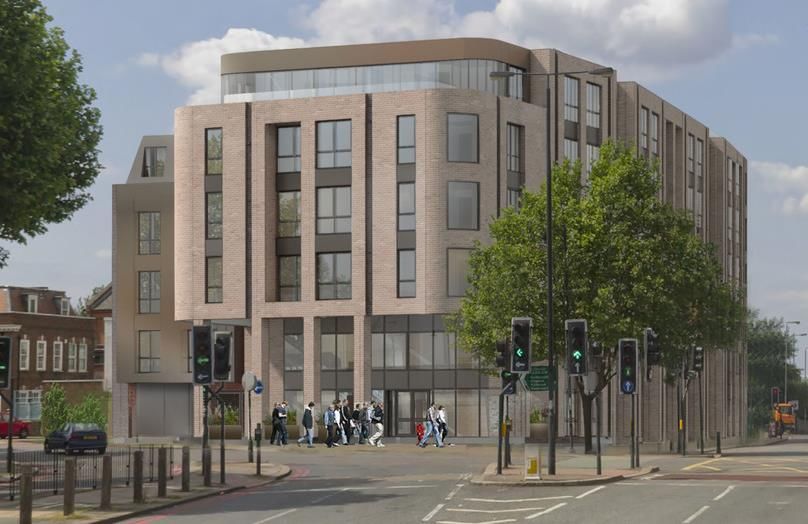
Portfolio Composition(1)

                                         7%                                                                                                                         9%

                      17%
                                                                                                                                                                                    39%
                                                                                                                                                         24%
                                       1Q 2019                              48%                                                                                     1Q 2021
                                        IPNOI                                                                                                                       IPNOI(2)
                  10%

                                                                                                                                                               6%
                                  18%
                                                                                                                                                                         22%

             Seniors Housing Operating                              Seniors Housing Triple-Net                             Long-Term / Post-Acute Care     Outpatient Medical   Health System

1.   Based on In-Place NOI. See Supplemental Financial Measures at the end of this presentation for reconciliations
2.   1Q2021 IPNOI is adjusted to reflect the 9 PowerBacks contributed to the ProMedica joint venture on 4/1/2021 from LT/PAC to Health System                                                   9
Driving the Future of Health Care Real Estate - Fixed Income Update May 2021 - Welltower
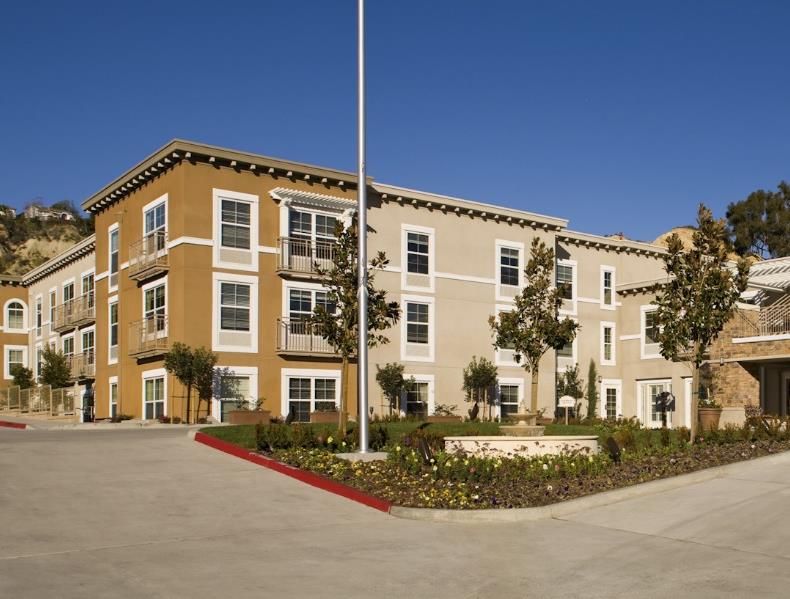
Seniors Housing Operating & Triple-Net Portfolio Update
                                                          10
Spectrum of Seniors Housing
 Seniors housing has many forms across acuity and cost spectrums from addressing the needs of the active senior who is looking for a
                      home that is purpose-built and affordable to higher acuity in high barrier to entry markets
                                           $                               Relative Cost of                           $$$
                                                                                 Care

                                         Senior          Independent          Assisted           Memory           Post-Acute
                               Home
                                       Apartments           Living             Living             Care               Care
Activities /
Programming                                 ✓                 ✓                  ✓                 ✓                  ✓
Transport / Laundry                                           ✓                  ✓                 ✓                  ✓
                                        On-demand
Meals
                                        services via          ✓                  ✓                 ✓                  ✓
Care Services
(Activities of daily living)
                                         strategic
                                                                                 ✓                 ✓                  ✓
                                       partnerships
Post-Acute and
Chronic Care                                                                                                          ✓

Select Welltower
Operators
                                                                                                                                 11
Seniors Housing Operator Platform | Power of Diversification
   Diversity Across Acuity, Geography and Operating Model
Operator Diversification | Average Monthly Rent vs Average Portfolio Acuity

$$$
Monthly Rent

 $

               Low                                   Average Portfolio Acuity   High

                                                                                       12
Seniors Housing Supply Backdrop
                                          Seniors Housing Historical Supply(1)                                                                             Rapid Increase in Cost of Key Materials May Curtail Near-Term Starts(2)
                                              NIC Primary and Secondary Markets
                                                                                                                                                                                 2019 – 2020 Price Change                   YTD 2021 Price Change
14K                                  Construction Starts                Rolling 4-Quarter Starts vs. Inventory                              5.0%
                                                                                                                                                         Lumber                               +115.4%                             +238.6%
                                                                                                                                            4.5%
12K
                                                                                                                                                         Steel                                 +70.9%                             +131.8%

                             71% decline in                                                                                                 4.0%         Copper                                +25.8%                              +55.4%

10K
                            starts from peak
                                                                                                                                            3.5%
                                                                                                                                                                                                    Lumber Prices(2)
                                                                                                                                                         1500
                                                                                                                                            3.0%
 8K

                                                                                                                                            2.5%         1200
                                                                                                                                                                                       Lumber prices have increased
                                                                                                                                                                                          approximately 5x in last
 6K                                                                                                                                                                              five years and risen 322% since April 2020
                                                                                                                                            2.0%
                                                                                                                                                           900

                                                                                                                                            1.5%
 4K
                                                                                                                                                           600

                                                                                                                                            1.0%

 2K                                                                                                                                                        300
                                                                                                                                            0.5%

                                                                                                                                                              0
 0K                                                                                                                                         0.0%

1.
2.
      Source: NIC MAP
      Bloomberg. Lumber: Random Length Lumber Futures; Steel: U.S. Midwest Domestic Hot-Rolled Coil Steel Index Futures; Copper: Copper Futures. 2019 – 2020 Price Change: 12/312019 – 12/31/2020; YTD 2021 Price Change:
                                                                                                                                                                                                                                              13
      12/31/20 – 4/23/2021
COVID Recovery | Growth Opportunity
     20M                                      US 80+ Population Growth(1)                                        7.0%

                                                                                   3.6% CAGR                     6.0%
                                                                                                                           Demographic-driven
                                                                                                                 5.0%      Occupancy Recovery
     15M
                                             1.3% CAGR                                                           4.0%

                                                                                                                 3.0%

                                                                                                                 2.0%
     10M
                                                                                                                 1.0%

                                                                                  80+ Population                 0.0%

      5M
                                                                                  80+ Population Growth (%YoY)
                                                                                                                 -1.0%
                                                                                                                           Supply Deceleration

                  Seniors Housing Construction vs. Inventory – Rolling Four Quarters(2)

     5.0%
                 Starts as percentage of inventory
     4.0%            at lowest level since 2Q11

     3.0%

     2.0%                                                                                                                Unique Opportunity for
     1.0%                                                                                                                Significant NOI Growth
     0.0%

1.     Source: The Organisation for Economic Cooperation and Development (OECD)
                                                                                                                                                  14
2.     Source: NIC MAP, Primary and Secondary Markets
COVID-19 | Case Count & Vaccination Update
                        US COVID New Daily Cases(1)                                             UK COVID New Daily Cases(2)                               Canada COVID New Daily Cases(3)
                            7-Day Moving Average                                                   7-Day Moving Average                                        7-Day Moving Average
     300K                                                                         70K                                                          10K
     250K                                                                         60K
                                                                                                                                                8K
                                                                                  50K
     200K
                                                                                  40K                                                           6K
     150K
                                                                                  30K
                                                                                                                                                4K
     100K
                                                                                  20K
      50K                                                                         10K                                                           2K

        0K                                                                          K                                                            K

                  Cumulative US COVID Vaccinations                                         Cumulative US COVID Vaccinations                          Fully Vaccinated Individuals in US Assisted
                          Total US Population                                           US Assisted Living and Skilled Nursing Facilities              Living and Skilled Nursing Facilities(1)
     250M                                                                        9M
                                                                                 8M
     200M                                                                        7M                                                             Residents                          1,467K
                                                                                 6M
     150M
                                                                                 5M
                                                                                 4M                                                                   Staff               1,040K
     100M
                                                                                 3M
     50M                                                                         2M
                                                                                 1M                                                          Not Reported     362K
        M                                                                         M
        Dec-14            Jan-14            Feb-14          Mar-14      Apr-14    Dec-14       Jan-14       Feb-14     Mar-14       Apr-14

1.    Centers for Disease Control and Prevention as of April 24, 2021
2.    https://coronavirus.data.gov.uk/                                                                                                                                                             15
3.    https://health-infobase.canada.ca/covid-19/covidtrends/
Vaccine and Therapeutics Timeline
                                                                     Vaccine availability for all adult Americans anticipated by May 1 2021(1)

           New Daily Cases 7-Day Moving Avg                              Cumulative Vaccinations

                                                                                                                                                                 US daily COVID deaths
                      EUA granted for Pfizer and Moderna vaccine and                                                                                                peak at 4,396(3)
                        distribution begins in the UK, US, and Canada;                                                                                                                                                                                      FDA and CDC lift 10-day pause on
250K               AstraZeneca granted EUA in the UK in late December (2)                                                                                                                                                                                     J&J vaccine use following an           250M
                                                                                                                                                                                            US Federal Retail Pharmacy Program
                                                                                                                                                                                                                                                               extensive safety review(7)
                                                                                                                                                                                            for COVID-19 vaccination begins with
                                                                                                                                                                                                 21 retail pharmacy partners(4)

200K                                                                                                                                                                                                                                                                                                 200M
                                                                                                                                                                                                                              EUA granted for J&J
                                                                                                                                                                                                                              single dose vaccine                          ~68% of U.S. population
                                                                                                                                                                                                                              for US distribution(5)                       65+ fully vaccinated(3)
150K                                                                                                                                                                                                                                                                                                 150M

                                                                                                                                                                                                                                                               Pfizer/BioNTech COVID-
                                                                                                                                                                                                                                                               19 shot 91% effective in
100K                                                                                                                                                                                                                                                                updated data(6)                  100M

 50K                                                                              US Daily New Cases down 80% since January ’21 peak                                                                                                                                                                 50M

     0K                                                                                                                                                                                                                                                                                              0M

1.    https://www.whitehouse.gov/briefing-room/speeches-remarks/2021/03/02/remarks-by-president-biden-on-the-administrations-covid-19-vaccination-efforts/
2.    https://www.astrazeneca.com/media-centre/press-releases/2020/astrazenecas-covid-19-vaccine-authorised-in-uk.html
3.    https://covid.cdc.gov/covid-data-tracker/#vaccinations
4.
5.
      https://www.cdc.gov/vaccines/covid-19/retail-pharmacy-program/index.html
      https://www.jnj.com/johnson-johnson-covid-19-vaccine-authorized-by-u-s-fda-for-emergency-usefirst-single-shot-vaccine-in-fight-against-global-pandemic/
                                                                                                                                                                                                                                                                                                     16
6.    https://www.reuters.com/article/health-coronavirus-pfizer/pfizer-biontech-covid-19-shot-91-effective-in-updated-data-protective-against-south-african-variant-idUKKBN2BO68Fhttps://www.cdc.gov/vaccines/covid-19/retail-pharmacy-program/index.html
7.    https://www.fda.gov/news-events/press-announcements/fda-and-cdc-lift-recommended-pause-johnson-johnson-janssen-covid-19-vaccine-use-following-thorough
SHO Portfolio | 1Q2021 Observations
Revenues
 •         SHO portfolio average occupancy declined approximately 310bps vs. 4Q2020 relative to initial guidance of down 275bps to 375bps
               •      Average sequential occupancy decline impacted by significant occupancy losses experienced in late 4Q2020
 •          1Q2021 Same store REVPOR(1) (1Q2021 vs. 1Q2020):
               •      Assisted Living properties increased 1.6%
               •      Independent Living properties increased 0.7%
               •      Senior Apartment properties increased 6.3%
 •         Move in activity increased 8% sequentially in 1Q2021 as compared to 4Q2020; declined 16% on a year-over-year basis
 •         Move out activity increased 6% sequentially in 1Q2021 as compared to 4Q2020; declined 8% on a year-over-year basis

Expenses
     •      Total same store pro rata expenses decreased slightly in 1Q2021 from 4Q2020 following a diminution in COVID related expenses in late-
            February and March. The sequential quarter occupancy decline experienced in 1Q2021 also resulted in a decline in certain controllable
            expenses(2)
     •      Same store SHO portfolio incurred approximately $15 million in pro rata COVID-related property level expenses, net of reimbursements in
            1Q2021(3)
     •      COVID-related expenses are expected to moderate in 2Q2021 as compared to 1Q2021 as COVID cases continue to decline

1.       Represents SHO same store portfolio. See Supplemental Financial Measures at the end of this presentation for reconciliations
2.       Refer to 1Q21 Supplemental Information published on April 28th, 2021
3.       Reimbursements received during the first quarter of $33.7 million related to the HHS Provider Relief Fund and similar reimbursements in the UK and Canada related to out of period expenses and have been excluded from same store NOI   17
(1)
           SHO Portfolio | COVID-19 Impact
Resident COVID-19 Cases – Trailing Two Weeks
                                                                                                                                                                                                                  COVID-19 Impact
                                                                                                                                          98% decline in TTW cases since peak
                                                                                                                                                                                                                  • 99% of communities are accepting new residents,
 1,400
                                                                                                                                                                                                                    up from 84% as of mid-January 2021
                                  •   Most AL/MC communities have completed
                                      their final scheduled vaccine clinic                                                                                                                                        • 98% decline in trailing two week (TTW) case count
                                  •   Lead generation for many communities
                                                                                                                                                        1227                                                        since peak in mid-January 2021
 1,200
                                      has returned to pre-COVID levels                                                                                1136
                                                                                                                                                                                                                  • 97% of communities have zero reported resident
                                                                                                                                                                                                                    COVID-19 cases on a TTW basis versus 64% in
 1,000                                                                                                                                                                                                              mid-January 2021
                                                                                                                                                             906
                                                                                                                                                  874
                                                                                                                                                               819

     800
                                                                                                                                                780                                                               Operations Update

                                                                                                                                            620                                                                   • Visitation restrictions have been eased at many
     600                                                                                                                                  562
                                                                                                                                                                   578
                                                                                                                                                                                                                    communities while maintaining strict adherence to
                                                                                                                                       521
                                     485                                                                                            481                                                                             state, local, and/or operator-imposed guidelines
                                  454
                                        427
                                                                                                                                                                                                                  • Many communities have begun to open dining rooms
     400                                  348
                              335
                                                                                                                                  304                                300
                                                                                                                                                                                                                    with limited capacity and resumed social programming
                            291
                                                                                                                               268
                        237                   246
                                                                                                                            228
                                                                                                                                                                         197
                                                                                                                                                                                                                  • In-person tours are being offered on a more consistent
     200
                      127
                                                165
                                                                       142147 146
                                                                                 164
                                                                                                                   125127 117
                                                                                                                                                                            163
                                                                                                                                                                               131
                                                                                                                                                                                                                    basis; virtual tours remain available
                                                                             119    112
                                                                  89                                   92 101 91         100

                 38
                                                      78 69 82
                                                               63                         71
                                                                                               46 46
                                                                                                                                                                                     81
                                                                                                                                                                                          35              33 25
                                                                                                                                                                                                                  • Previous requirement to self-quarantine post move-in
                                                                                                                                                                                               17 12 17
           0 9
       0
                                                                                                                                                                                                                    has been shortened or removed at some properties if
                                                                                                                                                                                                                    new resident is fully vaccinated and tested negative for
                                                                                                                                                                                                                    COVID-19

                                                                                                                                                                                                                                                                         18
1.    All data presented as of April 23, 2021 as reported by operators; has not been verified by Welltower
(1)
SHO Portfolio | Additional Community Details
Normalization in US and UK is offset by enhanced restrictions in Canada due to a nationwide increase in COVID cases

                                                  Visitation                                                       Communal Dining
       100%                                                                                       100%

        80%
                                                                                                  80%

        60%
                                                                                                  60%

        40%
                     Dec-20             Jan-21             Feb-21            Mar-21      Apr-21
                                                                                                  40%
                                      Indoor Visitation             Outdoor Visitation                   Dec-20   Jan-21         Feb-21    Mar-21    Apr-21

                                                  In-Person Tours                                                           Activities
       100%                                                                                        80%

        90%
                                                                                                   70%
        80%

        70%                                                                                        60%

        60%
                                                                                                   50%
        50%

        40%                                                                                        40%
                     Dec-20             Jan-21             Feb-21            Mar-21      Apr-21          Dec-20    Jan-21         Feb-21    Mar-21     Apr-21

1. All data as reported by operators; has not been verified by Welltower                                                                                        19
(1)
           SHO Portfolio | Move Ins & Move Outs

                                   Indexed Move Ins Since February 2020                                                                                             Indexed Move Outs Since February 2020
     120                                                                                                        81% Increase                120
                                                                                                                 Jan‘21→ Mar‘21                                                                                                      12% decrease
                                                                                                                                                                                                                                      Jan‘21→ Mar‘21

                                                                                                                                                          107.1
     100                                                                                                                         103.1      100                                                                                     103.4
            100.0                                                                                                                                 100.0           100.9
                                                                                                                                                                                                                             97.7
                                                                                                                                                                                                                                            92.9   91.1
                                                                                                                                                                          89.1                                        89.3
      80                                                                    84.8                                                             80                                           85.8          86.8   85.2
                                                                                     83.3                                                                                                        83.4
                      76.3                                                                                                                                                         77.3
                                                                   74.3                                                 74.6
                                                          68.1                               66.5     67.3
      60                                                                                                                                     60
                                                 58.4                                                          56.8

      40                                                                                                                                     40

                                        34.7

      20                       23.1                                                                                                          20

       0                                                                                                                                      0

1.    Move Ins and Move outs have been revised for all periods presented to be reported at Welltower pro rata share as opposed to at 100%                                                                                                           20
(1)
        SHO Portfolio | Move Ins & Move Outs

                               Move Ins as % 2019 Move Ins                                                                                                  Move Outs as % 2019 Move Outs
 120%                                                                                                                                       120%

                                                                                                                                                   103%
                                                                                                                                                                                                            101%
 100%                                                                                                                                       100%                                                      97%
                                                                                                                                                          90%                                                      89%
                                                                                                                          86%                                                       84%         86%
                                                                                                                                                                79%   79%     79%                                        81%
     80%                                                                                                                                    80%                                           74%
                                                               70%
                                                                        65%                                     67%
                                                     59%                          60%
     60%                                   56%                                              57%                                             60%
                                                                                                      54%

                                 44%

     40%                                                                                                                                    40%

                       21%
     20%     17%                                                                                                                            20%

     0%                                                                                                                                      0%

1.    Move Ins and Move outs have been revised for all periods presented to be reported at Welltower pro rata share as opposed to at 100%                                                                                      21
SHO Portfolio | Occupancy Trends
     Total SHO Month-End Pro Rata Occupancy(1,2)

            88%
                          -10 bps           -30 bps
            86%                                               -80 bps
                                                                             -240 bps

            84%
                                                                                             -180 bps
            82%
                                                                                                              -90 bps
                                                                                                                               -60 bps
            80%                                                                                                                                -50 bps
                                                                                                                                                               -30 bps         -40 bps
                                                                                                                                                                                                 -70 bps
            78%                                                                                                                                                                                                 -110 bps

                                                                                                                                                                                                                                 -150 bps
            76%
                                                                                                                                                                                                                                            -80 bps
                                                                                                                                                                                                                                                      0 bps(2)
            74%

            72%
                         January        February           March             April           May             June             July           August        September October                November December                  January     February   March

                                                                                                                 2020                                                                                                                       2021

1.    Occupancy represents approximate month end pro rata occupancy for all SHO properties in operation as of February 29, 2020, excluding only acquisitions, executed dispositions and development conversions since this date.
      Approximate month end spot occupancy is as follows: 2020: January – 85.7%; February – 85.4%; March – 84.7%; April – 82.2%; May – 80.4%; June – 79.5%; July – 78.9%; August – 78.4%; September – 78.1%; October – 77.7%;
      November – 76.9%; December – 75.9%; 2021: January – 74.4%; February – 73.6%; March – 73.6%.                                                                                                                                                                22
2.    Units and occupancy metrics have been revised for all periods presented to be reported at Welltower pro rata share as opposed to at 100%. The change in methodology resulted in minor revisions (typically 0-10bps) to month-over-
      month occupancy changes. Under previous methodology, spot occupancy declined -140bps, -90bps, and -10bps in January 2021, February 2021, and March 2021, respectively.
SHO Portfolio | Path to Recovery
               Embedded NOI growth of approximately $480 million through potential return to Pre-COVID levels

               Category                                                               NOI ($m)                                                                      $999M
                                                                                                                                                   $95M   $22M
                                                                           (1)
               1Q21 Annualized In-Place NOI ("IPNOI")                                       648

          A)   1Q21 Provider Relief Funds ("HHS")                                          (128)                                           $362M

          B)   1Q21 Portfolio - Core 1Q21 IPNOI (ex HHS)                                    520

          C)   Stable Portfolio Occupancy Recovery                                          362

          D)   Development and Fill-Up Stabilization                                          95
                                                                                                           $648M           $128M
          E)   Transitions                                                                    17

          F)   Acquisitions                                                                    5
                                                                                                                                   $520M
          G) 1Q21 Portfolio – Post-COVID Recovery NOI                                       999

A) Annualized one-time impact of Provider Relief Funds recognized in 1Q21

B) 1Q21 IPNOI Portfolio excluding Provider Relief Funds

C) 4Q19 Stable Portfolio - Incremental NOI from return to 4Q19 NOI levels

   Lease-up portfolio as of 4Q19 , development properties delivered subsequent to 4Q19 and acquired   1Q21 Ann. In-Place                                         1Q21 Portfolio
D)                                                                                                                          A       B       C       D     E+F
   properties in lease-up. Incremental NOI driven by lease-up to underwritten stabilization             NOI (“IPNOI”)                                             Post-COVID
   SHNNN to SHO Transitions - Properties transitioned to SHO from SHNNN subsequent to 4Q19.                                                                      Recovery NOI
E)
   NOI stabilization assumes return to 4Q19 NOI
                                                                                                         Occupancy                                                 Occupancy
   SHO Properties Acquired Subsequent to 4Q19 - Incremental NOI from recently acquired properties
F)                                                                                                         72.8%                                                     87.3%
   returning to pre-COVID NOI
   1Q21 Post-COVID Recovery NOI - Represents portfolio occupancy of 87.3% and operating margin of
G)
   30.0%
                                                                                                                                                                       23
     1.    See Supplemental Financial Measures at the end of this presentation.
Liquidity and Balance Sheet Update
                                     24
Balance Sheet & Investment Highlights
     Notable 2021 Year To Date Highlights                                                                                                                       Liquidity ($M)                                                                      April 27, 2021

                                                                                                                                                               Cash and Cash Equivalents(1)                                                                $1,000
     • Near-term liquidity of $4.0 billion as of April 27, 2021
                                                                                          (1)                                                                  Undrawn Line of Credit Capacity                                                             $3,000
          • Cash balance totals approximately $1.0 billion ; revolving credit facility is
            undrawn with capacity of $3.0 billion                                                                                                            Near-Term Liquidity                                                                           $4,000
     • Subsequent to quarter end, redeemed $339 million in 3.750% senior notes due March                                                                       Expected Proceeds from Assets Held For Sale(2)                                                $681
       2023 and $335 million in 3.950% senior notes due September 2023
                                                                                                                                                               Expected Proceeds from 2021 Loan Payoffs                                                      $175
     • As of April 27, 2021, completed approximately $1.3 billion of gross pro rata
       investments excluding development funding year-to-date, of which $1.1 billion was
                                                                                                                                                             Near-Term Liquidity + Expected Proceeds                                                       $4,856
       completed subsequent to quarter end, including:

              • Senior loan advancement of £540 million ($750 million) in April 2021 to
                HC-One Group maturing 2026                                                                                                                                 Weighted Average Debt Maturity of 7.3 Years(3)
     • As of April 27, 2021, received approximately $491 million in pro rata disposition
       proceeds.

                         • Including $58 million relating to the contribution of 9 PowerBacks to the
                           80/20 ProMedica joint venture at a valuation of $292 million
                                                                                                                                                                                             Baa1                                  BBB+
     • Near-term capital deployment pipeline remains robust across a wide range of
       opportunities

1.     Estimated cash balance of $1.0 billon as of April 27, 2021, including cash and cash equivalents and IRC Section 1031 deposits
2.     Includes 1Q2021 assets held for sale of $688 million as of March 31, 2021 less $7 million related to dispositions closed subsequent to quarter end as of April 27, 2021                                                                                25
3.     Represents March 31, 2021 data with pro forma adjustments to reflect the April 15, 2021 redemption of $339 million in aggregate amount outstanding of 3.750% senior notes due March 2023 and all $335 million aggregate amount outstanding
       of 3.950% senior notes due September 2023 and a portion of the two-year unsecured term loan due 2022 as if all transactions had occurred on March 31, 2021
Diverse and Unparalleled Access to Capital

                                                                                                                                                                                    Credit Facility
             Capital Raised Since 2018
        STRATEGIC DISPOSITIONS & EQUITY                                                                                                                                                 $3.7B
        (COMMON and PREFERRED)

        ~55%                                                                                                                                                            $3.0B revolver + $700M
                                                                                                                                                                             in term loans

                                                                                                                                                                                  Public Debt(2)

                                                                                                                                                                                                        Weighted Avg.                 Weighted Avg.
                                                                                                                                                                       Total Debt
                                        $20B                                                                                                                                                              Interest                      Maturity

                                          RAISED(1)
                                                                                          DEBT
                                                                                                                                      USD                             $8.4B(3)                               3.89%                    8.7 years
                                                                                          ~45%
                                                                                                                                      GBP                              £1.05B                                4.66%                    10.5 years

                                                                                                                                      CAD                            C$300M                                  2.95%                    5.8 years

1.   Gross proceeds
2.   Excludes Term Loans
3.   Represents March 31, 2021 data with pro forma adjustments to reflect the April 15, 2021 redemption of $339 million in aggregate amount outstanding of 3.750% senior notes due March 2023 and all $335 million aggregate amount
     outstanding of 3.950% senior notes due September 2023 as if all transactions had occurred on March 31, 2021.                                                                                                                                     26
Leading Asset Liquidity
                                                                                                                                    (1)
                                                                                        $70M Pro Rata TTM NOI
                                                                                        Generated from top 15 unencumbered assets

                                                                                                                5.0% cap rate

Belmont Village Ranchos Palos Verdes            Belmont Village of Cardiff by the Sea            $1.4B
                                                                                                  Asset value

                                                                                                                  65% LTV

                                                                                                $914M
                                                                                         Proceeds available
Sunrise of Connecticut Ave             Sunrise of Seal Beach
                                                                                                                                27
1. As of 3/31/2021
(1,2)
             Balanced and Manageable Debt Maturity Profile
                                                                                                               Weighted Average Maturity of 7.3 Years
          $3,000                                             USD Unsecured               USD Secured             CAD Unsecured               CAD Secured             GBP Unsecured               Term Loan            Weighted Average Interest

                                                                                                                                                                                                                                                                                       5.0%
          $2,500
                                                                                                                        3.8%                                                                4.5%
                                                                                                                                               4.1%
                                                                                                 3.8%                                                                                                              3.9%
          $2,000

                             3.1%                                                                                                                                                                                                                                2.8%
                                                                                                                                                                      3.0%                                                                3.1%
          $1,500
                                                                          2.4%
                                                    2.1%
          $1,000

            $500

               $0
 (in Millions USD)           2021
                             2021                  2022(3)
                                                  2022                    2023(4)
                                                                         2023                    2024
                                                                                                 2024                   2025
                                                                                                                        2025                   2026
                                                                                                                                               2026                  2027
                                                                                                                                                                     2027                   2028
                                                                                                                                                                                            2028                   2029
                                                                                                                                                                                                                   2029                   2030
                                                                                                                                                                                                                                          2030                   2031
                                                                                                                                                                                                                                                                 2031                  After
                                                                                                                                                                                                                                                                                       After
                                                              (3)                     (4)
Unsecured Debt                 $0                   $855     (3)           $699       (4)       $1,350                 $1,250                  $700                   $739                 $1,509                  $550                   $750                  $1,350                $1,840

Secured Debt                 $319                   $501                   $450                  $269                   $646                    $69                   $185                   $94                   $282                    $37                    $23                   $160

Total                        $319                 $1,356                 $1,149                 $1,619                 $1,896                  $769                  $924                  $1,603                  $832                   $787                 $1,373                 $2,000

 1.   Represents March 31, 2021 data with pro forma adjustments to reflect the April 15, 2021 redemption of $339 million in aggregate amount outstanding of 3.750% senior notes due March 2023 and all $335 million aggregate amount outstanding of 3.950% senior notes due September 2023 and a
      portion of the two-year unsecured term loan due 2022 as if all transactions had occurred on March 31, 2021. Represents pro rata principal amounts due and excluding unamortized premiums/discounts or other fair value adjustments as reflected on the balance sheet. Excludes lease liabilities
      relating to both finance and operating leases
 2.   Our unsecured commercial paper program and our unsecured revolving credit facility had a zero balance as of March 31, 2021. The unsecured revolving credit facility matures on July 19, 2022 (with an option to extend for two successive terms of six months each at our discretion).
      Available borrowing capacity of our unsecured revolving credit facility was $3,000,000,000 as of March 31, 2021
 3.   2022 includes a $845,000,000 unsecured term loan. The loan matures on April 1, 2022 and bears interest at LIBOR plus 1.20%
 4.   2023 includes a $500,000,000 unsecured term loan and a CAD $250,000,000 unsecured term loan (approximately $198,850,000 USD at March 31, 2021). The loans mature on July 19, 2023. The interest rates on the loans are
      LIBOR + 0.9% for USD and CDOR + 0.9% for CAD
                                                                                                                                                                                                                                                                                           28
(1)
     1Q 2021 Covenant Compliance

                                                                                     (2)
                       Unsecured Debt Covenant Compliance                                                                                                 Line of Credit Covenant Compliance

                                                1Q2021                Covenant              Compliance                                                                       1Q2021                 Covenant              Compliance

Secured Indebtedness to                                                                                                        Leverage Ratio                                  36.2%
Environmental, Social and Governance (ESG)
                                             30
GHG Emissions reduction
                                                            8.5%     over baseline
     Sustainability Goals Publication and Advancement

                                           10% reduction
                                         in GHG emissions                     Invested in
                                                                    $13.7M    efficiency projects

                                          10% reduction
                                           in water use
                                                                     Efficiency projects
                                                            239      implemented
                                          10% reduction
                                          in energy use
                                                                              LED retrofit projects
                                            by 2025                   84      in 2019
1.    Reduction Goals Established 2018

                                                                     Estimated energy savings
                                                            $1.8M    from 2019 LED retrofits

                                                                              LED retrofit projects
                                                                     367      completed to date31
                                                                                                    31
Inaugural Green Bond | Effective Access to Capital

                                   $500M 7-Year note at 2.7%
                             ✓    First U.S. health care REIT to issue Green Bond
                             ✓    WELL’s lowest coupon on 7-year note
                             ✓    Demand 7.0x oversubscribed
                             ✓    Over 100 investors consisting of high-quality
                                  asset managers, insurance funds, hedge funds,
                                  and central banks

                                                   Use of Proceeds:

                                 Green Buildings    Water Efficiency   Energy Efficiency

                                                                                       32
Case Study in Green Buildings | Signature at Wandsworth Common

                                    Green Building Spotlight | Signature at Wandsworth Common
Welltower Building Certifications
                                                                                   •   “Excellent” BREEAM rating
                                    Signature at Wandsworth Common is
                                                                                   •   Combined heat and power units
                                    Welltower’s latest development in the United
                                                                                   •   Photovoltaic roof panels
                                    Kingdom that is helping to meet the need for
                                                                                   •   Energy efficient technologies such as
                                    2,000 additional assisted living and
                                                                                       motion-sensor lighting
                                    dementia care beds in the local area while
                                                                                   •   Expected savings of 89 tons (35%) of
                                    adding 120+ jobs to the local economy.
                                                                                       regulated CO2 annually vs. baseline

                                                                                                                          33
Social | Solid Diversity and Inclusion Foundation
                                                                     EMPLOYEE
                                                                     NETWORK GROUPS
                                                                     CORE Women’s Network is one of the earliest
                                                                                                                                      REPEATED EXTERNAL ADVOCATION
                                                                     and most robust diversity groups amongst our                     AND RECOGNITION FOR DIVERSITY
                                                                     peers. We have created new ENGs such as:
                                                                     Af-Am, Hispanic, LGBTQIA+.

   INTERNAL
ESPOUSAL OF
  DIVERSITY
     e.g., 50% of our leadership                                                                         TRAINING
team is made up of women and                                                                             PROGRAMS
   minorities, women represent
     45% of new hires placed in
 revenue generating roles, 75%                  Welltower                                                Unconscious bias and civil
                                                                                                         and respectful treatment
             female and minority
     independent leadership on
               Board of Directors
                                             Diversity Council
                                             Expanded approach / focus on
                                                      diversity

                                                                                         RECRUITING
                                                                                         Initial expansion of recruiting to
        PA RT N E R S H I P S                                                            include historically black
                                                                                         colleges, ensuring interview
       Working with national organizations
                                                                                         slates consist of diverse
        and our partners to discuss issues
                                                                                         candidates, and review of
          and develop solutions related to
                                                                                         recruiting material for
      workforce development and diversity
                                                                                         unconscious bias

                                                                                                                                                                34
Governance | Great Governance is Good Business
                                                                                                G&A as % of Enterprise Value(1)

                                                                                             1.00%

                                      80%                                                    0.90%

                                                                                             0.80%
                   Female and Minority
             Independent Director Leadership                                                 0.70%
                on the Board of Directors(2)
                                                                                             0.60%
                                                                                                                                                                                                                                        HC REIT Avg
                                                                                             0.50%
         ISS ESG Governance Score(3,4)
                                                                                             0.40%

              Peers                                6                                         0.30%

                                                                                             0.20%
       Welltower                     3
                                                                                             0.10%

                      Low Risk                                High Risk                      0.00%
                                                                                                           LTC          MPW          SNH           DOC         SBRA            HR          HTA           OHI          VTR          PEAK    NHI   WELL

1.   Peer G&A based on company filings for full year 2020. Enterprise Value data as of 3/31/2021
2.   Data as of 3/31/2021
3.
4.
     ISS Governance Score is a weighted average of scores assigned for (a) board structure, (b) compensation, (c) shareholder rights and (d) audit as of 3/31/2021
     Ventas (VTR), Healthpeak (PEAK), Crown Castle International (CCI), Equinix (EQIX), Iron Mountain (IRM), Weyerhaeuser Company (WY), American Tower Corporation (AMT), Boston Properties (BXP), Equity Residential (EQR), Prologis
                                                                                                                                                                                                                                                        35
     (PLD), Public Storage (PSA), Simon Property Group (SPG), Vornado Realty Trust (VNO), AvalonBay Communities (AVB), Alexandria Real Estate Equities (ARE)
Supplemental Financial
Measures

                         36
Non-GAAP Financial Measures
We believe that revenues, net income and net income attributable to common stockholders ("NICS"), as defined by U.S. generally accepted accounting
principles ("U.S. GAAP"), are the most appropriate earnings measurements. However, we consider Funds From Operations (FFO), Normalized FFO, Net
Operating Income (NOI), In-Place NOI (IPNOI), REVPOR and Same Store REVPOR ("SS REVPOR") to be useful supplemental measures of our
operating performance. The supplemental measures are disclosed on our pro rata ownership basis.
Pro rata amounts are derived by reducing consolidated amounts for minority partners’ noncontrolling ownership interests and adding our minority
ownership share of unconsolidated amounts. We do not control unconsolidated investments. While we consider pro rata disclosures useful, they may not
accurately depict the legal and economic implications of our joint venture arrangements and should be used with caution.
Our supplemental reporting measures and similarly entitled financial measures are widely used by investors, equity and debt analysts and rating agencies
in the valuation, comparison, rating and investment recommendations of companies. Our management uses these financial measures to facilitate internal
and external comparisons to historical operating results and in making operating decisions. Additionally, these measures are utilized by the Board of
Directors to evaluate management.
None of the supplemental reporting measures represent net income or cash flow provided from operating activities as determined in accordance with U.S.
GAAP and should not be considered as alternative measures of profitability or liquidity. Finally, the supplemental reporting measures, as defined by us,
may not be comparable to similarly entitled items reported by other real estate investment trusts or other companies. Multi-period amounts may not equal
the sum of the individual quarterly amounts due to rounding.

                                                                                                                                                           37
FFO and Normalized FFO
Historical cost accounting for real estate assets in accordance with U.S. GAAP implicitly assumes that the value of real estate assets diminishes
predictably over time as evidenced by the provision for depreciation. However, since real estate values have historically risen or fallen with market
conditions, many industry investors and analysts have considered presentations of operating results for real estate companies that use historical cost
accounting to be insufficient. In response, the National Association of Real Estate Investment Trusts (NAREIT) created FFO as a supplemental measure of
operating performance for REITs that excludes historical cost depreciation from net income. FFO attributable to common stockholders, as defined by
NAREIT, means net income attributable to common stockholders, computed in accordance with U.S. GAAP, excluding gains (or losses) from sales of real
estate and impairments of depreciable assets, plus real estate depreciation and amortization, and after adjustments for unconsolidated entities and
noncontrolling interests. Normalized FFO attributable to common stockholders represents FFO adjusted for certain items detailed in the reconciliations.

Normalizing items include adjustments for certain non-recurring or infrequent revenues/expenses that are described in our earnings press releases for the
relevant periods.

We believe that Normalized FFO attributable to common stockholders is a useful supplemental measure of operating performance because investors and
equity analysts may use this measure to compare our operating performance between periods or to other REITs or other companies on a consistent basis
without having to account for differences caused by unanticipated and/or incalculable items.

                                                                                                                                                            38
Earnings Outlook Reconciliation
Quarter Ending June 30, 2021
(in millions, except per share data)                                                               Current Outlook
                                                                                             Low                     High
FFO Reconciliation:
Net income attributable to common stockholders                                       $                128    $              149
Impairments and losses (gains) on real estate dispositions, net (1,2)                                 (75)                   (75)
Depreciation and   amortization(1)                                                                    249                   249
NAREIT FFO and Normalized FFO attributable to common stockholders                    $                302    $              323

Diluted per share data attributable to common stockholders:
Net income                                                                           $               0.31    $              0.36
NAREIT FFO and Normalized FFO                                                        $               0.72    $              0.77

Other items:(1)
Net straight-line rent and above/below market rent amortization                      $                (20)   $               (20)
Non-cash interest expenses                                                                              4                     4
Recurring cap-ex, tenant improvements, and lease commissions                                          (24)                   (24)
Stock-based compensation                                                                                5                     5

(1) Amounts presented net of noncontrolling interests' share and Welltower's share of unconsolidated entities.
(2) Includes estimated gains on projected dispositions.

                                                                                                                                    39
NOI, IPNOI, REVPOR & SS REVPOR
We define NOI as total revenues, including tenant reimbursements, less property operating expenses. Property operating expenses represent costs
associated with managing, maintaining and servicing tenants for our properties. These expenses include, but are not limited to, property-related
payroll and benefits, property management fees paid to operators, marketing, housekeeping, food service, maintenance, utilities, property taxes and
insurance. General and administrative expenses represent costs unrelated to property operations and transaction costs. These expenses include,
but are not limited to, payroll and benefits, professional services, office expenses and depreciation of corporate fixed assets.
IPNOI represents NOI excluding interest income, other income and non-IPNOI and adjusted for timing of current quarter portfolio changes such as
acquisitions, development conversions, segment transitions, dispositions and investments held for sale.
REVPOR represents the average revenues generated per occupied room per month at our seniors housing operating properties. It is calculated as
our pro rata version of total resident fees and services revenues from the income statement divided by average monthly occupied room days. SS
REVPOR is used to evaluate the REVPOR performance of our properties under a consistent population which eliminates changes in the
composition of our portfolio. It is based on the same pool of properties used for SSNOI and includes any revenue normalizations used for SSNOI.
We use REVPOR and SS REVPOR to evaluate the revenue-generating capacity and profit potential of its seniors housing operating portfolio
independent of fluctuating occupancy rates. They are also used in comparison against industry and competitor statistics, if known, to evaluate the
quality of our seniors housing operating portfolio.
We believe NOI, IPNOI, REVPOR and SS REVPOR provide investors relevant and useful information because they measure the operating
performance of our properties at the property level on an unleveraged basis. We use these metrics to make decisions about resource allocations
and to assess the property level performance of our properties.

                                                                                                                                                      40
In-Place NOI Reconciliations
(dollars in thousands)                                                                                                                                           Genesis    Proforma              % of
                                                                       1Q21                  1Q19              In-Place NOI by property type          1Q21     Powerback(5)  1Q21(5)              Total
Net income (loss)                                                  $     72,192          $    292,302          Seniors Housing Operating          $    647,632 $       — $     647,632             39 %
Loss (gain) on real estate dispositions, net                            (59,080)             (167,409)         Seniors Housing Triple-Net              362,608         —       362,608             22 %
Loss (income) from unconsolidated entities                              (13,049)                9,199          Outpatient Medical                      399,868         —       399,868             24 %
Income tax expense (benefit)                                              3,943                 2,222          Health System                           143,684     16,549      160,233              9%
Other expenses                                                           10,994                 8,756          Long-Term/Post-Acute Care               127,216    (23,346)     103,870              6%
Impairment of assets                                                     23,568                    —                Total In-Place NOI            $ 1,681,008     $      (6,797)    $ 1,674,211   100 %
Provision for loan losses                                                 1,383                18,690
Loss (gain) on extinguishment of debt, net                               (4,643)               15,719
Loss (gain) on derivatives and financial instruments, net                 1,934                (2,487)
General and administrative expenses                                      29,926                35,282          In-Place NOI by property type          1Q19            % of Total
Depreciation and amortization                                           244,426               243,932          Seniors Housing Operating          $   1,016,744              48 %
Interest expense                                                        123,142               145,232          Seniors Housing Triple-Net               381,464              18 %
Consolidated net operating income                                       434,736               601,438          Outpatient Medical                       371,952              17 %
NOI attributable to unconsolidated investments (1)                       21,516                21,827          Health System                            143,200               7%
NOI attributable to noncontrolling interests (2)                        (20,827)              (41,574)         Long-Term/Post-Acute Care                205,628              10 %
Pro rata net operating income (NOI)                                     435,425               581,691               Total In-Place NOI            $ 2,118,988              100 %
Adjust:
Interest income                                                          (19,579)              (15,119)
Other income                                                              (8,131)               (7,690)
Sold / held for sale                                                     (19,082)              (11,789)
Developments / land                                                       1,436                   409
Non In-Place NOI(3)                                                      29,616               (20,971)
Timing adjustments(4)                                                       567                 3,216
In-Place NOI                                                            420,252               529,747
Annualized In-Place NOI                                            $ 1,681,008           $ 2,118,988
(1) Represents Welltower's interest in joint ventures where Welltower is the minority partner.
(2) Represents minority partner's interest in joint ventures where Welltower is the majority partner.
(3) Primarily represents non-cash NOI.
(4) Represents timing adjustments for current quarter acquisitions, construction conversions and segment or operator transitions.
(5) Pro forma adjustments to reflect the transition of 9 Genesis-operated PowerBack properties to an 80/20 joint venture with ProMedica, as if the transaction occurred on January 1, 2021. See
this presentation and our press release dated March 2, 2021 for further information on the transaction. Pro forma adjustments are based on estimates and assumptions and are preliminary in
nature, and should not be assumed to be an indication of the results that would have been achieved had the transaction been completed as of the date indicated.                                           41
• SSNOI Reconciliations
   SHO REVPOR Growth Reconciliation
(dollars in thousands, except SS REVPOR )
                                                                                                                                                   1Q20 As           Leap Year
                                                                                                                              1Q21                 Reported         Adjustment(10)    Adjusted 1Q20
SHO SS REVPOR Growth
Consolidated SHO revenues                                                                                             $          726,402      $       851,128
Unconsolidated SHO revenues attributable to    WELL(1)                                                                            43,245                44,396
SHO revenues attributable to noncontrolling interests (2)                                                                         (58,529)             (73,534)
SHO pro rata revenues(3)                                                                                                         711,118              821,990
Non-cash revenues on same store properties                                                                                            (839)               (797)
Revenues attributable to non-same store properties                                                                                (74,674)             (84,177)
Currency and ownership adjustments(4)                                                                                                  87               10,916
Normalizing adjustment for policy change(5)                                                                                             —               (1,610)
Other normalizing   adjustments(6)                                                                                                      —                      63
SHO SS revenues(7)                                                                                                    $          635,692      $       746,385       $      (3,387)   $     742,998
Avg. occupied   units/month(8)                                                                                                    38,056                44,023                              44,023
SHO SS REVPOR(9)                                                                                                      $              5,645    $          5,730                       $        5,704
SS REVPOR YOY growth                                                                                                                                       (1.5)%                              (1.0)%

(1) Represents Welltower's interests in joint ventures where Welltower is the minority partner.
(2) Represents minority partners' interests in joint ventures where Welltower is the majority partner.
(3) Represents SHO revenues at Welltower pro rata ownership.
(4) Includes where appropriate adjustments to reflect consistent property ownership percentages, to translate Canadian properties at a USD/CAD rate of 1.2658 and to translate UK properties at a
GBP/USD rate of 1.38.
(5) Represents normalizing adjustment to reflect the application of consistent policies for all periods presented for one Seniors Housing Operating partner.
(6) Represents aggregate normalizing adjustments which are individually less than .50% of SSNOI growth.
(7) Represents SS SHO revenues at Welltower pro rata ownership.
(8) Represents average occupied units for SS properties on a pro rata basis.
(9) Represents pro rata SS average revenues generated per occupied room per month.
(10) Represents 1/29th of February 2020 revenues for properties subject to daily billing.                                                                                                               42
• SSNOI Reconciliations
  SHO SS REVPOR Growth Reconciliation (cont.)
(dollars in thousands, except SS REVPOR )
As Reported:
                                              Assisted Living/Memory Care (1)             Independent Living (1)                 Senior Apartment                        Total
                                                   1Q21               1Q20               1Q21                1Q20              1Q21            1Q20              1Q21            1Q20
SHO SS revenues(2)                            $    431,044       $      519,867     $      193,030     $       215,605     $     11,618   $         10,913   $    635,692    $    746,385
Avg. occupied units/month(3)                        17,489               21,292              20,567             22,731            3,078              3,072         38,056          44,023
SHO SS REVPOR(4)                              $      8,330       $        8,252     $         3,730    $           3,707   $      1,276   $          1,200   $      5,645    $      5,730
SS REVPOR YOY growth                                    0.9 %                                0.6%                                6.3%                               (1.5)%

Leap Year Adjusted:
                                              Assisted Living/Memory Care (1)             Independent Living (1)                 Senior Apartment                        Total
                                                   1Q21               1Q20               1Q21                1Q20              1Q21            1Q20              1Q21            1Q20
SHO SS   revenues(2)                          $    431,044       $     516,546      $      193,030     $      215,539      $     11,618   $      10,913      $    635,692    $    742,998
Avg. occupied units/month(3)                        17,489              21,292              20,567             22,731             3,078           3,072            38,056          44,023
SHO SS REVPOR(4)                              $      8,330       $       8,199      $        3,730     $        3,705      $      1,276   $       1,200      $      5,645    $      5,704
SS REVPOR YOY growth                                    1.6 %                                0.7%                                6.3%                               (1.0)%

(1) Properties are classified between Assisted Living/Memory Care and Independent Living by predominant unit type.
(2) Represents SS SHO revenues at Welltower pro rata ownership. See previous page for reconciliation.
(3) Represents average occupied units for SS properties related solely to predominant unit type on a pro rata basis.
(4) Represents pro rata SS average revenues generated per occupied room per month.

                                                                                                                                                                                        43
44
You can also read