EAST DARAA, SYRIA FIRST FOLLOW-UP ASSESSMENT - MSF HEALTH SURVEILLANCE PROGRAMME Centre for the Advancement of Humanitarian Medicine May 2017
←
→
Page content transcription
If your browser does not render page correctly, please read the page content below
MSF HEALTH
SURVEILLANCE
PROGRAMME
EAST DARAA, SYRIA
FIRST FOLLOW-UP
ASSESSMENT
Centre for the Advancement
of Humanitarian Medicine
May 2017
© MSF
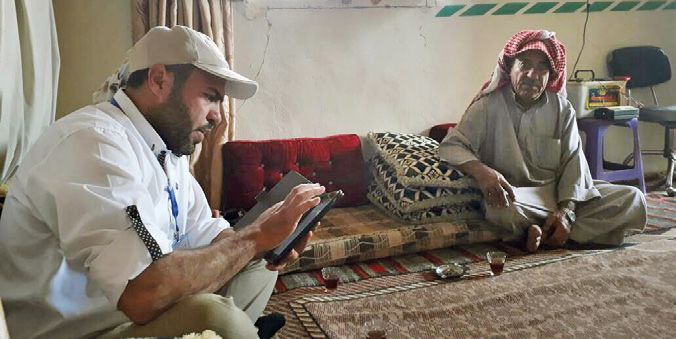
Old lady from Daraa being interviewed by MSF teams.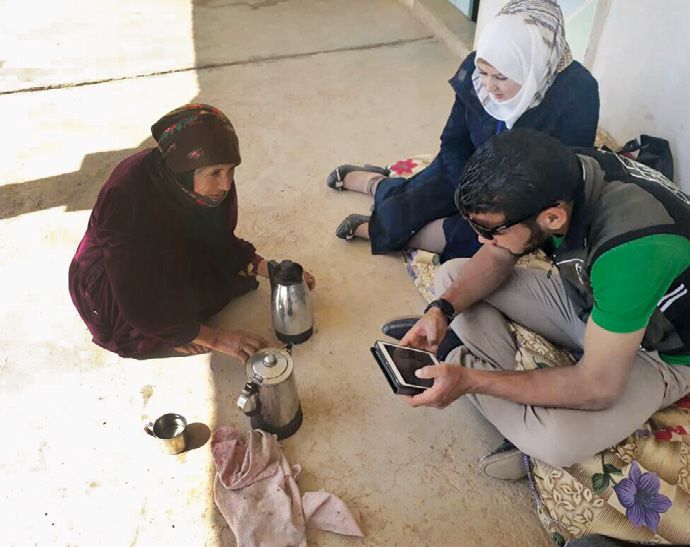
MSF Middle East Unit
Centre for the Advancement of Humanitarian Medicine
Health Surveillance Programme
Building No. 12
Jordan Tower Building; 5 th Floor
Abdul Hameed Shoman Street
Al-Shemsani
Amman, Jordan
P.O. Box: 942212

MSF Headquarters
Médecins Sans Frontières/Médicos Sin Fronteras
Nou de la Rambla, 26
08001 Barcelona, Spain

Tel: +34 933 046 100
Fax: +34 933 046 102
www.msf.es
EAST DARAA, SYRIA, FIRST FOLLOW-UP ASSESSMENT

TABLE OF
CONTENTS
04   About the crisis

06   Study objectives
06   Primary assessment components
06   Secondary assessment components

07   Methodology
08   Inclusion and exclusion criteria
08   Survey instrument
08   Data cleaning
08   Data analysis

09   Results
09   Household demographics
10   Displacement
10   Living conditions
11   Food access
12   Mortality
12   Chronic diseases burden
13   Healthcare-seeking behaviour
16   Predictive analysis
16   Mental health
16   Immunisation
        BCG
        Hepatitis B
        Pentavalent Vaccine
        Measles
        OPV
21   Sexual and reproductive health

22   Summary and recommendations
24   Study limitations
25   Contact information

26   References

                                                                                    3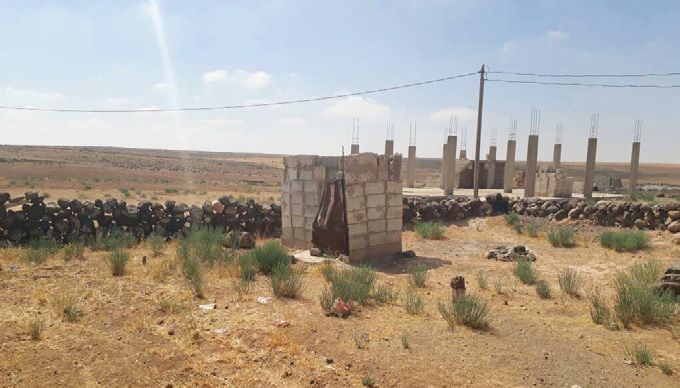
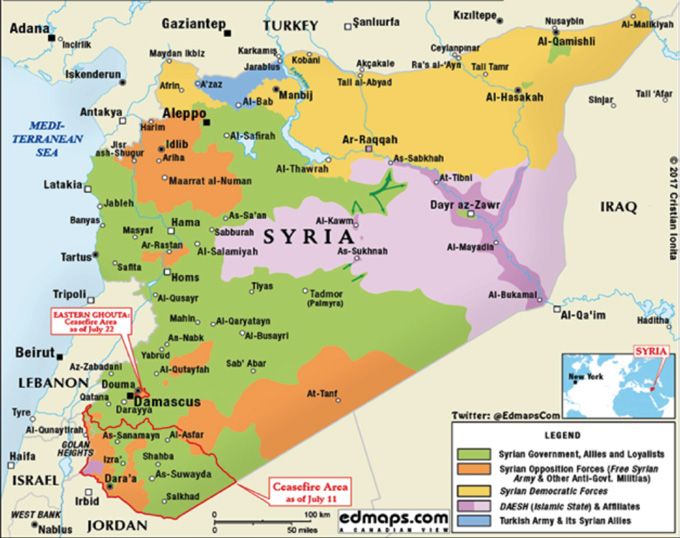
MSF HEALTH SURVEILLANCE PROGRAMME

ABOUT THE CRISIS
Figure 1. Syrian Civil War: terrotorial control map as of July 22, 2017

As the Syria crisis enters its seventh year, people                  Over half of the population, many of whom have been
continue to suffer the consequences of a conflict that               displaced multiple times, have been forced from their
has caused destruction and devastation with complete                 homes. This conflict has affected adults and children
disregard for human life. The United Nations Office for              alike, exposing them to grave protection threats.
the Coordination of Humanitarian Affairs (UNOCHA)                    Children and young people comprise more than half
estimates that 13.5 million people require humanitarian              of the displaced communities, as well as half of those
assistance, 4.6 million of whom are trapped in hard-to               in general need of humanitarian assistance.
reach and besieged areas.

4
EAST DARAA, SYRIA, FIRST FOLLOW-UP ASSESSMENT

                                                                                                                 © MSF
There are currently 13 besieged locations across Syria
where people are trapped. Humanitarian groups do not
have sustainable access to these areas, and people are
being denied the most basic rights, including freedom
of movement and access to adequate food, water and
healthcare. This is paralleled by a complicated political
landscape where neighbouring countries have restricted
the admission of people fleeing Syria. This has left
hundreds of thousands of people stranded on their
borders in deplorable conditions and exposed to a range
of life-threatening needs.

In the absence of a political solution to the conflict,
intense and widespread hostilities are likely to persist

                                                                                                                 © MSF
in some parts of the country throughout 2017.

http://www.unocha.org/syrian-arab-republic/
syria-country-profile/about-crisis

                                                            Normal roads in towns in east Daraa.

                                                                                                             5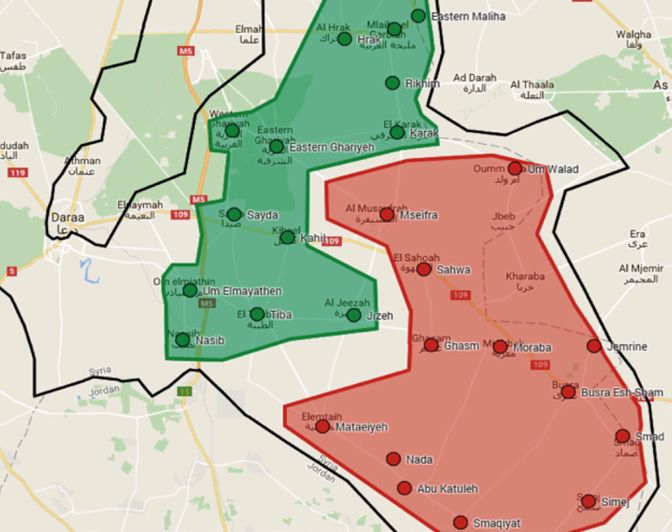
MSF HEALTH SURVEILLANCE PROGRAMME

STUDY OBJECTIVES
The objectives of the Eastern Daraa First Follow-up        7. What is the current use and sources of medication
Assessment, conducted in all study settings with the           used among this population?
participation of all respondents, aimed to answer          8. What is the prevalence of chronic medical conditions
the following questions.                                       among the population in this region?
                                                           9. What are the gaps in medical coverage among those
PRIMARY ASSESSMENT COMPONENTS                                  who have been diagnosed with chronic medical
1. What are the critical health needs of the people            conditions in this area?
   currently living in eastern Daraa?                      10. What type and amount of medical services are
2. What is the current quality of life of those living         available for the population in this region?
   in the area of interest?                                11. What is the health services utilisation behaviour and
3. How do the follow-up findings compare to the                rate of use for this population?
   baseline findings?                                      12. Are health service utilisation behaviours related to
                                                               recent population displacement?
SECONDARY ASSESSMENT COMPONENTS                            13. What is the immunisation coverage, incidence of
1. What is the demographic profile of households               diarrhoeal disease, and prevalence of respiratory
   currently living in eastern Daraa governorate?              infection among children under the age of five among
2. What are the medical service access issues and              those displaced in this area?
   concerns among the overall population in this region?   14. What reproductive health and family planning
3. What is the crude mortality rate among this                 services are used by women of 15-49 years of age
   population?                                                 in this area?
4. What are the general morbidities and prevalence         15. What is the current situation among this population
   of these morbidities among this population?                 related to shelter and sanitation?
5. What proportion of overall population mortality         16. What are the current issues among this population
   and morbidity is related to the current conflict            related to non-food items, including summer cooling
   in the region?                                              supplies, bedding?
6. What are the recent healthcare-seeking behaviours       17. What are the current and future plans of the
   of the overall population in the eastern Daraa              population in this area in terms of income generation
   governorate area?                                           and if applicable, ‘home region’ repatriation?

6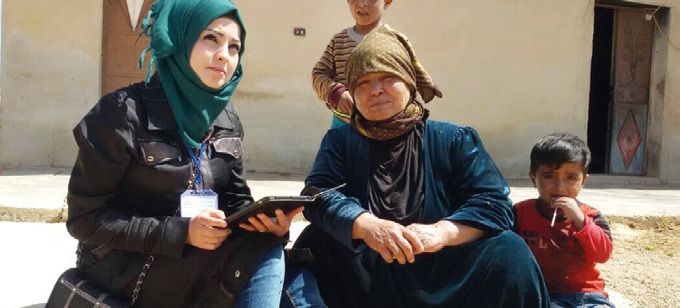
EAST DARAA, SYRIA, FIRST FOLLOW-UP ASSESSMENT

METHODOLOGY
The area of interest comprises the cities, towns, and      locations, trained data collectors proceeded to collect
villages of Smaqiyat, Simej, Smad, Busra Esh-Sham,         data until the target sample size was reached.
Jemrine, Moraba, Nada, Abu Katuleh, Mataeiyeh, Ghasm,
Sahwa, Jizeh, Mscifra, Karak, Um Walad, Rikhim,            The target sample size was a minimum of 3,500
eastern Maliha, western Maliha, Hrak, Nasib, Tiba, Um      individuals, from at least 600 households dispersed
Elmayathen, Kahil, Sayda, western Gharyeh and eastern      throughout 26 small communities. Within each
Gharyeh. The total population in this catchment area is    household that met the inclusion criteria, a pre-tested,
estimated to be approximately 200,000 people, including    standardised, comprehensive questionnaire was
internally displaced people (IDPs), according to local     administered to all persons who met the ‘household
government estimates. The sampling strategy used           definition’ (see below). Dharma Mobile™ software was
was a multi-stage cluster sampling design. Since the       used for data collection, storage, and some automated
sampling frame was very large, two clusters (labelled as   analytic. Data collectors used MSF- provided mobile
Red and Green) of equal size were initially selected to    data collection devices (iOS tablets, mini iPads) for
represent the different social demographics of the area.   all collection activities. Access to the MSF Health
Within each cluster we then conducted a systematic         Surveillance Program (HSP) web portal is available
random sampling of every sixth dwelling. At all selected   internally for authorised MSF staff.

Figure 2. Assessed towns and cities in east Daraa

                                                                                                                      7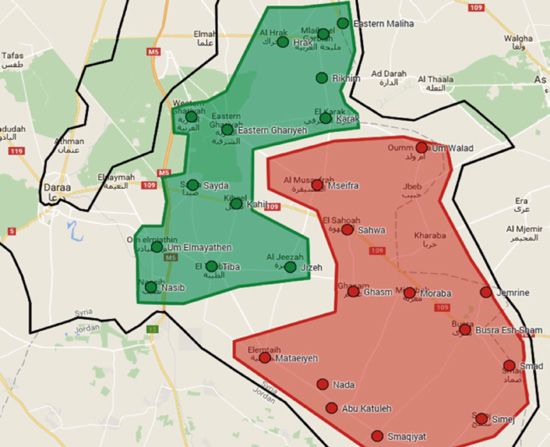
MSF HEALTH SURVEILLANCE PROGRAMME
INCLUSION AND EXCLUSION CRITERIA
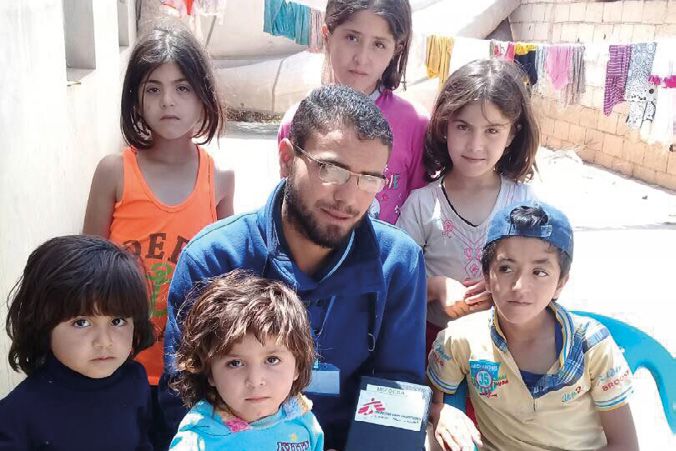
© MSF
All persons living in the area of interest were included
as participants in the East Daraa Follow-up Assessment,
regardless of the period of time they had been living in
the current location. Syrians, Iraqis, Palestinians and
people of other nationalities who were living in the study
locations were all included as participants. There were
no exclusions related to gender, age, sex, ethnicity or
socioeconomic reasons.
Inclusion: All participants from selected dwellings who
met the ‘household’ definition as described below.
Exclusion: Any members of selected dwellings who did
not meet the ‘household’ definition as stated below. MSF teams during households’ visits.
Household: PPrimary family members living in the same
dwelling for at least one month prior to interview. In
addition, any individual living and eating with primary DATA CLEANING
family members for at least one month prior to interview The data was extracted from Dharma platform in a
were included. csv format. It was then converted to an xls format and
imported to Stata 13 MP. The total count amounted to
SURVEY INSTRUMENT 5,166 entries representing a stacking of household and
A standardised questionnaire was used for the MSF-HSP: individual level data. The two datasets were separated
Eastern Daraa Follow-up Assessment. This instrument based on a unique pattern at household level. The
has been used by MSF’s Operating Centre Geneva household level dataset was merged under the individual
(OCG) and Operating Centre Barcelona-Athens (OCBA) dataset facilitating the use of the household identifier
sections since 2014, and was designed and implemented as a cluster variable to adjust for random effects in
originally by researchers with the World Health multilevel modelling. Multiple choice variables were
Organization (WHO) in Iraq. Additional reproductive split into categorical binary variables for bivariate and
health questions were incorporated from Knowledge, multivariate analyses. Using household identifiers,
Practices, & Coverage surveys (USAID-sponsored individual-level variables were recoded numerically and
Maternal and Child Health Integrated Program (MCHIP) collapsed to a household level using the summation
assessments). All addendums/additional questions were function when needed for cross-tabulations and
first vetted by the MSF OCBA regional medical advisor advanced analyses at household level.
and HSP project manager and they were piloted during
data collector training for region-specific integration DATA ANALYSIS
prior to deployment. All question components used key Analysis was conducted using Stata 13 MP. In the
WHO and Centers for Disease Control and Prevention absence of true population figures and household
(CDC) indicators, which matched survey research listings, the collected data could not be weighted
questions from UNHCR, UNICEF, MSF, and WHO to adjust for survey design such as intra- and inter-
standards. This protocol was submitted and approved cluster correlations. Therefore, univariate and bivariate
for use by the MSF Ethical Review Board (ERB). logistic regression models with robust standard error
adjustments were used to calculate prevalence estimates
and their confidence intervals. A p-value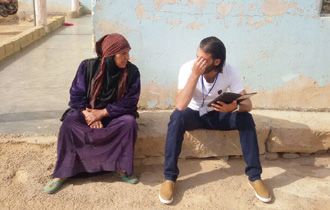
EAST DARAA, SYRIA, FIRST FOLLOW-UP ASSESSMENT

RESULTS

                                                                                                                                      © MSF
MSF teams during households’ visits; photo shows a household with 6 children.

The following results represent the responses collected               wife in a notable 42.6% of the cases. On average, there
from 959 households and a total of 4,207 individuals                  were 4.92 members in each household and 17% of
in east Daraa. The achieved sample size exceeded                      households had seven or more members while 2.1% had
the calculations at a design phase, and this surge in                 one single member. This highlights a drop in household
statistical power provides increasingly precise inferences            size compared to the baseline assessment (5.7) whereby
at population level.                                                  there is on average almost one individual less per
                                                                      household. The cross-border task force (CBTF) recently
HOUSEHOLD DEMOGRAPHICS                                                reported an increased average household size from five
The total number of sampled individuals was almost                    to six in Daraa and Quneitra making this observed drop
equally distributed among males (50.7%) and females                   in household size a finding specific to east Daraa.
(49.3%). The mean age of the population was 25.13
± 19.07 and the median was 20 years of age. This                      The level of education of the head of household in the
divergence between mean and median underlines a                       follow-up east Daraa assessment was fairly comparable
skewed age distribution whereby 60% of the sample                     to the baseline findings. Generally, only 11% of heads of
is under the age of 25 and 80% under the age of 40.                   household could not read and write, while almost 51%
Interestingly, the interviewed head of the household                  reported an intermediate school level of education
was the husband in only 44.2% of the cases and the                    or higher.

                                                                                                                                  9
MSF HEALTH SURVEILLANCE PROGRAMME

DISPLACEMENT                                                                                      Figure 4. Settlement type
The absolute majority of households (94%) are originally
from Daraa governorate with almost half of the sample                                                                                 83.7

(47%) reportedly having resettled at least once since                                             80 %

the start of the conflict in 2011, indicating a high level                                                                     66.8

of internal displacement within the governorate. The
                                                                                                  60 %
average amount of resettlement across households was
found to be 2.8 times, a slight drop from the 3.2 times
reported last year. This average was 2.5 in Busra city                                            40 %

(which we were unable to sample in the baseline) and the                                                                                           26.5
area surrounding it, and 3.5 in the area further outside.
                                                                                                  20 %
In 90% of the cases, the reason for resettlement was                                                                                                      11.5
                                                                                                             5.3
violence-related (bombings or clashes).                                                                              3.6                                            1.4       1.2
                                                                                                   0%

Figure 3. Reasons for changing settlement                                                                   Apartment          Completed           Damaged              Other
                                                                                                                               house               house

                                                                                                              Displaced            Host
60 %     58.5

                                                                                                  Figure 5. Settlement cost
40 %

                     31.7
                                                                                                                                              80.8
                                                                                                  80 %
20 %

                                                                    4.7                           60 %
                                   1.0        1.0       1.2                      0.0       1.7
 0%
                                                                                                                                       43.8
       Violence-     Violence-    Poor       To seek   Dwelling   Forced        Opening   Other
       bombing       clashes in   access     job       was not    to move       of new
       or shelling   your area    to                   livable    by military   camp              40 %        37.9
                                  services                        or police

                                                                                                  20 %                13.9                                       18.0

                                                                                                                                                                        4.9

LIVING CONDITIONS                                                                                  0%

The majority of households were living in completed                                                          Live for no                     Own                   Rent
                                                                                                             cost
houses (74%) and reported owning the shelters in which
they were living (62%). The different types (p=0.000)                                                              Displaced          Host

and costs (p=0.000) of the shelter however, were
significantly mediated by the displacement status of
households. Although the majority of households were                                              Shelters were reportedly not protected from wind and
living in completed houses, 26.5% of displaced people                                             rain in 15% and 21% of cases respectively, a decrease
were living in damaged houses compared to only 11.5%                                              from last year’s 21% and 28%, respectively. The
of host communities. Additionally, while 81% of the host                                          protection of shelters from rain on the one hand and
population reported owning their shelters, only 44% of                                            wind on the other was less common among displaced
displaced households owned their shelters and 38% of                                              people than among host ones. These associations
them were living at no cost. Moreover, 5% of hosts and                                            with displacement status were found to be statistically
18% of displaced people were renting their shelters.                                              significant (p=0.000).

10
EAST DARAA, SYRIA, FIRST FOLLOW-UP ASSESSMENT
Figure 6. Protection from rain FOOD ACCESS
Out of the total sampled households, 25% reported
worrying about running out of food in the last 30 days
60 %
due to a lack of money, and 15% actually ran out of food
for at least one day over the past 30 days prior to the
40 % interview. Additionally, 26% reported skipping a meal
25.9
and 10% reported going a whole day without eating in
20.2
the past 30 days due to shortage of resources. These
20 % 16.0
10.1 results were significantly mediated by displacement
status whereby the prevalence of worrying about
0% running out of food (p=0.067), actually running out
Not protected Not protected of food (0.018), and skipping a meal (p=0.007) in the
from rain from wind
past 30 days, was higher among displaced people
Displaced Host (28.4%; 19.2%; and 31% respectively) than among host
communities (23.1%; 13.3%; and 23% respectively).
The vast majority of households reported having flush Figure 7. Food availability
toilets connected to sewers (79.1%) or septic tanks
(10.6%) as well as having a private shower that they 31.0
do not share with others (90%), similar figures to the 30 %
28.4
findings of the baseline assessment. Moreover, electricity 23.1 22.9
was not available in 8.8% of households compared to last 19.2
20 %
year’s 10.81%. However, the average hours of electricity
13.3
per day in the households where it is available dropped
from 5.51 hours per day in the baseline assessment to 10 %
3.48 hours per day in the follow-up assessment.
0%
Worry about Actually ran Skipped
running out out of food a meal
of food
Displaced Host
© MSF
MSF teams during households’ visits.
11MSF HEALTH SURVEILLANCE PROGRAMME
MORTALITY CHRONIC DISEASE BURDEN
The crude mortality rate was calculated at 0.42 deaths The results indicate that 17.3% of the sample reported
per 10,000 people per day, a slight increase from the suffering from at least one chronic illness, which is a
0.3 deaths per 10,000 people per day observed at slight increase from the 15.7% reported last year. Among
baseline. 51 deaths assessed over the past 12 months those 17.3% who have one or more chronic disease,
were mainly caused by illnesses (37%) and war clashes the most prevalent chronic diseases were Chronic Joint
(39%). The association between displacement and Diseases (28.7%), Hypertension (22.7%) and Diabetes
the causes of deaths was not statistically significant Mellitus (16.8%). The baseline analysis reported similar
(p=0.974), possibly due to the relatively low number of top chronic disease burdens.
deaths sampled. Alternatively, this could be due to both
population subsets living in the same geographical area Figure 9. Distribution of chronic illnesses
and being exposed to similar levels of risk.
40 %
Figure 8. Cause of death
23.7
30 % 28.7
14 22.7
12 20 %
16.8
10
9.2 8.9
8 10 %
6 3.1 2.8 2.4
1.0
4 0%
Hypertension
Angina
Stroke
Diabetes Mellitus
Chronic Joints
Diseases
Asthma or COPD
Epilepsy
Chronic Renal
Failure
Cancer
Other
2
0
Illness Non-military War clashes War clashes
trauma in Daraa in other region
of Syria
Displaced Host
© MSF
These common morbidities were stratified by gender
and displacement to detect potential associations that
can better guide the response. The results indicate that
hypertension was significantly associated with gender
(p=0.001) with 17% of males and 27.4% of females
found to be hypertensive among those who reported
suffering from at least one chronic illness. Additionally,
hypertension was more prevalent (26%) among host
communities than it was among displaced ones (19.9%),
among those who reported suffering from at least one
chronic illness, but this association was not statistically
significant (p=0.137). Also among this subset, diabetes
was significantly more prevalent among women than it
MSF teams during households’ visits. was among men but was not mediated by displacement.
Furthermore, chronic joint disease was not significantly
associated with gender but was found to be significantly
more prevalent among displaced people.
12EAST DARAA, SYRIA, FIRST FOLLOW-UP ASSESSMENT
Gender Community
Males Females p-value Host Displaced p-value
Hypertension 17.1 27.4 0.001 20 26 0.137
Diabetes 13.8 19.6 0.039 18.6 15.5 0.508
Joint Disease 26.9 30.8 0.254 22.6 34.5 0.002
Angina 9.8 8.6 0.590 10.8 7.5 0.002
Stroke 4 3.1 0.544 4 3.1 0.790
Asthma 11 7.3 0.086 8.7 9.3 0.908
Epilepsy 2.7 2.9 0.923 3.4 2.3 0.680
Renal 1.8 2.9 0.368 1.5 3.1 0.395
Cancer 0.6 1.3 0.351 1.2 0.8 0.822
The prevalence of smoking across our sample was found HEALTHCARE-SEEKING BEHAVIOUR
to be 23.6%, indicating a slight decrease from the 26.4% The results indicate that 753 (18.2%) respondents
observed at baseline. Smoking was significantly more reportedly needed medical care in the past 30 days,
prevalent among men (24%) than among women (1.9%). a decrease from the 25% reported in the baseline
Furthermore, linking smoking with non-communicable report. The leading chronic conditions for which care
diseases (NCDs) assessed, smokers were significantly was sought were joint disease (11.2%), hypertension
(p=0.000) more likely to suffer from angina, strokes (8.7%) and diabetes mellitus (5.3%). The leading acute
and chronic joint disease. However, the results indicate conditions for which care was sought were respiratory
that non-smokers were significantly more likely to be infections (16.8%), gastrointestinal tract infections (7.8%)
hypertensive. and urinary tract infections (3.7%). Out of those 753
individuals, almost 89% sought care, 94.6% of whom
Figure 10. NCD prevalence among smokers received care in the primary care-seeking location.
Whenever medical care was sought, it was primarily in
40 %
private physician clinics (39%), outpatient departments
35.8
in the region of residence (21%) or through hospitals
32.0 (ward admissions or ER) (17.7%). Whenever this care
29.0
30 % was reportedly sought in emergency rooms or through
hospital admissions, the vast majority of health needs
21.0
20 %
19.0 (almost 61%) were attended in Busra Al-Sham hospital.
17.0
13.9
Figure 11. Locations where healthcare was sought
9.2
10 %
5.1 40 % 38.9
3.0
0%
Hypertension Diabetes Chronic Joint Angina Stroke 30 % 20.7
Disease
Smoker Non-smoker 17.7
20 %
10 %
6.5
4.2 4.5
3.0 2.2 1.8
0%
Emergency room
Home services
OPD managed by
Hospital admission
Outpatient
department outside
region
Outpatient
department in region
OPD managed by
NGO in region
NGO outside region
Pharmacy
Private doctors’
clinics
13MSF HEALTH SURVEILLANCE PROGRAMME
The association between reportedly needing care (and Figure 12. Hospitals where care was sought by
ultimately seeking it) and the location of individuals was cluster location
found to be statistically significant (p=0.000). Two clusters
were initially defined for sampling purposes and the 70.7
sample was equally distributed across clusters. The red 70 %
cluster underlined the area surrounding Busra city while
the green one was further out to the west of east Daraa.
60 %
The probability of needing healthcare was higher (25.9%) 52.4
among households in the vicinity of Busra Al-Sham (red
cluster) compared to households in the green cluster 40 %
(11.1%). Therefore, the likelihood of needing/seeking 25.9
healthcare decreased the further away households
20 %
14.3
were from Busra. The probability of seeking healthcare 11.1 10.3
6.0
based on needs should not be affected by the location of 4.8
individuals, but people living closer to Busra hospital may 0%
feel more compelled to report on their healthcare-seeking Total health
needs
Jizah
and Nassib
Busra
Al Sham
Damascus
behaviours. That being said, households that were located
in the green cluster were significantly more likely to Red Green
receive care in Jizah or Nassib (part of the green cluster)
due to their proximity to these hospitals.
14EAST DARAA, SYRIA, FIRST FOLLOW-UP ASSESSMENT
Summary of facilities utilisation across clusters
Total Red Green
n % n % n %
Needed care 752 18.3 518 25.9 234 11.1
Received care at hospital 137 20.6 116 24.7 21 10.7
Received care at Busra hospital 83 60.6 82 70.7 1 4.8
Spent one night in hospital 173 4.2 140 7.0 33 1.6
Spent that night in Busra hospital 83 48.0 82 58.6 1 3.0
Has used Busra hospital at least once 247 6.0 235 11.7 12 0.6
Services used when visiting Busra
Medical 155 62.7 152 64.7 3 25.0
Surgical 49 19.8 42 17.9 7 58.3
Paediatrics 16 6.5 15 6.4 1 8.3
Obstetrics 11 4.4 11 4.7 0 0.0
Gynaecological 7 2.8 7 3.0 0 0.0
Others 9 3.6 8 3.4 1 8.3
As mentioned above, healthcare was primarily sought Figure 14. Barries to seeking healthcare
in hospitals and private clinics. For the 11.6% (86
individuals) who did not seek care, the primary barrier
59.3
was cost (59.3%). For the 5.4% (35 individuals) who 60 %
sought and did not receive care, the primary barriers to
this access were cost (37.1%) and unavailability of either
40 %
services (28.6%) or medication (11.4%).
Figure 13. Barries to receiving healthcare whenever sought 30 %
40 % 37.1 20 % 17.4 17.4
28.6
30 % 10 %
5.8
20 % 17.1 0%
Too far away
Too expensive
Too dangerous
Don't know
where to seek
11.4
10 %
2.9 2.9
0%
Staff refused
admission
Too expensive
Unavailable
medication
Unavailable
services
Other
Don't know
15MSF HEALTH SURVEILLANCE PROGRAMME
PREDICTIVE ANALYSIS MENTAL HEALTH
Multilevel mixed-effects logistic regression was used to The results indicate that 12.3% of individuals older than
gain a better understanding of the correlations between 15 years of age who had been assessed for mental health
needing care and the different independent variables suffering had reported emotional suffering over the
that were either found to be significantly associated with past 30 days. This emotional suffering was numerically
this outcome at bivariate level or rationally expected to coded and collapsed to a household level with the results
be associated with it. In order to predict the greatest indicating that 20% of households reported at least one
amount of variability in the probability of needing care, member with emotional suffering over that time period.
we ran a model adjusting for household size, age, gender, Although non-significant (p=0.166), the association
education, displacement, suffering from at least one between household-level death and household-
chronic illness, and reported emotional suffering. The level emotional suffering generally depicts a greater
different education categories were lumped accordingly: proportion of emotional suffering across households that
no formal education (cannot read and write, can read reported death. In households where at least one death
and write), primary education, secondary education was reported, the prevalence of no emotional suffering
(secondary education, intermediate education, and is 69.4% compared to 80.2% in households with no
technical institutes), college or higher (graduate degree, reported deaths. On the other hand, the prevalence of
university). Taking the household as a random effect total emotional suffering in households with at least
and adjusting for all the mentioned fixed covariates, the one reported death is almost 31% compared to 19.7% in
association between suffering from chronic illnesses in households with no reported deaths. Emotional suffering
the past 12 months and reportedly needing care was was significantly more common among those who had
statistically significant and extremely strong. In fact, been resettled (14.6%) than those that had not been
respondents who had suffered from a chronic illness resettled (9.7%), and significantly more common among
in the past 12 months were 7.8 (95%CI: 5.56-11.10) residents of the red cluster (14.8%) than residents of the
times more likely to need care than those who had not green cluster (9.5%). Since resettlement is significantly
reported suffering from chronic illnesses. Additionally, more common among residents of the red cluster
respondents who were displaced at least once and those (60.5%) than residents of the green cluster (41.6%), it is
who had reported emotional suffering were respectively the main factor contributing to mental health suffering.
1.7 (95%CI: 1.12-2.34) times and 1.5 (95%CI: 1.01-2.24)
times more likely to need care compared to those who Figure 15. Emotional suffering caused by deaths in household
had not. Adjusting for all other fixed and random effects,
the associations between household size and education 80.2
80 %
on the one hand and reportedly needing care on the other
were not statistically significant.
69.4
70 %
Needing Care OR 95% CI
60 %
Household size 0.98 0.92 1.05
28.6
40 %
Gender 0.61 0.47 0.79
Age 1.01 1.01 1.02
18.9
20 %
Education
0.8 2.1
No formal 1.00 - 82 0%
No death 1 or more death
Primary education 0.96 0.58 1.61
No household members suffered
Secondary education 1.04 0.66 1.65
1 to 3 household members suffered
College or higher 1.15 0.62 2.12 4 or more household members suffered
Displacement 1.66 1.18 2.34
Suffered chronic illness 7.80 5.60 11.10
Emotional suffering 1.51 1.01 2.20
16EAST DARAA, SYRIA, FIRST FOLLOW-UP ASSESSMENT
IMMUNISATION
© MSF
The assessment captured information related to 445
children under the age of five. This subpopulation is
24.62 months old on average. The findings highlight that
98% of children under five received at least one vaccine
over the course of their life. Among the 2% who were not
vaccinated, the major barriers were distance (33.3%),
lack of trust in origin of vaccines (22.2%), and a general
reluctance to vaccinate (22.2%). The majority of children
were vaccinated in health centres in the same region
(80%), and surprisingly only 9% were vaccinated through
catch-up campaigns. It is worth mentioning here that
these vaccination centres in east Daraa are still receiving
the vaccines from Damascus. MSF teams during households’ visits.
Vaccination cards were available in 89.91% (392 children)
of cases and were used to extract detailed information
surrounding immunisation data, as well as mode and
frequency of administration. Whenever vaccination cards
were not available, the information was collected through
detailed questioning of the closest relative.
The categorical information for every antigen was split
into multiple dummy variables to highlight the different
possible doses, and the data was observed across age
groups reflecting an immunisation schedule specific to
the Syrian Arab Republic. The data is visualised both
within age categories and across a continuum up to the
age of five. The first is useful to highlight coverage rates
within specific age subsets. The second enables us to
observe the vaccine coverage compared to the growth
of the cohort of children, and subsequently highlight the
need for catch-up campaigns.
at least 1 at least 2 doses at least 3 doses at least 4 doses more than 4 doses
BCG 88.70% - - - -
Hep B 83.50% 46.70% 27.80% - -
Penta 78.60% 56.70% 28.70% 12.40% 1.30%
Measles 68.70% 33.40% 5.40% - -
OPV 92.80% 78.80% 52.40% 37.90% 28.90%
17MSF HEALTH SURVEILLANCE PROGRAMME
BCG Hepatitis B
The BCG vaccine is expected to be received only once The HepB vaccine is given in three doses; the first at
at birth and the results highlight a coverage of 88.7% birth and the remaining two at eight and 24 weeks after
across the sample with the lowest coverage (77.3%) birth. The coverage for at least one dose of HepB vaccine
in the 0-2 age group. This represents a drop in the total was relatively high across the sample at 83.5% with a
coverage compared to the 96.9% reported in the sharp drop to less than 50% and less than 30% coverage
baseline assessment. when respectively computing for at least two and at least
three doses received. The coverage for at least one dose
Figure 16. BCG coverage across age of HepB dropped considerably from the 96.32% reported
at baseline.
100.0
96.4 98.4 Figure 18. HepB coverage across age
100 %
88.7 87.6
100 % 95.2
80 % 75.0
74.5 90.0
85.7 84.6
83.5
80 %
60 % 72.3
60 % 58.7
53.3
40 %
46.7
37.5 39.7
40 % 36.7
20 % 32.1 31.7
27.8
25.5
23.3
19.1
20 %
0%
Total Up to 3 to 7 to 10 to 13 to More than
2 mo 6 mo 9 mo 12 mo 18 mo 18 mo
0%
Total Up to 3 to 7 to 10 to 13 to More than
2 mo 6 mo 9 mo 12 mo 18 mo 18 mo
Figure 17. BCG coverage by age HepB HepB 1 HepB 2 HepB 3 HepB more
100 % Figure 19. HepB coverage by age
88.6 86.0 90.2 88.7
77.3 100 %
80 %
83.5
82.1
80 % 75.2
60 %
68.2
60 % 46.7
40 %
40.9
40 % 37.5
20 %
26.4 27.8
20.5 22.3
0% 20 %
13.2
Up to Up to Up to Up to Total
3 mo 6 mo 12 mo 18 mo 4.5 2.5
0.8 1.1
0%
Up to Up to Up to Up to Total
3 mo 6 mo 12 mo 18 mo
HepB 1 HepB 2 HepB 3 HepB more
18EAST DARAA, SYRIA, FIRST FOLLOW-UP ASSESSMENT
Pentavalent vaccine Measles
The pentavalent vaccine consists of Diphtheria, Tetanus The coverage of measles was assessed by combining
Toxoid, Acellular Pertussis, Haemophilus Influenzae type both individual measles and MMR (Measles Mumps
B, and the Inactivated Polio Vaccine. It is expected to be Rubella) coverage. According to the schedule, measles is
given in four doses at eight weeks, 16 weeks, 24 weeks, supposed to be received in three dosages at nine months
and 18 months. The average coverage of at least one as measles vaccine alone, and MMR at 12 and 18 months
dose of this vaccine was 78% across the sample with of age. The total coverage of at least one dose of measles
rates reaching 86.5% across the highest age group of across the sample was 68.7%, a sharp drop from the
more than 18 months old. The coverage rate dropped 82.98% reported at baseline.
sharply with increased restriction on the dosages
whereby only 56.7%, 28.7% and 12.4% of the sample Figure 22. Measles and MMR coverage by age
reported receiving at least two, three and four dosages
of the vaccine, respectively. Similarly to BCG and HepB, 100 %
the total coverage was lower than the 91.26% reported
at baseline.
80 %
68.7
Figure 20. Penta coverage across age 66.8
60 %
100 % 47.2 48.5
44.6
87.3 86.5
40 %
33.4
80 % 78.6 29.8 31.5
70.2 23.4
66.7 68.3 66.4
20 %
60 % 56.7 9.9 8.7
2.3 5.4
4.5 4.5 4.5 1.7
3.7 2.3 4.1 0.8 2.2
46.4 0%
43.3
40.4 Up to Up to Up to Up to Total
40 % 38.1
31.7 3 mo 6 mo 12 mo 18 mo
30.0
28.7
25.5
18.8 18.1 Only measles MMR 2 Any source of measles
20 %
12.4 14.3
11.1 MMR 1 MMR more
2.1
0%
Total Up to 3 to 7 to 10 to 13 to More than
2 mo 6 mo 9 mo 12 mo 18 mo 18 mo
© MSF
Penta Penta 1 Penta 2 Penta 3 Penta 4 Penta more
Figure 21. Penta coverage by age
100 %
78.6
80 %
67.4
60 % 57.0 56.7
42.9
40 %
29.8
MSF teams during households’ visits.
28.7
36.4 24.5
20 % 17.4
13.6 12.4
9.1
4.3
0.8 0.8 0.5 1.3
0%
Up to Up to Up to Up to Total
3 mo 6 mo 12 mo 18 mo
Penta 1 Penta 2 Penta 3 Penta 4 Penta more
19MSF HEALTH SURVEILLANCE PROGRAMME
OPV
The Oral Polio Vaccine (OPV) is expected to be received
in four dosages (birth, 24 weeks, 12 months, and 18
months). The overall coverage of at least one dose of the
vaccine was as high as 93% with the lowest coverage
(37.5%) across the 0-2 months old group and the highest
(97.9%) across the 10-12 months old group. On average,
78.8% of the sample received at least two doses and
52.4% at least three doses. In the baseline assessment,
it was reported that 94.48% of children received at least
one OPV dose. The OPV vaccine coverage was the only
one comparable to the reported coverage at baseline.
Figure 23. OPV coverage across age
100 % 97.9 96.8 96.1
93.0 93.3
88.0
82.5
80 % 78.8 78.6 76.6
73.3
59.6 59.5
60 %
52.4 50.8
43.3 42.6 43.2
39.3 38.1
40 % 37.9 37.5 36.2 35.1
37.5 33.3
28.9
23.4
20.6
20 % 17.9 16.7 16.6
13.3 13.3
7.1
7.1 1.6
0%
Total Up to 3 to 7 to 10 to 13 to More than
2 mo 6 mo 9 mo 12 mo 18 mo 18 mo
OPV OPV 1 OPV 2 OPV 3 OPV 4 OPV more OPV catchup
Figure 24. OPV coverage by age
100 %
92.8
88.0
83.5
80 % 78.8
65.8
63.6
60 % 57.0
52.4
40.9 42.4
40 % 38.0 37.9
30.4
28.9
25.0 26.4
19.8 20.1
20 %
11.4 12.4 13.3
8.7
4.5 4.5
4.5
4.5
0%
Up to Up to Up to Up to Total
3 mo 6 mo 12 mo 18 mo
OPV OPV 1 OPV 2 OPV 3 OPV 4 OPV more OPV catchup
20EAST DARAA, SYRIA, FIRST FOLLOW-UP ASSESSMENT
SEXUAL AND REPRODUCTIVE HEALTH
© MSF
Out of the 4,207 respondents, there were a total of
1,081 women of reproductive age (between 15 and 49).
The use of family planning was estimated at a staggering
7.9% among women of reproductive age, a considerable
drop from the already low 16.9% reported at baseline.
Females most commonly used pills (39%) or intrauterine
devices (IUDs; 39%) as family planning methods. Only
7% used condoms whereas 3% reported not knowing
the available methods. Similar to the baseline findings,
family planning was significantly (p=0.01) more common
among displaced women (10%) than women living in
host populations (5.8%). The pregnancy prevalence
at baseline was 9.4%. At the time of the assessment, MSF teams during households’ visits.
10.3% of women reported being currently pregnant,
16% of which were unplanned pregnancies. Overall,
family planning methods were unsuccessful in 4% 20.3% visited private midwives, while the remaining
of cases. Among those women who reported being visited non-communicable disease clinics in various
currently pregnant, 22% had already delivered a child health facilities. Subsequently, 74.7% reported having
in the past 24 months. Based on this information, the to pay for these ANC services. Among the women of
estimated crude birth rate in east Daraa was 21.03 reproductive age, 76% did not have a single Tetanus
births/1000 people, a slightly lower estimate than the vaccine throughout their lives. This is a reflection of
25.7 births/1000 people observed at baseline. The the 2008 Syria MoH policy deeming Tetanus as an
average gestational age for current pregnancies was unnecessary vaccine.
20.2 weeks and 21.8% of women reported not receiving
services related to this pregnancy. The results indicate Within the last 24 months, 14.6% of women between
that 25% of currently pregnant women are planning to the ages of 15 and 49 reported being pregnant. Among
have home deliveries, essentially due to cost concerns these women, 66% had normal vaginal deliveries, 24.4%
(36%) and previous positive experiences (44%). In the had caesarean sections, 7.7% reported abortions and/or
event of medical emergencies, 44% of pregnant women miscarriages, and 1.9% had stillbirths. Only 83.3% of
reported no access to transportation while 16% reported these pregnant women received ANC during the past
not knowing if they would have access. The majority two years. The deliveries were assisted by midwives in
(78.2%) of currently pregnant women reported receiving 60% of pregnancies and medical doctors in only 31%
antenatal care (ANC). Among those who had received of pregnancies. Additionally, they were home deliveries
ANC, 62% received this care at private doctors’ clinics, in 29% of pregnancies.
21MSF HEALTH SURVEILLANCE PROGRAMME
SUMMARY &
RECOMMENDATIONS
© MSF
MSF teams during households’ visits, notice the battery setup used to get electricity behind the old man.
The ongoing crisis in Syria has clearly taken its toll on With the crisis in the middle of its seventh year, there is
populations, both in terms of demographics and needs. an evident process of community adaptation, especially
Displacement is a hallmark of humanitarian emergencies when compared to the findings observed at baseline
with inter-sectorial ramifications that often require almost one year earlier. Generally, there is an inverse
policy-guided solutions and timely and appropriate relationship between family size on the one hand, and
humanitarian response (Mowafi, 2011; Cernea, 1997). family resources and child education on the other
In east Daraa, displacement is mediating disparities (Downey, 1995). The drop in average household size in
extending beyond health and socioeconomic issues the area may indicate a decrease in nuclear family sizes
whereby displaced people are living in relatively poorer and ultimately better lifestyles, education and allocation
conditions with limited access to basic services. The of resources. The result of multiple surveys recently
violence and turmoil at the core of this displacement are conducted by different organisations in the south report
also suspected to drive the privatisation of care in this an increase in standard accepted household size to
area, effectively adding financial strain to an already six household members, but this increase seems to be
saturated community with gaps and needs. This is more specific to west Daraa and Quneitra. The decrease
nothing but a confirmation of the reported suffering in household size in east Daraa is also paralleled by
and breakdown of livelihood due to the destruction of a drop in average household resettlement in that
health systems in Syria (Sharara, 2014). There seems area. Additionally, the higher proportion (compared
to be a silver lining, however, amid this volatile context. to baseline) of female respondents representing the
22EAST DARAA, SYRIA, FIRST FOLLOW-UP ASSESSMENT
household at the time of interview, coupled with the low methods used were pills and withdrawal instead of
mortality rate at household level, potentially indicates a the favoured intrauterine devices (d’Arcangues, 2007).
growing stability and improved living conditions in east Among pregnant women, the assessment found a
Daraa. The unavailability of male heads of households at high reliance on midwives for both consultations and
the time of the interview could be due to their growing deliveries. This is consistent with the literature that
return to routine daily professions and chores. highlights the role of midwives in orienting women
towards informed choices and protective gatekeeping
Healthcare is generally received whenever needed and (Levy, 2006). Different factors and concerns ranging
sought in east Daraa, but it was more likely to be sought from money and transportation to culture and traditions
in the eastern part of east Daraa in general, and Busra are often key determinants of the place of delivery across
city in particular. This either indicates better service communities (Mrisho, 2007). Despite primarily reporting
provision in the eastern part of east Daraa (Busra cost concerns surrounding sexual and reproductive
hospital is the only hospital in Daraa fully supported health services as well as actual deliveries, women in
by one INGO) or a general underreporting of health east Daraa still most commonly resorted to private
needs in the western part of east Daraa. Regardless of clinicians when seeking these services. This could be
the location of households, health needs that required a reflection of the high security concerns surrounding
hospital care were predominantly met at Busra Hospital, public hospitals and health facilities being consistently
further cementing the operational value of this hospital targeted across Syria.
in east Daraa.
Although children are generally receiving different types
As was the case in the baseline assessment, the of vaccine antigens, this coverage is on several levels
prevalence of pregnancies among women of reproductive partial rather than comprehensive. In fact, the coverage
age was found to be slightly higher than the normal for all antigens was found to be in poor synchrony
expected rate in similar populations. This estimate with both the required amount of dosages and the
could potentially also be higher because women in immunisation schedule. While specific coverage did not
their first or second trimesters might not yet be aware coincide and fall in the expected age groups defined
of being pregnant and thus, may not report it. It could by the immunisation schedule, the oldest age group
also be argued that in a conservative community (above 18 months) almost always exhibited an increase
such as this one, women who are single or widowed in antigen coverage. There is a real concern however,
should be excluded from these calculations (although with regard to the completeness of the acquired
they may fall under the reproductive age category) immunity. The multiple dosages of any specific antigen
inflating the estimation even further. Coupled with are imperative for the immune system to develop proper
the high rate of unplanned pregnancies, this reflects long-lasting memory cells (Banatvala, 2000). There is
a gap in sexual and reproductive health services in an alarming proportion of children above 18 months
general, and family planning in particular. In fact, the of age (age after which the probability of routine
already low use of family planning at baseline has vaccination significantly drops) who have not received
now reportedly halved in east Daraa. The promotion the minimum required dosages of different vaccine
of family planning in emergencies has the potential to antigens, highlighting an increased susceptibility to
reduce child death, poverty as well as hunger (Cleland, contract and spread infections as they grow older.
2006). There needs to be greater commitment from The high single dose coverage observed in east Daraa
humanitarian organisations to actively support making reflects an artifactual immunity. Furthermore, these
these services available and free of charge, and seek rates are generally lower than those observed at
better awareness through community engagement baseline, possibly indicating the rise of a new cohort of
that ultimately leads to favourable reproductive health children who are yet to be targeted through vaccination
outcomes. These initiatives should find encouragement campaigns. These findings reinforce the need to
in the clear efficacy of family planning methods, whereby advocate for routine and catch-up campaigns targeting
pregnancies have reportedly occurred despite proper both the new cohort of children as well as older children
planning on very rare occasions, and only when the with partial immunity.
23MSF HEALTH SURVEILLANCE PROGRAMME STUDY LIMITATIONS This is a cross-sectional study that provides a snapshot of the health situation across east Daraa. Like every other cross-sectional study, there is a temporal bias that limits our ability to determine whether the outcome or the exposure came first. Due to the volatile context as well as access barriers, there are no true population figures or household listings available. Although robust standard error techniques were used, this still has implications on the precision of the estimates. The assessment was conducted in a culturally sensitive setting which limited our ability to measure certain outcomes. This was particularly true for the module of sexual and reproductive health where we failed to assess subjects such as sexual violence and unwanted pregnancies. Additionally, we failed to capture detailed diagnostic information at times because of the absence of technically trained enumerators. This was true for the mental health module where it was not possible to report information on specific illnesses. 24
EAST DARAA, SYRIA, FIRST FOLLOW-UP ASSESSMENT

CONTACT INFORMATION

MSF OCBA Middle East Unit              MSF OCBA Operational Cell 1                MSF OCBA Jordan Mission

Aitor Zabalgogeazkoa                   Khalid Ahmed, MBBS, MSc, DTM&H             Jamil Faqirzai
Head Middle East Unit                  Middle East Medical Support                Medical Coordinator
Centre for Advancement of              —                                          —
Humanitarian Medicine                  Email                                      Email
Operational Manager for Iraq, Syria,   khalid.ahmed@barcelona.msf.org             msfe-amman-medco@barcelona.
Turkey, oPt, Yemen, Jordan             Phone                                      msf.org
—                                      +962 790 397 743                           Phone
Email                                                                             +962 796 779 665
aitor.zabalgogeazkoa@msf.org
Phone
+962 795 026 331
+34 681 290 711

Moubadda Assi, MSc                     Sonia Verma
Epidemiologist for the Middle East     Operational Communications Adviser
Unit                                   (Iraq, Jordan, Syria, Palestine, Turkey)
Centre for Advancement of              —
Humanitarian Medicine                  Email
MSF Middle East Unit                   sonia.verma@barcelona.msf.org
Amman / Jordan                         Phone
—                                      +962 798 522 360
Email
moubadda.assi@barcelona.msf.org
Phone
+962 790 315 484

Ghassan Aziz, MD
HSP Programme Manager
—
Email
ghassan.aziz@barcelona.msf.org
Phone
+962 795 017 031
+964 7901 249 165

                                                                                                                25
MSF HEALTH SURVEILLANCE PROGRAMME REFERENCES Banatvala, J., Van Damme, P., & Oehen, S. (2000). Lifelong protection against hepatitis B: the role of vaccine immunogenicity in immune memory. Vaccine, 19(7), 877-885. Cernea, M. (1997). The risks and reconstruction model for resettling displaced populations. World development, 25(10), 1569-1587. Cleland, J., Bernstein, S., Ezeh, A., Faundes, A., Glasier, A., & Innis, J. (2006). Family planning: the unfinished agenda. The Lancet, 368(9549), 1810-1827. d'Arcangues, C. (2007). Worldwide use of intrauterine devices for contraception. Contraception, 75(6), S2-S7. Downey, D. B. (1995). When bigger is not better: Family size, parental resources, and children's educational performance. American sociological review, 746-761. Levy, V. (2006). Protective steering: a grounded theory study of the processes by which midwives facilitate informed choices during pregnancy. Journal of advanced nursing, 53(1), 114-122. Mowafi, H. (2011). Conflict, displacement and health in the Middle East. Global public health, 6(5), 472-487. Mrisho, M., Schellenberg, J. A., Mushi, A. K., Obrist, B., Mshinda, H., Tanner, M., & Schellenberg, D. (2007). Factors affecting home delivery in rural Tanzania. Tropical Medicine & International Health, 12(7), 862-872. Sharara, S. L., & Kanj, S. S. (2014). War and infectious diseases: challenges of the Syrian civil war. PLoS Pathogens, 10(11), e1004438. UNOCHA, 2017. Syrian Arab Republic, country profile. 26
© MSF
One of the toilets types that are being used by some households in Daraa.

MSF OCBA Middle East Unit
Centre for the Advancement of Humanitarian Medicine
Health Surveillance Programme
Building No. 12
Jordan Tower Building; 5 th Floor
Abdul Hameed Shoman Street
Al-Shemsani
Amman, Jordan
P.O. Box: 942212

MSF OCBA Headquarters
Médecins Sans Frontières/Médicos Sin Fronteras
Nou de la Rambla, 26
08001 Barcelona, Spain

Tel: +34 933 046 100
Fax: +34 933 046 102
www.msf.es
You can also read