Global health, epidemiology and genomics - Cambridge ...
←
→
Page content transcription
If your browser does not render page correctly, please read the page content below

global health, epidemiology and genomics

                      ORIGINAL RESEARCH ARTICLE

                      The long road to elimination: malaria mortality in a
                      South African population cohort over 21 years

                      P. Byass1,2*, M. A. Collinson1,2,3, C. Kabudula1, F. X. Gómez-Olivé1, R. G. Wagner1,
                      S. Ngobeni1, B. Silaule1, P. Mee1,4, M. Coetzee5, W. Twine6, S. M. Tollman1,2,3 and
                      K. Kahn1,2,3
                      1
                        MRC-Wits Rural Public Health and Health Transitions Research Unit (Agincourt), School of Public Health, Faculty of Health Sciences, University of the
                      Witwatersrand, Johannesburg, South Africa
                      2
                        Division of Epidemiology and Global Health, Department of Public Health and Clinical Medicine, Umeå Centre for Global Health Research, Umeå University,
                      Umeå, Sweden
                      3
                        INDEPTH Network, Accra, Ghana
                      4
                        Department of Global Health and Development, Faculty of Public Health and Policy, London School of Hygiene and Tropical Medicine, London, UK
                      5
                        Faculty of Health Sciences, Wits Research Institute for Malaria, University of the Witwatersrand, Johannesburg, South Africa
                      6
                        School of Animal, Plant and Environmental Sciences, University of the Witwatersrand, Johannesburg, South Africa

                      Global Health, Epidemiology and Genomics (2017), 2, e11, page 1 of 10. doi:10.1017/gheg.2017.7

                      Background Malaria elimination is on global agendas following successful transmission reductions. Nevertheless moving
                      from low to zero transmission is challenging. South Africa has an elimination target of 2018, which may or may not be rea-
                      lised in its hypoendemic areas.

                      Methods The Agincourt Health and Demographic Surveillance System has monitored population health in north-eastern
                      South Africa since 1992. Malaria deaths were analysed against individual factors, socioeconomic status, labour migration and
                      weather over a 21-year period, eliciting trends over time and associations with covariates.

                      Results Of 13 251 registered deaths over 1.58 million person-years, 1.2% were attributed to malaria. Malaria mortality
                      rates increased from 1992 to 2013, while mean daily maximum temperature rose by 1.5 °C. Travel to endemic
                      Mozambique became easier, and malaria mortality increased in higher socioeconomic groups. Overall, malaria mortality
                      was significantly associated with age, socioeconomic status, labour migration and employment, yearly rainfall and higher
                      rainfall/temperature shortly before death.

                      Conclusions Malaria persists as a small but important cause of death in this semi-rural South African population. Detailed
                      longitudinal population data were crucial for these analyses. The findings highlight practical political, socioeconomic and
                      environmental difficulties that may also be encountered elsewhere in moving from low-transmission scenarios to malaria
                      elimination.

                      Received 29 July 2016; Revised 8 February 2017; Accepted 25 April 2017

                      Key words: Climate, disease control, malaria elimination, migration, South Africa.

                      Background                                                                           over the last 60 years, but with limited success. The recently
                                                                                                           concluded Millennium Development Goal 6 aimed for
                      Various agendas towards malaria elimination (interruption of
                                                                                                           declining malaria incidence by 2015, which was achieved at
                      transmission within a defined area) have been postulated
                                                                                                           the global level, and the new Sustainable Development
                                                                                                           Goal 3 aims to end epidemic malaria by 2030. Thus, in the
                        * Address for correspondence: Prof. P. Byass, Epidemiology and Global
                                                                                                           light of encouraging progress by malaria control pro-
                      Health, Umeå University, Umeå, Sweden.                                               grammes in various settings, malaria elimination is back on
                         (Email: peter.byass@umu.se)                                                       the global agenda [1]. As with any disease elimination
                      © The Author(s) 2017. This is an Open Access article, distributed under the terms of the Creative Commons Attribution licence
                      (http://creativecommons.org/licenses/by/4.0/), which permits unrestricted re-use, distribution, and reproduction in any medium,
                      provided the original work is properly cited.
Downloaded from https://www.cambridge.org/core. IP address: 46.4.80.155, on 07 Dec 2021 at 16:29:29, subject to the Cambridge Core terms of use, available at https://www.cambridge.org/core/terms.
https://doi.org/10.1017/gheg.2017.7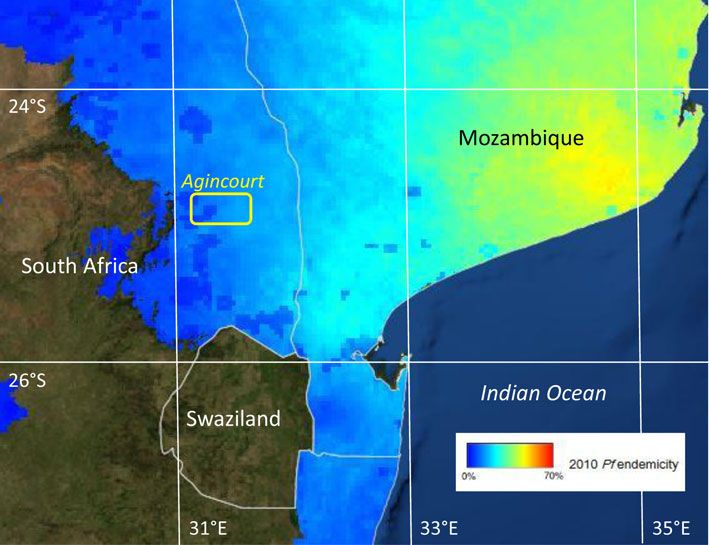
cambridge.org/gheg

                      scenario, the process becomes more difficult as cases                               This paper focuses on long-term population-based data
                      become rarer. Given the complexity of the human–mos-                            on malaria mortality from a Health and Demographic
                      quito malaria life cycle, variations in population immunity                     Surveillance System (HDSS) in the Agincourt sub-district,
                      and the role of asymptomatic or chronic infection, moving                       in north-eastern South Africa, to understand how epidemio-
                      from very low levels of malaria transmission to elimination                     logical, social and climatic factors may have influenced con-
                      is not easy [2]. Perhaps as a consequence, in the                               tinuing sporadic transmission from 1992 to 2013 [13]. The
                      context of relatively very low transmission in Southern                         location of the Agincourt site, just south of the Tropic of
                      Africa, the World Health Organization’s (WHO) 2015                              Capricorn, is shown against modelled estimates of
                      World Malaria Report notes recent increases rather than                         Plasmodium falciparum endemicity in Fig. 1. Using consist-
                      decreases in numbers of cases in Botswana, Namibia and                          ently documented mortality data and background informa-
                      South Africa [3]. Much population-based malaria research                        tion, the aim of this paper is to characterise the details of
                      rightly concentrates on higher-transmission settings, par-                      malaria mortality in the Agincourt area against a range of
                      ticularly in Africa, and consequently population-based                          potential determinants. These findings are used as a basis
                      understandings of hypoendemic malaria around the fringes                        for discussing the challenges of moving towards malaria
                      of transmission zones are less well developed [4].                              elimination in South Africa and other low-transmission
                      Additionally, insecticide resistance among mosquitoes is an                     settings.
                      increasing problem in many locations [5], and the suscepti-
                      bility of malaria transmission to climate change is an emer-
                                                                                                      Methods
                      ging consideration [6].
                         South Africa is largely malaria-free, but north-eastern                      The Agincourt HDSS was established in Bushbuckridge
                      regions bordering Mozambique and Zimbabwe, which also                           District, Mpumalanga Province, during 1992 as a means of
                      lie at lower altitudes (typically from sea level to about                       tracking population-based health and disease in a rural
                      500 m, the so-called lowveld) are known areas of seasonal                       South African population, formerly designated as a black
                      hypoendemic transmission. Malaria is recognised as a public                     homeland [13]. The HDSS area lies within South Africa’s
                      health problem, particularly during the hotter and wetter                       designated malaria endemic zone in north-eastern
                      summer season. The main malaria vectors in the region                           Mpumalanga, on the borders of Kruger National Park. All
                      are Anopheles arabiensis and Anopheles funestus [7]. There                      households in the designated area were initially documented
                      is a current national agenda for moving towards elimination                     and thereafter followed up annually. At the annual follow-up
                      by 2018, which may or may not be achievable [8]. A report                       visits, any deaths that had occurred were investigated by
                      using routinely collected health facility data from the                         means of a verbal autopsy (VA) interview. The Agincourt
                      Limpopo Province between 1998 and 2007 found that mal-                          HDSS was a founding member of the INDEPTH Network,
                      aria incidence was 1.2 per 1000 (decreasing from 1.7 to 0.5                     an umbrella organisation for many such population surveil-
                      over the period), with a case-fatality rate of 1.1%. For                        lance sites in Africa and Asia [14].
                      Limpopo’s south-eastern District of Bohlabela, which bor-                          The INDEPTH Network has reported malaria mortality
                      ders the Agincourt population studied here, the malaria                         findings relating to more than 6000 malaria deaths across
                      mortality rate for 1998–2006 was estimated at 0.02 per                          many of its constituent sites, and the methods used here
                      1000. [9] Similar data from the adjoining Mpumalanga                            are the same as those in that wider study [15]. These meth-
                      Province between 2002 and 2012 found a rather stable inci-                      ods have been shown to have high co-validity with Global
                      dence rate of 57 per 1000 specifically in Bushbuckridge                          Burden of Disease cause-specific mortality estimates, across
                      Municipality (the northern part of which includes the                           a wide range of low- and middle-income countries, including
                      Agincourt population studied in this paper), which, com-                        for malaria [16]. VA interviews are conducted by a trained
                      bined with the Province-wide case-fatality rate of 0.63%,                       field worker according to the structured format. At the
                      corresponded to a malaria mortality rate of 0.36 per 1000                       start of the Agincourt surveillance there were no widely
                      [10]. The South African National Parks authority, respon-                       adopted standard structures for VA interviews, though stan-
                      sible for the Kruger National Park which adjoins the                            dards have developed over the years, led largely by WHO
                      Agincourt sub-district and provides substantial employment                      and including input from Agincourt [17]. More recently,
                      for Agincourt residents, specifically warns visitors of the                      standardised automatic interpretation of VA interview
                      risks of contracting malaria in this region of South Africa                     material has become possible, including retrospectively,
                      [11]. Cross-border regional initiatives to control malaria                      using computer models [18, 19]. The InterVA-4 model (ver-
                      transmission and move towards elimination in the wider                          sion 4.02) has been used here to retrospectively process the
                      region included the Lubombo Spatial Development                                 Agincourt VA data consistently for the whole period 1992–
                      Initiative (LSDI) from 1999 to 2011. After LSDI ended in                        2013, thus eliminating any case-by-case subjectivity or inter-
                      2011, a resurgence in malaria burden led to the                                 observer variation [20]. InterVA-4 produces cause(s) of
                      MOSASWA malaria initiative between Mozambique, South                            death with associated likelihoods for each case, and in
                      Africa and Swaziland being launched in 2015 [12].                               these analyses all cases where the likelihood of malaria

Downloaded from https://www.cambridge.org/core. IP address: 46.4.80.155, on 07 Dec 2021 at 16:29:29, subject to the Cambridge Core terms of use, available at https://www.cambridge.org/core/terms.
https://doi.org/10.1017/gheg.2017.7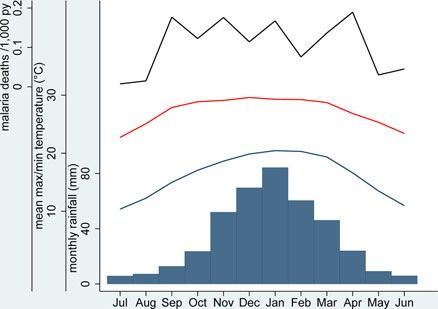
cambridge.org/gheg

                      Fig. 1. Plasmodium falciparum endemicity in southern Africa, showing the location of the Agincourt HDSS field site within the
                      P. falciparum endemic area. (P. falciparum endemicity data sourced from http://www.map.ox.ac.uk/explorer/)

                      exceeded 50% were included. The distribution of likelihood                      areas of South Africa. Socioeconomic quartiles were con-
                      among the malaria cases was skewed towards 100%, with a                         structed separately for each year to give a time-independent
                      median likelihood of 85%. The ‘low’ malaria setting was used                    measure of relative socioeconomic status. Following the
                      for the InterVA-4 model throughout to reflect the known                          change of government in 1994, travel between South
                      low levels of malaria mortality in South African endemic                        Africa and Mozambique became easier, with visa require-
                      areas [15].                                                                     ments for travel being finally dropped in 2005, though no
                          Basic population data including individual at-risk exposure                 individual data on travel to Mozambique were available
                      time (residence in the defined study area) and other relevant                    [23]. Anecdotally, however, short-term visits by Agincourt
                      population-based variables were extracted from the                              residents to Mozambique for social and commercial pur-
                      Agincourt database for the 21-year period 1 September                           poses do occur. Given the lack of individual data on this,
                      1992 to 31 August 2013. Since malaria transmission in this                      however, we were only able to compare overall malaria
                      area tends to be higher during the southern summer,                             mortality in the periods before and after the visa require-
                      around the turn of the year, the overall time period was                        ments changed. Some routine vector control measures are
                      divided into 21 one-year periods starting on 1st                                also understood to have been undertaken in the Agincourt
                      September each year, rather than using calendar years.                          area at points during the overall period, but no locally
                      Data items included age at death, date of death, household                      detailed data were available on these activities.
                      location, socioeconomic status of the household (measured                          Weather data on a daily basis for the same 21-year period
                      in 2001, 2003, 2005, 2007, 2009 and 2013, as described and                      and specifically for the Agincourt area were sourced from
                      used previously [21]), settled in Agincourt but originating                     the European Centre for Medium-Range Weather
                      (generally via earlier generations of refugees) from                            Forecasts using the ERA-Interim model [24]. Daily rainfall,
                      Mozambique [22], and being either permanently resident                          maximum temperature and minimum temperature data
                      or periodically away as a labour migrant in a particular                        were used to calculate monthly and yearly averages.
                      year. The Agincourt definition of a labour migrant is a per-                     Following a pilot study of weather measurement in the
                      son who has a household to which they belong in a surveyed                      Agincourt site in 2010 [25], it was possible to validate
                      village, but who has been absent for more than half of the 12                   ERA-Interim daily maximum and minimum temperatures
                      months preceding interview. With many employment                                against observations for that 9-day period. ERA-Interim
                      opportunities based some distance away, the majority of                         daily maximum temperatures ranged from 24.9 to 32.4 °C
                      labour migrants are absent from Mpumalanga Province for                         and minimum 18.5–21.7 °C, compared with observations
                      long periods, largely residing and working in non-endemic                       of daily maximum temperature from 24.8 to 34.0 °C and

Downloaded from https://www.cambridge.org/core. IP address: 46.4.80.155, on 07 Dec 2021 at 16:29:29, subject to the Cambridge Core terms of use, available at https://www.cambridge.org/core/terms.
https://doi.org/10.1017/gheg.2017.7
cambridge.org/gheg
minimum 18.8–22.8 °C. The mean difference in daily max- had mortality rates significantly higher than the general
imum was 1.4 °C and in minimum 0.7 °C. Since there are population.
many ways in which weather parameters might relate to Household socioeconomic status increased significantly in
malaria transmission, not necessarily implying linear rela- absolute terms over the study period, with the median value
tionships between weather and mortality [26], quartile increasing from 2.27 (95% CI 2.25–2.29) at the start to 2.77
ranges of variables were used to avoid imposing mathemat- (95% CI 2.76–2.78) by the end. Figure 4 shows quartiles of
ical assumptions on possible associations. Yearly means of socioeconomic status over time with corresponding malaria
daily maximum temperature and total rainfall were used to mortality rates. The proportions of malaria deaths below
examine long-term influences, and monthly values for the the socioeconomic median level over the different periods
month preceding malaria deaths used to examine short- were 69.8, 63.6, 42.1, 50.0 and 62.2%, respectively. Thus,
term influences. Since both age group and chronological at the start and end, malaria mortality was particularly asso-
time were included in the data, survival regression models ciated with lower socioeconomic levels, but around the time
could not be used, and accordingly Poisson regression mod- when the visa requirement for travel to Mozambique was
els were constructed to examine associations between mal- removed, malaria mortality became more widely distributed
aria mortality rate ratios and possible epidemiological, social across socioeconomic status.
and climatic determinants. Including weather data aggregated In this sub-tropical climate, it is evident from Fig. 2 that
on a monthly basis required a model separately characteris- yearly rainfall varied considerably and wetter years also
ing covariates for each person-month of exposure, leading had lower yearly mean daily maximum temperatures.
to over 22 million observation points. Stata 12 software There was much less variation in yearly mean daily minimum
was used for these analyses. Spatiotemporal analysis for temperatures. On a monthly basis, there were considerably
household clustering of malaria deaths was carried out greater variations, reflecting seasonality, although these var-
using SaTScan 9.4.1. iations were more erratic for monthly rainfall and monthly
mean daily maximum temperature than for monthly mean
daily minimum temperature. Given the evidence of associa-
Results
tions between rainfall and temperature, monthly rainfall and
A total of 165 malaria deaths were documented over 1.58 monthly mean daily maximum temperature were each clas-
million person-years observed during a 21-year period sified into quartiles over the 252 months of observation. On
from 1 September 1992 to 31 August 2013. This corre- the hypothesis that weather conditions in the preceding
sponded to a crude malaria mortality rate of 0.10 per month are likely to determine malaria deaths by influencing
1000 person-years. All-cause deaths in the same population mosquito breeding and parasite incubation, Fig. 5 shows the
numbered 13 251, and hence malaria accounted for 1.2% of joint effects of monthly rainfall and temperature on malaria
all mortality. Established diagnoses of malaria were reported mortality rates in the month, following weather observa-
as part of VA narratives for 45/165 cases (27.3%) and 62 tions. Mean malaria mortality in the green-shaded cells,
cases (37.6%) were reported to have received unspecified where either or both rainfall and temperature were in the
intravenous treatment before death. No more detailed clin- lowest quartile, was 0.056 per 1000 person-years; in the
ical information was available, although it was clear from the orange-shaded cells corresponding to the interquartile
VA narratives that a proportion of the cases died without ranges was 0.115 per 1000 person-years, and in the pink-
medical intervention, and probably would not therefore shaded cells where either rainfall or temperature were in
have been represented in facility-based statistics. the highest quartile, with neither in the lowest quartile,
Figure 2 shows malaria mortality in relation to tempera- was 0.142 per 1000 person-years.
ture and weather data. Yearly means of maximum daily tem- Table 1 shows factors associated with malaria mortality
perature rose steadily over the period, with an overall on a bivariable basis, together with a series of Poisson multi-
increase of 1.5 °C (95% CI 0.29–2.7). There were no signifi- variable regression models separately exploring basic char-
cant trends in yearly means of minimum daily temperature acteristics, risk factors and weather parameters, plus a
or total yearly rainfall over the period, although the latter final overall model. In the ‘background’ model, both age
varied widely from year to year. Malaria mortality also varied group and time period were very significantly associated
considerably from month to month and year to year. It was with malaria mortality. Age group was retained in all the
higher in the later part of the overall period, when mean models, but time period was dropped from subsequent
daily temperatures were higher and after visa requirements models so as not to hide the effects of other covariates,
for travel between South Africa and Mozambique were lifted which changed consistently over time. In the ‘risk factors’
in 2005. Figure 3 shows the same parameters as in Fig. 2, but model, higher socioeconomic status and being away for
is presented as aggregate values over the 21 malaria seasons part of the year as a labour migrant were both significantly
represented. An analysis of possible spatiotemporal cluster- protective against malaria mortality. In the period after the
ing of malaria deaths by household was carried out, but visa requirement for travel to Mozambique was abolished,
none of the clusters identified by the SaTScan software Agincourt residents who were not of Mozambican origin
Downloaded from https://www.cambridge.org/core. IP address: 46.4.80.155, on 07 Dec 2021 at 16:29:29, subject to the Cambridge Core terms of use, available at https://www.cambridge.org/core/terms.
https://doi.org/10.1017/gheg.2017.7cambridge.org/gheg
Fig. 2. Mean maximum and minimum daily temperatures (monthly and annual means), rainfall [monthly totals (bars) and monthly means
for each year] and malaria mortality rates (monthly and yearly values) for 165 malaria deaths over 1.58 million person-years at the
Agincourt HDSS, South Africa, from 1992 to 2012.
were significantly more likely to die of malaria. In the ‘wea- Discussion
ther’ model, high annual rainfall and high yearly mean max-
Clearly malaria mortality as measured at the Agincourt
imum daily temperature as well as combinations of high
HDSS increased over the 21-year period of observation,
monthly rainfall and high monthly mean daily temperature
in the month before death were all significantly associated with malaria-specific mortality rates ranging from 0.02 to
with malaria mortality. In the ‘overall’ model, most of the 0.2 per 1000 person-years, corresponding to recent
significant factors from the previous models maintained increases for malaria in South Africa as reported by the
their associations with malaria mortality. The association WHO [3]. Epidemiological factors that may have been asso-
between malaria mortality and yearly mean maximum daily ciated with this increase are of great public health import-
temperature did not retain significance in this model. ance in an era of potential malaria elimination [4]. Regional
Downloaded from https://www.cambridge.org/core. IP address: 46.4.80.155, on 07 Dec 2021 at 16:29:29, subject to the Cambridge Core terms of use, available at https://www.cambridge.org/core/terms.
https://doi.org/10.1017/gheg.2017.7cambridge.org/gheg
Fig. 5. Monthly rainfall and monthly mean daily maximum
temperature by quartiles in relation to malaria mortality in the
following month, for 165 malaria deaths in 1.58 million
person-years, over 252 months, expressed as rates per 1000
person-years. Green-shaded cells show rates where either or
Fig. 3. Maximum (red line) and minimum (blue line) daily mean both rainfall and temperature were in the lowest quartile;
temperatures, monthly rainfall (bars) and malaria mortality rates orange-shaded cells show rates for the inter-quartile ranges of
(black line), aggregated by calendar month for 165 malaria deaths rainfall and temperature, and pink-shaded cells show rates where
over 1.58 million person-years at the Agincourt HDSS, South either rainfall or temperature were in the highest quartile, with
Africa, from 1992 to 2012. neither in the lowest quartile.
programmes such as LSDI and MOSASWA may have influ- mobility after visa restrictions were eased between South
enced cross-border and autochthonous malaria transmis- Africa and Mozambique in 2005. Although we had no data
sion in the area [12]. Local epidemiological factors were on individual travel to Mozambique as a putative cause, higher
amenable to exploration using the detailed Agincourt malaria mortality was observed after visa requirements were
HDSS cohort data, even though a cohort design of this lifted. Equally, increased employment opportunities in nearby
kind cannot elucidate cause and effect. game lodges within South Africa’s endemic region may have
led to increased autochthonous cases among those with salar-
ies. In the opposite sense, labour migrants from the endemic
Individual and sociopolitical factors area, many of whom work in the mining and other commercial
South Africa has undergone rapid sociopolitical development sectors in non-endemic areas of South Africa, were consider-
in the last two decades, some aspects of which are likely to ably protected from malaria mortality. Malaria deaths
have influenced malaria transmission. This has led to changes occurred in all age groups, which is consistent with low levels
in patterns of labour migration [27] which inevitably have of immunity in the population, though malaria mortality rates
consequences for malaria control [28]. While malaria mortal- were significantly lower in the 15–64-year age group.
ity remained associated with relative poverty [29], evidence Conversely adults are possibly also more likely than children
of changing malaria mortality by socioeconomic quartiles in to travel, leading to greater exposure and acquisition of infec-
Fig. 4 may reflect associations between resources and tion elsewhere. There was no evidence in these data that the
considerable HIV/AIDS mortality epidemic, previously docu-
mented to have affected the Agincourt population and peaking
around 2006–2007 [30], gave rise to any corresponding peak
in malaria mortality, despite affecting other infectious causes
of death. There has however been a suggestion from
Mozambique that HIV co-infection can increase malaria sever-
ity and mortality [31], and anti-retroviral therapy may affect
the efficacy of lumefantrine for malaria treatment unless an
extended course is given [32]. These factors may have con-
tributed to recent increases in Agincourt malaria mortality,
given the relatively large proportion of the adult population
living with HIV. A population-based HIV prevalence study in
2010–2011 found that 19.4% of adults (15 years and over)
were living with HIV [33].
Fig. 4. Quartiles of absolute socioeconomic status by time
period. Numbers show malaria mortality rates for each Weather and climate change factors
socioeconomic quartile per 1000 person-years for 165 malaria
deaths over 1.58 million person-years at the Agincourt HDSS, Both short-term weather and longer-term climate change
South Africa, from 1992 to 2012. factors are issues of concern for malaria control. The sub-
Downloaded from https://www.cambridge.org/core. IP address: 46.4.80.155, on 07 Dec 2021 at 16:29:29, subject to the Cambridge Core terms of use, available at https://www.cambridge.org/core/terms.
https://doi.org/10.1017/gheg.2017.7https://doi.org/10.1017/gheg.2017.7
Downloaded from https://www.cambridge.org/core. IP address: 46.4.80.155, on 07 Dec 2021 at 16:29:29, subject to the Cambridge Core terms of use, available at https://www.cambridge.org/core/terms.
Table 1. Malaria mortality rate ratios (MRR) from Poisson regression models of 165 malaria deaths by background, risk factors and weather, for 165 malaria deaths over 1.58 million person-years at the Agincourt HDSS,
cambridge.org/gheg
South Africa, from 1992 to 2012
Bivariate rate ratios Background modela Risk factor modela Weather modela Overall modela
Parameter Level Malaria deaths MRR 95% CI MRR 95% CI MRR 95% CI MRR 95% CI MRR 95% CI
Sex Female 81 Ref Ref
Male 84 1.12 0.83–1.52 1.12 0.83–1.52
Age group Under 15 80 Ref Ref Ref Ref Ref
15–64 76 0.63* 0.46–0.86 0.60* 0.44–0.82 0.71* 0.51–0.98 0.61* 0.45–0.84 0.71* 0.51–0.98
65 plus 9 0.97 0.49–1.93 0.94 0.47–1.86 0.93 0.47–1.85 0.95 0.48–1.88 0.93 0.47–1.85
Period 1992–1995 7 Ref Ref
1995–1998 15 2.07 0.84–5.08 2.09 0.85–5.12
1998–2001 21 2.80* 1.19–6.58 2.85* 1.21–6.69
2001–2004 22 2.88* 1.23–6.75 2.97* 1.27–6.95
2004–2007 19 2.45* 1.03–5.83 2.56* 1.08–6.08
2007–2010 36 3.89* 1.73–8.74 4.08* 1.82–9.15
2010–2013 45 4.58* 2.06–10.2 4.83* 2.18–10.7
Socioeconomic status Q 1 – lowest 52 Ref Ref Ref
Q2 49 0.92 0.62–1.36 0.90 0.61–1.32 0.90 0.61–1.33
Q3 33 0.61* 0.39–0.95 0.59* 0.38–0.92 0.60* 0.39–0.92
Q 4 – highest 31 0.57* 0.36–0.89 0.54* 0.34–0.86 0.55* 0.35–0.87
Migration status Permanent resident 158 Ref Ref Ref
Labour migrant 7 0.31* 0.15–0.67 0.34* 0.15–0.75 0.34* 0.15–0.75
Combination of visa requirement and Visa req; non-Moz 43 Ref Ref Ref
Mozambican origin Visa req; Moz 29 1.20 0.73–1.98 0.97 0.58–1.60 0.97 0.59–1.60
Visa free; non-Moz 24 2.14* 1.47–3.14 2.28* 1.55–3.36 2.28* 1.42–3.66
Visa free; Moz 69 1.82* 1.14–2.92 1.60 0.99–2.60 1.61 0.93–2.79
Yearly rainfall Q 1 – lowest 33 Ref Ref Ref
Q2 54 1.61* 1.04–2.48 1.41 0.89–2.23 1.37 0.83–2.26
Q3 34 1.12 0.69–1.81 1.30 0.74–2.29 1.69 0.92–3.08
Q 4 – highest 44 1.38 0.88–2.17 2.21* 1.29–3.79 1.98* 1.08–3.65
Yearly mean daily maximum temperature Q 1 – lowest 26 Ref Ref Ref
Q2 39 1.39 0.85–2.28 1.60 0.91–2.53 0.98 0.55–1.73
Q3 51 1.73* 1.08–2.77 2.26* 1.29–3.96 1.38 0.70–2.74
Q 4 – highest 49 1.63* 1.01–2.62 2.43* 1.33–4.45 1.66 0.83–3.32
Preceding month’s temperature and rainfallb One/both in Q1 32 Ref Ref Ref
Inter-quartile ranges 39 2.08* 1.30–3.32 2.00* 1.25–3.21 2.21* 1.38–3.53
One/both in Q4 and neither in Q1 94 2.58* 1.73–3.85 2.53* 1.70–3.77 2.60* 1.75–3.87
*Rate ratio significantly different from unity (p < 0.05).
a
Each multivariable model is adjusted for all of the factors for which values are shown.
b
The three levels of this parameter correspond to the green, orange and pink shaded cells in Fig. 5, respectively.cambridge.org/gheg
tropical climate of the Agincourt area means that malaria Bushbuckridge Municipality to the south (0.36 per 1000)
transmission is regulated both by rainfall and temperature [9] is very plausible. Since it is unlikely that a consistent
over various seasons, which was the rationale for the com- and systematic clinical population-based follow-up specific-
bined presentation of these factors in Fig. 5. Generally there ally for malaria deaths could have been justified over a
was lower malaria mortality in months following dry and/or 21-year period in a setting where malaria is a relatively
cold months, and weather emerged as a major overall deter- rare disease, applying consistent VA surveillance methods
minant of malaria mortality. Equally, it has to be recognised to data spanning a generation was a considerable strength
that malaria infections imported from outside the area will of this study, enabling robust observations of malaria mortal-
not necessarily have been subject to the same meteoro- ity trends in this population. It was however impossible to
logical factors. make any systematic assessment of whether individual mal-
However, there was also a steady overall trend towards aria deaths were associated with autochthonous or travel-
higher temperatures over the 21-year period, and if this related transmission, though some cases were anecdotally
continues it could contribute to significant future increases reported not to have travelled outside South Africa. In the
in malaria. From these data, it is not possible to say unam- absence of data in this population on malaria infection
biguously that the overall temperature trend was respon- rates, it is also possible that the observed increase in malaria
sible for increasing malaria mortality, though it may have mortality over time reflects an overall reduction in infection
been a contributory factor. Some models predict that cli- and consequently in acquired immunity, making the disease
mate change could considerably increase malaria transmis- increasingly dangerous.
sion potential in southern Africa in coming decades [34].
It is also possible that low malaria transmission patterns in
Implications for malaria elimination programmes
relatively non-immune populations are particularly sensitive
in South Africa and elsewhere
to variations in weather [35].
The WHO manual for malaria elimination [36] does not set
specific epidemiological criteria differentiating between malaria
Methodological strengths and weaknesses
control and elimination settings, and the epidemiological quan-
Compared with many studies of malaria mortality, the meth- tification of declining malaria is complex [37]. However, our
ods used here have distinct strengths and weaknesses. This findings here suggest that South Africa is still some way from
longitudinal dataset derived from the application of standard achieving elimination in the relatively small areas of the country
methods over a 21-year period within a defined population continuing to experience transmission. Although there was
area offers a unique opportunity to track developments in reasonable optimism in 2012 [38], recent developments,
malaria mortality. All deaths in the Agincourt HDSS popula- reflected both in these results and the 2015 WHO World
tion are routinely followed up and causes of death attributed Malaria Report [3], suggest that there is still some way to go.
using standard VA techniques, so there is no bias arising Our findings that malaria mortality has increased over two
from deliberately seeking out malaria deaths. Similarly decades, in an area that might have contemplated embarking
there is no health-seeking bias involved, unlike data originat- on elimination activities in the early 1990s, are a matter for
ing from passive case detection at health facilities, which may concern, notwithstanding sociopolitical and climatic factors
underestimate asymptomatic cases or miss cases seeking that may have contributed to the changes [39]. For other
testing and treatment at private pharmacies. This is import- African settings, as countries increasingly achieve control
ant in a low-transmission setting like Agincourt where indi- and contemplate elimination, it is likely that the road to elim-
vidual immunity to malaria is generally low and malaria ination will not be smooth. If pre-elimination and elimination
infections can rapidly lead to fatal consequences, possibly phases span decades, earlier population immunity will dwindle
before treatment is sought. Anecdotally from the VA narra- and case-fatality may increase, among other factors.
tives, a proportion of cases did not seek any treatment. The Understanding the prospects for elimination therefore
weakness of the VA approach for documenting malaria requires a long-term view of local malaria epidemiology [40].
deaths is that there can be no supporting parasitological Countries sharing borders with areas of higher transmis-
or other biomedical evidence, and hence it is not possible sion, as seen in this study, present special problems.
to derive parasite rates or case-fatality rates. Although the Modelling suggests that malaria interventions at borders
InterVA-4 model has been shown across a wide range of set- are likely to be necessary [41]. Although local flights from
tings to deliver evidence of malaria mortality consistent with Mozambique to South Africa may well undergo routine dis-
findings from the Malaria Atlas Project, WHO and the insection as provided for in the WHO International Health
Global Burden of Disease Study [15, 16], VA is usually not Regulations [42], the same procedures are not routinely
regarded as the method of choice for documenting malaria applied to ground transportation, which may comprise the
mortality. However, the malaria mortality rate of 0.10 per bulk of traffic, and potentially convey infective vectors.
1000 measured here for Agincourt, on the borders between Effective trans-national collaboration is likely to be a key
Bohlabela District to the north (0.02 per 1000) [8] and to success [43].
Downloaded from https://www.cambridge.org/core. IP address: 46.4.80.155, on 07 Dec 2021 at 16:29:29, subject to the Cambridge Core terms of use, available at https://www.cambridge.org/core/terms.
https://doi.org/10.1017/gheg.2017.7cambridge.org/gheg
Conclusions Data availability
Malaria, even in the low transmission setting of Agincourt, Population-based data from the Agincourt HDSS are rou-
has persisted as a seemingly intractable public health prob- tinely archived for public access in the INDEPTH data
lem over the last two decades and mortality shows no repository, http://www.indepth-ishare.org/index.php/home
sign of decreasing. Having consistent individual HDSS data
collected over more than two decades was essential for
undertaking these analyses. A number of sociopolitical fac- Author contributions
tors as well as weather and longer-term climate appear to
be associated with malaria mortality levels, implying that PB conceived and designed the paper and was mainly
there can be no single strategy for achieving better control responsible for analyses and drafting. SMT, KK, MAC,
and possible elimination. These findings will be important FXGO and RGW were scientific leaders at various stages
for other settings, which manage to reduce malaria cases of the 21-year period covered. CK and PM were responsible
and deaths to low levels, but then encounter difficulties in for data management and curation. SN and BS oversaw ver-
making further progress towards eliminating transmission. bal autopsy work. MC and WT provided specific scientific
It is clear that political, economic and climatic considerations expertise. All authors were involved in reviewing and revis-
will have to be successfully mitigated and managed during ing the manuscript and approving the final version.
the coming years, alongside the provision of excellent health
services, if the global Sustainable Development Target of
eliminating malaria by 2030 is to be met. References
1. Tanner M, et al. Malaria eradication and elimination: views
Acknowledgements on how to translate a vision into reality. BMC Medicine 2015;
13: 167.
Key funding partners of the MRC/Wits Rural Public Health 2. Lindblade KA, et al. The silent threat: asymptomatic
and Health Transitions Research Unit which runs the parasitemia and malaria transmission. Expert Review of
ongoing Agincourt Health and Socio-demographic Anti-infective Therapy 2013; 11: 623–639.
Surveillance System are: the Wellcome Trust, UK (grant 3. World Health Organization. World Malaria Report 2015.
numbers 058893/Z/99/A, 069683/Z/02/Z and 085477/Z/ Geneva; WHO 2015. (http://apps.who.int/iris/bitstream/
10665/200018/1/9789241565158_eng.pdf).
08/Z); the Medical Research Council, University of the
4. Snow RW. Global malaria eradication and the importance of
Witwatersrand, and Anglo-American Chairman’s Fund,
Plasmodium falciparum epidemiology in Africa. BMC Medicine
South Africa; the William and Flora Hewlett Foundation
2015; 13: 23.
(grant number 2008-1840), the Andrew W. Mellon 5. Knox TB, et al. An online tool for mapping insecticide
Foundation, and the National Institute on Aging (NIA) of resistance in major Anopheles vectors of human malaria
the National Institutes of Health (NIH), USA (grant numbers parasites and review of resistance status for the Afrotropical
1R24AG032112-01 and 5R24AG032112-03). PB’s work in region. Parasites and Vectors 2014; 7: 76.
Agincourt was supported by the European Community 6. Watts N, et al. Health and climate change: policy responses
Marie Curie Actions IPHTRE project (no. 295168). to protect public health. Lancet 2015; 386: 1861–914.
7. Sinka ME, et al. A global map of dominant malaria vectors.
Parasites and Vectors 2012; 5: 69.
Declaration of interests 8. Roll Back Malaria Partnership. Progress and Impact Series
– Focus on South Africa. RBM Partnership Country Reports no
None. 8, October 2013. (http://www.rollbackmalaria.org/microsites/
ProgressImpactSeries/docs/report16-South-Africa.pdf).
9. Gerritsen AAM, et al. Malaria incidence in Limpopo Province,
Ethical approval
South Africa, 1998–2007. Malaria Journal 2008; 7: 162.
The Agincourt HDSS was reviewed and approved by the 10. Silal SP, et al. Exploring the seasonality of reported treated
Committee for Research on Human Subjects (Medical) of malaria cases in Mpumulanga, South Africa. PLoS ONE 2013; 8:
the University of the Witwatersrand (protocol M960720 e76640.
11. South African National Parks. Kruger National Park: Malaria.
and M081145). Community consent from civic and trad-
(https://www.sanparks.org/parks/kruger/tourism/malaria.php).
itional leadership was secured at the start of surveillance
12. Moonasar D, et al. Towards malaria elimination in the
in 1992 and is reaffirmed from time to time, and informed MOSASWA (Mozambique, South Africa and Swaziland)
verbal consent is obtained at individual and household region. Malaria Journal 2016; 15: 419.
level at each annual follow-up visit. A record is kept of the 13. Kahn K, et al. Profile: Agincourt health and
household respondent who consented to be interviewed socio-demographic surveillance system. International Journal of
as well as the responsible fieldworker. Epidemiology 2012; 41: 988–1001.
Downloaded from https://www.cambridge.org/core. IP address: 46.4.80.155, on 07 Dec 2021 at 16:29:29, subject to the Cambridge Core terms of use, available at https://www.cambridge.org/core/terms.
https://doi.org/10.1017/gheg.2017.7cambridge.org/gheg
14. Sankoh O, Byass P. The INDEPTH Network: filling vital 29. Worrall E, Basu S, Hanson K. Is malaria a disease of
gaps in global epidemiology. International Journal of poverty? A review of the literature. Tropical Medicine and
Epidemiology 2012; 41: 579–588. International Health 2005; 10: 1047–1059.
15. Streatfield PK, et al. Malaria mortality in Africa and Asia: 30. Kabudula CW, et al. Two decades of mortality change in
evidence from INDEPTH Health and Demographic rural northeast South Africa. Global Health Action 2014; 7:
Surveillance System sites. Global Health Action 2014; 7: 25369. 25596.
16. Byass P. Cause-specific mortality findings from the Global 31. Berg A, et al. Increased severity and mortality in adults
Burden of Disease project and the INDEPTH Network. Lancet co-infected with malaria and HIV in Maputo, Mozambique: a
Global Health 2016; 4: e785–e786. prospective cross-sectional study. PLoS ONE 2014; 9:
17. Leitao J, et al. Revising the WHO verbal autopsy instrument e0088257.
to facilitate routine cause-of-death monitoring. Global Health 32. Maganda BA, et al. The influence of nevirapine and
Action 2013; 6: 21518. efavirenz-based anti-retroviral therapy on the
18. Desai N, et al. Performance of four computer-coded verbal pharmacokinetics of lumefantrine and anti-malaria dose
autopsy methods for cause of death assignment compared recommendation in HIV-malaria co-treatment. Malaria Journal
with physician coding on 24,000 deaths in low-and 2015; 14: 179.
middle-income countries. BMC Medicine 2014; 12: 20. 33. Gómez-Olivé FX, et al. Prevalence of HIV among those 15
19. Byass P, et al. Comparing verbal autopsy cause of death and older in rural South Africa. AIDS Care 2013; 25: 1122–1128.
findings as determined by physician coding and probabilistic 34. Ryan SJ, et al. Mapping physiological suitability limits for
modelling: a public health analysis of 54 000 deaths in Africa malaria in Africa under climate change. Vector-Borne and
and Asia. Journal of Global Health 2015; 5: 010402. Zoonotic Diseases 2015; 15: 718–725.
20. Byass P, et al. Strengthening standardised interpretation of 35. Laneri K, et al. Dynamical malaria models reveal how
verbal autopsy data: the new InterVA-4 tool. Global Health immunity buffers effect of climate variability. Proceedings of the
Action 2012; 5: 19281. National Academy of Sciences of the United States of America,
21. Houle B, et al. Household context and child mortality in Proc Natl Acad Sci USA, 2015; 112: 8786–8791.
rural South Africa: the effects of birth spacing, shared 36. World Health Organization. Disease Surveillance for
mortality, household composition and socio-economic status. Malaria Elimination: an Operational Manual. Geneva: WHO,
International Journal of Epidemiology 2013; 42: 1444–54. 2012. (http://apps.who.int/iris/bitstream/10665/44852/1/
22. Ngwato TP. Together apart: Migration, integration and 9789241503334_eng.pdf).
spatialised identities in South African border villages. Geoforum 37. Hay SI, Smith DL, Snow RW. Measuring malaria
2012; 43: 561–572. endemicity from intense to interrupted transmission. Lancet
23. Brand South Africa. SA, Mozambique waive visas. (http:// Infectious Diseases 2008; 8: 369–378.
www.southafrica.info/travel/documents/moz-130405.htm). 38. Maharaj R, et al. The feasibility of malaria elimination in
24. Dee DP, et al. The ERA-Interim reanalysis: configuration and South Africa. Malaria Journal 2012; 11: 423.
performance of the data assimilation system. Quarterly Journal 39. Silal SP, et al. Towards malaria elimination in Mpumalanga,
of the Royal Meteorological Society 2011; 137: 553–597. South Africa: a population-level mathematical modelling
25. Byass P, et al. Assessing a population’s exposure to heat and approach. Malaria Journal 2014; 13: 297.
humidity: an empirical approach. Global Health Action 2010; 3: 40. Snow RW, et al. Changing malaria prevalence on the kenyan
5421. coast since 1974: climate, drugs and vector control. PLoS ONE
26. Craig MH, et al. Exploring 30 years of malaria case data in 2015; 10: e0128792.
KwaZulu-Natal, South Africa: Part I. The impact of climatic 41. Silal SP, et al. Predicting the impact of border control on
factors. Tropical Medicine and International Health 2004; 9: malaria transmission a simulated focal screen and treat
1247–1257. campaign. Malaria Journal 2015; 14: 268.
27. Collinson MA, et al. Migration and the epidemiological 42. World Health Organization. International Health
transition: insights from the Agincourt sub-district of Regulations (2005). Geneva: WHO, 2008. (http://whqlibdoc.
northeast South Africa. Global Health Action 2014; 7: 23514. who.int/publications/2008/9789241580410_eng.pdf).
28. Silal SP, et al. Hitting a moving target: a model for malaria 43. Sharp BL, et al. Seven years of regional malaria control
elimination in the presence of population movement. PLoS collaboration – Mozambique, South Africa and Swaziland.
ONE 2015; 10: e0144990. American Journal of Tropical Medicine and Hygiene 2007; 76: 42–47.
Downloaded from https://www.cambridge.org/core. IP address: 46.4.80.155, on 07 Dec 2021 at 16:29:29, subject to the Cambridge Core terms of use, available at https://www.cambridge.org/core/terms.
https://doi.org/10.1017/gheg.2017.7You can also read