Ecological assessment of the South Australian Sardine Fishery - Reassessment report prepared for the Department of Agriculture, Water and the ...
←
→
Page content transcription
If your browser does not render page correctly, please read the page content below
Ecological assessment
Not foun d

of the South Australian
Sardine Fishery
Reassessment report prepared for the
Department of Agriculture, Water and the
Environment
Department of Primary Industries and Regions
Fisheries and Aquaculture

June 2021

Ecological assessment of the South Australian Sardine Fishery -
Reassessment report prepared for the Department of Agriculture,
Water and the Environment.

Information current as of April 2021
© Government of South Australia 2021

DISCLAIMER
PIRSA and its employees do not warrant or make any representation regarding the use, or
results of the use, of the information contained herein as regards to its correctness,
accuracy, reliability and currency or otherwise. PIRSA and its employees expressly
disclaim all liability or responsibility to any person using the information or advice.

ALL ENQUIRIES :
Annabel Jones
Department of Primary Industries and Regions (PIRSA)
2 Hamra Ave, West Beach
GPO Box 1671, Adelaide SA 5001
T: (08) 8429 0165
E: Annabel.jones@sa.gov.au

                                         -2-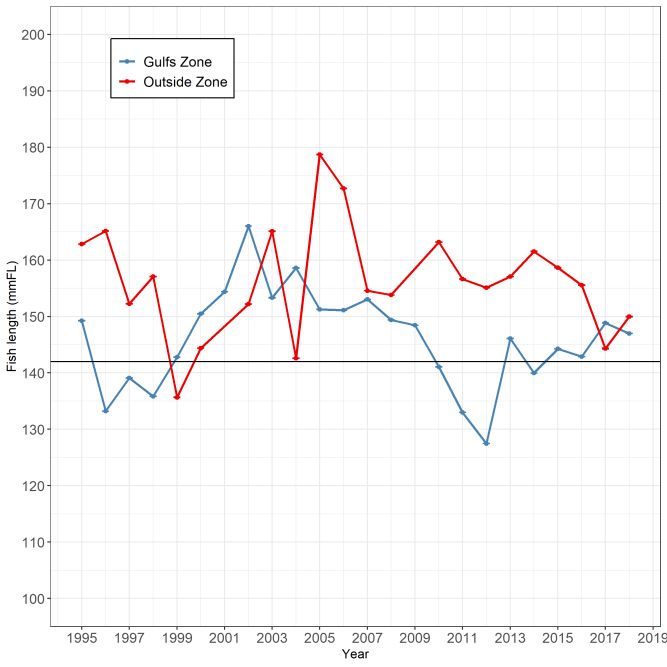
Purpose
The purpose of this report is to provide an assessment of the commercial South Australian
Sardine Fishery (SASF) for the purposes of Part 13 and 13(A) under the Environment
Protection and Biodiversity Conservation Act 1999 (EPBC Act). This report updates
information provided to the then Australian Government Department of the Environment
(DotE)) (now known as the Department of Agriculture, Water and the Environment).

The report has been prepared by the Fisheries and Aquaculture Division of the
Department of Primary Industries and Regions (PIRSA) in accordance with the Guidelines
for the Ecologically Sustainable Management of Fisheries 2nd Edition, particularly
addressing the level of change that has occurred since the last assessment report.

Level of assessment
The SASF was assessed as an approved Wildlife Trade Operation in 2018. Since the last
assessment, there have been changes in some areas of interest or particular issues as
outlined in the Guidelines for the Ecologically Sustainable Management of Fisheries.
These have been reported in the annual fishery reports to DAWE.

Table 1: Level of assessment required by South Australian MSF

  Issue                      Area of Interest                                     Yes No
                             Has there been any change to management
  Fishery                                                                                X
                             arrangements, and/ or fishing practices?
                             Has there been any change to an environmental
  External Influences        issue/influence outside of the fishery management           X
                             agencies control?
  Interaction with           Has there been any change in the nature, scale,
                                                                                  X
  protected species          intensity of impact, and/or management response?
                             Has there been any change in the nature, scale or
  Ecosystem impact           intensity of impact, and/or subsequent management           X
                             response?
                             Has there been any change in the target stock
  Target Stock Status                                                                    X
                             status?
  By-product/ bycatch        Has there been any change in the by-product and/or
                                                                                         X
  status.                    bycatch stock status?

Considering the above, the level of submission requirement for the SASF is ‘Standard’.

                                                       -3-
Background
The regulations that govern the management of the SASF under the Fisheries
Management Act 2007 are the Fisheries Management (Marine Scalefish Fisheries)
Regulations 2017, the Fisheries Management (General) Regulations 2017, the Fisheries
Management (Vessel Monitoring Scheme) Regulations 2017, the Fisheries Management
(Demerit Points) Regulations 2017 and the Fisheries Management (Fish Processors)
Regulations 2017.
At present the regulations for the SASF are incorporated within the Fisheries Management
(Marine Scalefish Fisheries) Regulations 2017. It is intended that new regulations
specifically for the SASF will take effect on 1 July 2021. The management arrangements
for the SASF will remain the same under the new regulations.
The first Management Plan - A Management Plan for the Experimental Pilchard Fishery -
(Mackie 1995) now known as SASF, was first established under the Fisheries Act 1982 to
provide the policy framework to guide management decision-making for the fishery. This
management plan was replaced in 2005 with the Management Plan for the South
Australian Pilchard Fishery (Shanks 2005). In 2007 an addendum to the 2005 plan was
released to update the harvest strategy. A new management plan for the SASF was
developed and released in late 2014. These management plans provide a reference for
the broader community in relation to the management measures introduced to ensure the
long-term sustainability of South Australia’s sardine resources.
The Management Plan for the South Australian Commercial Marine Scalefish Fishery; Part
B – Management arrangements for the taking of sardines, was adopted in 2014 and
applies for a period of 10 years. Consistent with the Fisheries Management Act 2007 a
comprehensive review of this management plan for the purpose of determining whether
the plan should be amended, replaced or reinstated without amendment, is currently being
undertaken.
The 2014 Management Plan for the South Australian Commercial Marine Scalefish
Fishery; Part B – Management arrangements for the taking of sardines, and other SASF
documents can be found at:
https://www.pir.sa.gov.au/fishing/commercial_fishing/fisheries/sardine_fishery
Fishery
The SASF targets Australian Sardine (Sardinops sagax) using a sardine net, however,
Australian Anchovy (Engraulis australis), Maray (Clupea sagax), Sandy Sprat
(Hyperlophus vittatus) and Blue Sprat (Spratelloides robustus) are also permitted to be
taken.
The area of the fishery includes all the waters adjacent to South Australia to the edge of
the 200 nautical mile Australian Fishing Zone, with the exception of closed areas. The
legislative instrument defining the area of jurisdiction for the sardine fishery is the 1996
Offshore Constitutional Settlement arrangements for scalefish species between South
-4-Australia and the Commonwealth of Australia. The agreement sets out that sardines are
managed by South Australia while the Commonwealth has retained access to sardines for
live bait purposes in the Southern Bluefin Tuna Fishery.
The Total Allowable Commercial Catch (TACC) was set at 1,000 t in 1992 (calendar year)
and increased to 3,500 t during 1993-1997. In 1998, the TACC was set at 12,500 t, but
this was reduced to 3,500 t and 3,800 t in 1999 and 2000, respectively, after the mass
mortality event in late 1998. The stock recovered rapidly and the TACC increased to
51,100 t in 2005 and was reduced to 25,500 in 2006. From 2007 to 2009, the TACC was
set at 30,000 t. During 2010 to 2014, the TACC was set at 34,000 t. In 2015 and 2016, the
TACC was 38,000 t. The TACC for 2017, 2018, 2019 and 2020 has been set at 42,750 t
(Figure 1).
Total catches of Sardines have been around the level of the TACCs set over most years
(Figure 2).
60
Outside zone
Gulf zone
50
40
TACC (x 000 t)
30
20
10
0
1995 2000 2005 2010 2015 2020
Year
Figure 0: Total Allowable Commercial Catch (TACC) for the South Australian Sardine Fishery (SASF) between 1991 and
2019 for Gulfs Zone and Outside Zone (Ward et al 2020).
Figure 2: Recorded catches by year for the Catch Disposal Record and research logbook (Ward et al 2020).
From 2010, onwards, there has been a cap on the catch taken from Spencer Gulf, with a
maximum of 30,000 t permitted to be taken in Spencer Gulf. This restriction has been
-5-applied to prevent localised depletion in the area of southern Spencer Gulf where a large
proportion of the catch has historically been taken from.
In 2018 the fishery was accredited under the Marine Stewardship Council (MSC)
certification scheme against the MSC Fisheries Standard used to assess if a fishery is
well-managed and sustainable. MSC certification for the fishery is for a five-year period.
The MSC assessment documents and subsequent audits can be located on the MSC
website at https://fisheries.msc.org/en/fisheries/south-australia-sardine-fishery.
In July 2020 the TACCs for the 2020 quota period for both the Gulf Zone and Outside
Zone were increased by 5,400 t and 3,150 t, respectively. The increases in the TACCs
were provided to ensure Sardine feed was available for ranched Southern Bluefin Tuna in
Port Lincoln, as the impact of COVID-19 prevented imported feed from being sourced
(usually between 5,000 t and 8,000 t per season) and the late arrival of the Japanese
freezer vessels meant ranched tuna needed to be fed for longer in 2020. The decision to
increase the TACCs in the fishery in 2020 was supported by scientific advice from the
South Australian Research and Development Institute (SARDI). This advice stated that
due to the strong status of the Southern Stock of Australian Sardine the sustainability risks
of allowing up to 20% of the TACC to be moved between the 2020 and 2021 seasons was
low.
The 2021 TACC was subsequently reduced by an amount equal to the second 2020 quota
allocation to mitigate the risk of an increasing harvest over the two years (2020 and 2021
quota periods) above the TACC recommended by the harvest strategy.
As a further COVID-19 mitigation measure, amendments were made to the Fisheries
Management (Marine Scalefish Fishery) Regulations 2017 in 2020 to allow for uncaught
quota entitlements on licences from the 2020 quota period be carried over to the 2021
quota period. Under these arrangements 9953 t of quota that remained uncaught on
licences in the 2020 quota period were carried over to the 2021 quota period.
Commercial Fishery
A time series of economic information in relation to the Sardine Fishery has been collected
since 1997-98 and is presented in reports titled Economic Indicators for the SASF. The
most recent report at the time of making this management plan relates to 2018-19
(Econsearch, 2020), which can be found at:
https://www.bdo.com.au/en-au/econsearch/safisheriesreports
The total commercial catch of Sardines in the SASF 2018/19 was 40,041 t, valued at
almost $26.4 million. The SASF was responsible for the employment of around 189 full-
time equivalent (fte) jobs through direct employment and jobs in flow-on businesses
(Econsearch, 2020).
The commercial fishery is managed through setting of a TACC and input controls aimed at
matching harvesting capacity with resource availability (Table 2).
-6-Table 2: Management arrangements and monitoring tools for the sardine fishery for the 2021 fishing season.
Management tool Current restriction
Permitted species Australian Sardine (Sardinops Sagax)
Australian Anchovy (Engraulis australis)
Maray (Clupea sagax)
Sandy Sprat (Hyperlophus vittatus)
Blue Sprat (Spratelloides robustus)
Quota year 1 January – 31 December
Licensing year 1 July – 30 June
Limited entry 14 licences
Licence transferability Permitted
Corporate ownership Permitted
Closed areas Yes
Method of capture Purse seine
Quota scheme (ITQ) Yes
TACC (2021) 42,750 tonnes (Gulfs Zone: 30,000 t, Outside Zone
12,750 t)
Quota transferability (permanent Yes
and temporary)
Maximum number of boats 2 per licence
Total number of nets 2 per licence
Maximum vessel length None
Maximum vessel power None
Vessel monitoring system (VMS) Operational vessel monitoring system units required on
all vessels while fishing with a sardine net.
Monitoring tool Requirement
Catch and effort data Daily logbook submitted monthly
Catch disposal records Daily records submitted upon landing
Prior landing reports 1 hour before unloading to registered premises
2 hours before unloading to a boat
The annual TACC for the fishery is determined through the application of the harvest
strategy in the management plan for the fishery. This harvest strategy includes a set of
decision rules that determine the level of exploitation based on an annual research
monitoring program.
Harvest Strategy
Consistent with the National Guidelines to Develop Fishery Harvest Strategies (Sloan et al.
2014), the Sardine Fishery Harvest Strategy is defined as a framework that sets out the
management actions necessary, using fixed exploitation rates and maintaining biomass
above agreed levels, to control the exploitation of sardines in order to achieve ecological,
economic and social objectives of the fishery.
The current harvest strategy is described in the 2014 management plan for the SASF. The
harvest strategy identifies a primary performance indicator as the sardine spawning
biomass (SpB) using the daily egg production method (DEPM) (Lasker 1985). The DEPM
is recognised internationally as being a practical and cost-effective method for estimating
the SpB of small pelagic fishes (Stratoudakis et al. 2006, Ward et al. 2011).
Using the most recent SpB value, the recommended TACC for the sardine fishery is
determined as a proportion of the SpB (exploitation rate) within sustainable limits. Although
-7-SpB estimates derived from the DEPM are considered to be accurate, they can be
relatively imprecise, mainly due to uncertainties associated with estimation of total daily
egg production (Fletcher et al. 1996, McGarvey & Kinloch 2001, Ward et al. 2001b,
Gaughan et al. 2004, Stratoudakis et al. 2006). Despite concerns regarding the precision
of DEPM-derived SpB estimates, the DEPM is currently considered the best technique
available to assess the status of the sardine fishery. Imprecision of the DEPM is partly
addressed in the current harvest strategy by establishing a conservative baseline TACC
over a relatively wide SpB target range.
Supporting the DEPM assessment is a recently developed age-structured population
model for the SASF. This model is also used to inform the status of the stock by producing
SpB estimates but uncertainty regarding natural mortality rates, recruitment variability and
biases in the age samples mean the DEPM-derived SpB estimate is preferred (Ward et al.
2005). In years when there is no DEPM survey completed, the stock assessment model
results are used to inform the status of the stock. This age-structured model revealed that
DEPM-derived SpB estimates are likely to be conservative relative to the actual SpB
(Ward et al. 2010a).
The current harvest strategy established that a precautionary baseline TACC of 30,000
tonnes be maintained while the latest SpB estimate remained between 150,000 and
300,000 tonnes, corresponding to exploitation rates of 20% and 10%, respectively. The
harvest strategy allows for increased exploitation rates (and TACCs) as the level of
understanding of the sardine stock improves by increasing the frequency of surveys and
stock assessments in three tier levels. The required monitoring for each of the three tier
levels is:
Tier 3 - biennial stock assessment and biennial fishery survey (alternating each year)
Tier 2 - biennial stock assessment and an annual fishery survey
Tier 1 - annual stock assessment and annual fishery survey.
Once the SpB estimate has been calculated and stock status assigned, the corresponding
harvest decision rules that guide the appropriate levels of exploitation (and therefore the
TACC) across the three tiers can be considered.
The decision rules are provided in the harvest decision table, which outlines the
relationship between SpB, stock status, level of exploitation and TACC recommendations
is in Table 2, including the frequency of fishery surveys and assessments.
-8-Table 3: Harvest decision table for the sardine harvest strategy to guide levels of exploitation (and TACC) and frequency of surveys and assessment for each tier following the most recent spawning
biomass (SpB) estimate. Abbreviations: TRP, target reference point; LRP, limit reference point
-9-Ecosystem and trophic impacts from possible depletion of adult sardines in southern
Spencer Gulf catches were first raised as concerns in 2004 and 2005 (Goldsworthy et
al. 2011). Sardine size decreased from 2002 to 2012 in Spencer Gulf and Gulf St
Vincent (termed the ‘Gulf’ zones), however then increased substantially in 2013 (Figure
3). It is unclear whether this reduction in fish size was attributed to reduced growth rates
resulting from adverse environmental conditions, changes in size-based distribution or
movement patterns or the concentration of fishing effort in Spencer Gulf, or a
combination of factors.
Figure 3. Average fork length (mm FL) by year for commercial samples from the three regions of the SASF, error bars
are standard error. Horizontal line indicates the reference point for maximum catch limit for the Gulfs Zone of 142 mm
FL.
Sardine size as a proxy for the abundance of adult-sized sardines is considered the
most practical option for monitoring changes in sardine size, with the least social and
economic impact, to address the issue during the harvest strategy development in
collaboration with industry.
The harvest strategy defines two zones in the sardine fishery for the purposes of spatial
management decision rules; the Gulfs Zone (GZ) and the Outside Zone (OZ),
• Gulfs Zone (GZ) means the waters east Cape Carnot, Eyre Peninsula and north
of latitude 35°52’00”S (extending to Kangaroo Island, in the vicinity of Vennachar
Point). Then north of a line between Penneshaw, Kangaroo Island and Cape
Jervis, Fleurieu Peninsula; enclosing the gulf waters.
• Outside Zone (OZ) means the South Australian waters excluding the GZ.
Once the fishery TACC has been determined, the maximum catch to come from the GZ
will be determined on the basis of the mean size of the catch from the GZ to prevent the
-1-depletion of target size fish and maximise catches of optimal size sardines from the GZ.
Under this spatial management framework no more than 30,000 tonnes of sardines are
taken from the gulfs in any single quota period (fishing season). Furthermore, where
there is evidence of reductions in the mean size of fish taken from the GZ the maximum
catch in the GZ will be reduced (i.e. to 27,000 or 24,000 tonnes depending on the mean
size of fish taken in the previous quota period).
Table 4: Catch allocation decision table for the sardine harvest strategy to guide the maximum catch allowed from the
GZ.
Mean Size of Sardines in GZ Maximum Catch
(MSS) Limits for GZ
142 mm < MSS 30,000 tonnes
135 mm < MSS ≤ 142 mm 27,000 tonnes
MSS ≤ 135 mm 24,000 tonnes
The reference point at which the TACC in the GZ is reduced from 30,000 to 27,000
tonnes is the point at which 50% of males and female sardines will be sexually mature
(Ward et al. 2010a). The reference point at which the GZ TACC is reduced from 27,000
tonnes to 24,000 tonnes is considered a conservative lower level as below this size the
numbers of fish that would be harvested would be substantially reduced.
Target Stock Status
Under the criteria outlined in the harvest strategy for the SASF (PIRSA 2014), the
Southern Stock of Australian Sardine in 2020 is classified as Sustainable. The estimate
of spawning biomass obtained using the DEPM in 2020 was 378,923
(318,777– 439,068) tonnes, which is the highest on record (1995-2020) and above the
upper target reference point of 190,000 t in the Management Plan (Ward et al. 2019).
The model estimate of spawning biomass for 2020 of 378,923 t was also above the
target reference point. The exploitation rate for spawning biomass was approximately
13%, which is below the maximum rate at Tier 2 of 22.5% identified in the Management
Plan. These findings are consistent with other recent assessments of the status of the
Southern Stock of Sardine which classified the stock as sustainable (e.g. Ward et al.
2017; Stewardson et al. 2018).
The strongest single piece of empirical evidence indicating that the Southern Stock of
Sardine should be classified as sustainable is that the spawning area recorded during
the 2020 survey was 75,678 km2, which is the largest on record. It is widely recognised
that spawning area is strongly correlated with the size of the spawning stock of Sardine
(e.g. Mangel and Smith 1990, Gaughan et al. 2004). The 2020 DEPM report from
SARDI suggests variations in estimates of spawning biomass are driven primarily by
fluctuations in the spawning area (Ward et al. 2020).
-2-The population modelling undertaken in the biennial SARDI Stock Assessment report,
which is a requirement under Tier 2 within the harvest strategy, also shows that the
population estimates are consistent with the historical DEPM estimates of spawning
biomass (e.g. Ward et al. 2017; Stewardson et al. 2018) (Table 2). The estimate of
spawning biomass from the integrated population model in 2019 (239,000 t) is above
both the target reference point of 150,000 t and the upper reference point of 190,000 t
identified in the management plan.
Table 5: Research information and TACCs over the period 2016 to 2019 (Source: Ward et al. 2019).
Statistic 2019 2018 2017 2016
TACC 42,750 t 42,750 t 42,750 t 38,000 t
Spawning Biomass (DEPM) 233,600 t 275,600 t 289,700 t 220,400 t
Spawning Biomass (Model) 238,550 t 260,180 t 262,590 t 251,200 t
Status Sustainable Sustainable Sustainable Sustainable
Interaction with Protected Species
Interactions between common dolphins and the SASF occur when dolphins feeding on
schools of sardines are encircled or become entangled in the purse-seine nets. Such
interactions can result in catch loss to the fishers as they try to release the dolphins, and
harm to the dolphins (Hamer et al. 2008). Dolphin mortalities are generally caused by
stress, drowning or crushing following entanglement in the net. An initial observer
program undertaken by SARDI, between November 2004 and June 2005, estimated
1728 dolphins were encircled and 377 died in 2004-05 (Hamer et al. 2008). In response,
the fishery was closed for two months while a Code of Practice (CoP) to reduce
interactions with dolphins was developed. An independent observer program was
established in 2006 to monitor the fishery and efficacy of the CoP (Ward et al. 2010).
The 2018-19 year recorded the highest level of mortality since the inception of the
industry CoP and corresponding independent observer program. In 2018-19 and 2019-
20 a total of 15 dolphin mortalities in 4 individual events occurred. As a result of the
significant increase in the mortality events the following actions were undertaken:
• The level of observer coverage for the 2020 calendar year was increased to 20%
of net sets
• PIRSA in collaboration with SASIA undertook a review of the industry CoP
• The SASIA CoP was modified to incorporate training and education requirements
for crew aboard vessels in the fishery
• Three research projects were initiated;
1) A review of literature to examine dolphin mitigation measures applied in other
jurisdictions;
-3-2) Trials of mitigation measures deemed to be most effective in the SASF based
on the literature review of mitigation measures in other jurisdictions; and
3) A population estimate of dolphin numbers in waters adjacent to South
Australia.
The effectiveness of these actions in mitigating dolphin interactions will be observed as
they are rolled out over time. The application of a revised industry Code of Practice
(CoP) that now involves training and educating of skippers and crew is seen as a
positive step in the mitigation of dolphin interactions. Further, should trials of mitigation
measures identify further effective dolphin mitigation measures, consideration will be
given to the application of these measures in the fishery.
The CoP is continuously reviewed by a Wildlife Interaction Working Group (WIWG) that
includes members from the South Australian Sardine Industry Association (SASIA),
PIRSA, and South Australia’s Department for Environment and Water (DEW), as well as
a representative from the Conservation Council of South Australia. Refinements to the
CoP aim to minimise dolphin interactions and improve outcomes for both fishers and
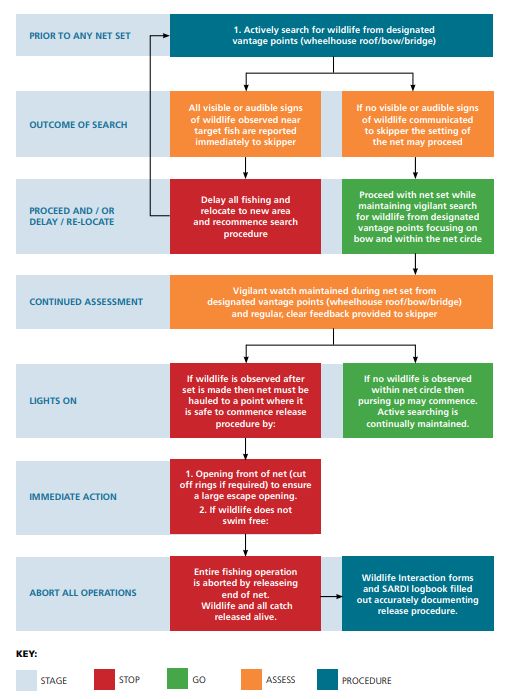
dolphins (Kirkwood et al. 2020). The CoP includes clear operational procedures to
mitigate interactions with common dolphins (Figure 4).
The operational procedures per net-set are:
Avoidance procedures:
1) Active searching for dolphins prior to setting the net;
2) Immediate reporting of dolphins sighted to skipper; and
3) Delaying and potentially relocating fishing activity if dolphins are sighted;
Release procedures:
4) Active searching for dolphins after setting the net (during hauling);
5) Active searching after lights are switched on and during pumping;
6) Immediate action to release encircled dolphins; and
7) Abort fishing if dolphins cannot be released.
All interactions, including sightings that delay or require the relocation of net-sets,
encirclement and releases, and mortalities are to be reported on Wildlife Interaction
Forms (WIFs), and submitted to SARDI.
Further stipulations in the CoP are for skippers to communicate to each other the
location of dolphins in real time, and to share experiences that help mitigate adverse
dolphin interactions. The current release procedure in the CoP is to first open the front
of the net to form a large escape opening. If this is not successful, the set is aborted by
releasing the end of the net (SASIA 2015).
-4-Figure 4. Operational procedures to mitigate interactions with common dolphins in the South Australian Sardine Fishery
(SASF) industry Code of Practice (CoP) (SASIA 2021).
The independent observer-based program collects information on dolphin interactions
and mortality events, adherence to the CoP, dolphin release methods, and other wildlife
observations. Results are analysed by SARDI and reported to the WIWG annually
(Ward et al. 2010, 2011, 2012, 2013, 2015a,b, 2018; Mackay and Goldsworthy 2016,
2017, Goldsworthy 2018, Goldsworthy et al. 2019, Kirkwood et al. 2020). In its first year,
the program reported an 87% reduction in dolphin encirclement rates and a 97%
reduction in mortality rates (Hamer et al. 2008). While interactions generally remain low
compared with the pre-CoP data, there are some discrepancies between data recorded
by observers and when observers are not on-board.
Observer coverage has aimed at 10% of fishing effort (in nights before 2012, and net-
sets thereafter), except in 2007-08, 2008-09 and 2009-10, when a 30% target was set in
response to high rates of encirclement and mortality in 2006-07 (Ward et al. 2010).
Again, in 2019-20, in response to high interaction rates and low apparent reporting in
2018-19, the targeted observer-coverage was increased, to 20%. The 20% targeted
-5-level of observer coverage remained in place until 10 March 2020, when the
independent observer program was suspended as a precautionary measure to prevent
the spread of COVID-19 within the community. When the observer program was
reinstated on 7 September 2020, the program was reinstated at 10% of net sets.
During 2019-20, there were 1052 purse-seine net-sets, the highest number since 2011-
12. The observer coverage of 8% (84 of 1052 purse-seine net-sets) in this year, was
due to observers not being allowed to go onto vessels after 19 March 2020, in
accordance with State Government actions to reduce the spread of the COVID-19.
In 2019-20, 92% of fishing effort occurred between January and June. Although
observers covered 8% of net-sets for the year, they had covered 20% up to 19 March
(including 3% in November, 21% in December, 25% in January, and 21% in February).
From 19 March to 30 June, 64% of net-sets for the year occurred with no observer
coverage (Kirkwood et al. 2020).
Twelve vessels were active in the SASF in 2019-20. Effort in terms of number of net-
sets by individual vessels accounted for 5-14% of fleet fishing effort. Observer coverage
per vessel ranged from 1-13% of net-sets. Up to 19 March, observers had covered 1-17
net-sets per vessel (17-75%, average 25%) (Kirkwood et al. 2020). In addition to the
observer coverage, fishers in the SASF report interactions with Threatened,
Endangered and Protected Species (TEPS) using WIFs. The WIFs enable South
Australia to meet its obligations under the EPBC Act, to report interactions with TEPS.
Data Collection
Sources of data for TEPS include:
1. South Australian Sardine Fishery Research Logbook data (recorded by the
commercial fisher) – logbook number, vessel, date, location and time of net-sets
(shots), estimated catch, comments.
2. Wildlife Interaction Forms (WIFs) (recorded by the commercial fisher) – logbook
number, date, species (net-set [shot], location, number, nature of interaction, status,
and fate), observations and actions to release.
3. SASF TEPS Observer Datasheets (recorded by an independent observer) – logbook
number, data, net-set (shot), weather conditions, timing, adherence to CoP, dolphin
encirclement details (stage observed/ release commenced, release method, nature
of interaction, dolphin condition), comments, wildlife observations (including dolphins
outside the net).
4. Previous data for the SASF (held by SARDI Aquatic Sciences).
Fishery logbook data record information required for fisheries management. The data
were recorded daily while at sea by the skipper of the vessel and supplied routinely to
PIRSA.
-6-WIFs were introduced to the SASF in 2017. Their primary purpose was to ensure all
wildlife interactions were recorded, whether or not an observer was on-board.
Information recorded in WIFs are a subset of the information recorded by observers and
allow for comparison with observer data. They record interactions that otherwise may be
under-recorded, and improve assessments of the application of the industry CoP.
Since July 2006, the independent observer program has been operated continuously by
Protec Marine Pty Ltd and Seatec Marine Services Pty Ltd. Observers generally go with
a vessel for single trips (typically these are over-night but may be up to 4-nights). They
monitor activity during purse seine sets from a high and unobstructed vantage point,
and search for dolphins in the illuminated area surrounding the vessel immediately prior
to the shot. Once the net is set, the observer searches for dolphins within the net for the
duration of the fishing operation (pursing, hauling and pumping).
Specific data recorded that allow an assessment of the application of the CoP include:
1. If initial search procedures are followed;
2. If delays in setting or relocations occur;
3. If dolphins are observed prior to setting; and
4. The steps taken if an encirclement occurs.
Information recorded if a dolphin encirclement event occurs include:
1. The number of dolphins involved;
2. The stage of fishing that dolphin(s) were first observed;
3. How individual dolphins were caught;
4. The release method used;
5. The success of the release method; and
6. Injuries and mortalities.
-7-Table 6. Summary of fishing effort (net-sets), observer coverage, and dolphin encirclement and mortalities events recorded in the South Australian Sardine Fishery,
by financial year between 2007-08 and 2019-20.
Fishing effort (net-sets) Encirclement events (no. dolphins) Mortality events (no. dolphins)
Financial
year Logbook With Without % % Logbook With Without Logbook With Without
total observer observer observed target total obs. obs. total obs. obs.
2007-08 880 181 699 20.6 30 61 (159) 28 (85) 33 (74) 10 (15) 8 (11) 2 (4)
2008-09 932 224 708 24.0 30 63 (158) 21 (53) 42 (105) 3 (5) 3 (5) 0 (0)
2009-10 1097 267 830 24.3 30 67 (188) 29 (90) 38 (98) 5 (5) 2 (2) 3 (3)
2010-11 1015 91 924 9.0 10 41 (125) 11 (39) 30 (86) 7 (7) 2 (2) 5 (5)
2011-12 1108 73 1035 6.6 10 104 (304) 9 (36) 95 (268) 4 (5) 1 (1) 3 (4)
2012-13 861 81 780 9.4 10 99 (226) 9 (24) 90 (202) 4 (4) 1 (1) 3 (3)
2013-14 774 82 692 10.6 10 93 (240) 10 (35) 83 (205) 1 (1) 0 () 1 (1)
2014-15 847 88 759 10.4 10 70 (195) 6 (21) 64 (174) 3 (4) 1 (2) 2 (2)
2015-16 887 94 793 10.6 10 67 (195) 8 (31) 59 (164) 2 (2) 1 (1) 1 (1)
2016-17 975 117 858 12.0 10 59 (197) 8 (28) 51 (169) 1 (1) 1 (1) 0 (0)
2017-18 957 113 844 11.8 10 88 (335) 12 (50) 76 (285) 0 (0) 0 (0) 0 (0)
2018-19 961 119 842 12.4 10 92 (371) 16 (68) 76 (303) 5 (15) 4 (14) 1 (1)
#
2019-20 1052 84 968 8.0 20 122 (455) 8 (36) 114 (420) 4 (4) 1 (1) 3 (3)
Average 950 124 826 78 (240) 13 (46) 65 (194) 4 (5) 2 (3) 2 (2)
#
Target observer coverage for 2019-20 was not achieved due to Covid-19 restrictions on observer access to vessels.
-8-Recommendations and Conditions
No Recommendations Actions Progress
Operation of the fishery will be carried out in accordance with the
management regime under the SA Fisheries Management Act
2007, the Fisheries Management (Marine Scalefish Fisheries) Over the period since accreditation under Part 13 of the EPBC Act on 18
R1 Regulations 2006 and the Fisheries Management (General) Ongoing
December 2018 the fishery has been managed under the relevant legislation.
Regulations 2007.
PIRSA to inform the Department of the Environment and Energy
of any intended material changes to the SA Sardine Fishery
management arrangements that may affect the assessment
R2 against which Environment Protection and Biodiversity No material changes have been made since the last accreditation of the Ongoing
Conservation Act 1999 decisions are made. fishery under Part 13 of the EPBC Act on 18 December 2018 .
PIRSA to produce and present reports to the Department annually
R3 as per Appendix B of the Guidelines for the Ecologically The latest annual report on all South Australian fisheries was provided to Ongoing
Sustainable Management of Fisheries - 2nd Edition. DAWE in April 2021
No Conditions Actions
In 2019 following dolphin mortality events in the fishery the SASIA Code of
Practice was updated, to include education and training of crew and masters
in the fishery on the Code of Practice to mitigate dolphin interactions.
In addition, three relevant research projects are in progress or pending the
Ensure all SA Sardine Fishery participants adopt the most outcomes of current research;
C1 effective measures to mitigate interactions with dolphins. 1) A review of literature to examine dolphin mitigation measures applied Ongoing
in other jurisdictions;
2) Trials of mitigation measures deemed to be most effective in the
SASF based on the literature review of mitigation measures in other
jurisdictions; and
3) A population estimate of dolphin numbers in Spencer Gulf
Since 2016 PIRSA has been working with industry to ensure independent
Ensure observer coverage captures seasonal and spatial observer coverage covers the fleet’s spatial and seasonal distribution. This is
C2 variation in fishing activity across the fleet. undertaken by coordinating with the independent observer provider the
deployment of observers in the fishery of the current 10% coverage of net Ongoing
sets (70 to 90 observer nights). Assessment of the effectiveness of the CoP
is undertaken annually (see Kirkwood et al 2020).
-9-Investigation of CPUE variation with and without an observer present is
Investigate and resolve uncertainties around differences in ongoing. Kirkwood et al 2020, shows that the variation in CPUE with and
sardine catch-per-unit-effort (CPUE) when observers are present without an observer is continuing. Therefore, further consideration and
C3 Ongoing
and when observers are not present, to improve reliability of monitoring of the effectiveness of this measure in assessing changes in
observer data. fishing behavior is necessary. Assessment of the effectiveness of the CoP is
undertaken annually (see Kirkwood et al 2020).
- 10 -References
Econsearch (2018) Economic Indicators for the South Australian Marine Scalefish Fishery 2016/17.
A report to PIRSA Fisheries and Aquaculture. Adelaide. South Australia.
Fletcher, W. J., N. C. H. Lo, E. A. Hayes, R. J. Tregonning, and S. J. Blight. 1996. Use of the daily
egg production method to estimate the stock size of western Australian sardines (Sardinops
sagax). Marine and Freshwater Research 47:819–825.
Gaughan, DJ, Leary, TI, Mitchell, RW and Wright, IW 2004, ‘A sudden collapse in distribution of
Pacific sardine (Sardinops sagax) off south-western Australia enables an objective re-
assessment of biomass estimates’, Fishery Bulletin, 102, pp. 617-633.
Goldsworthy, SD, Page, B, Rogers, P and Ward, T 2011, ‘Establishing ecosystem-based
management for the SASF: developing ecological performance indicators and reference
points to assess the need for ecological allocations’. Final Report to the Fisheries Research
and Development Corporation. South Australian Research and Development Institute
(Aquatic Sciences), Adelaide. SARDI Publication No. F2010/000863-1. SARDI Research
Report Series No. 529. 173pp.
Hamer, DJ, Ivey, A and Ward, TM 2009, Operational interactions of the South Australian Sardine
Fishery with the Common Dolphin: November 2004 to March 2009, SARDI Aquatic Sciences
publication no. F2007/001098-2, SARDI Report Series no. 354, South Australian Research
and Development Institute (Aquatic Sciences), Adelaide.
Kirkwood, R., Goldsworthy, S.D. and Ward, T.M. (2020). Assessment of dolphin interactions,
effectiveness of Code of Practice and fishing behaviour in the South Australian Sardine
Fishery: 2019-20. Report to PIRSA Fisheries and Aquaculture. South Australian Research
and Development Institute (Aquatic Sciences), Adelaide. SARDI Publication No.
F2010/000726-11. SARDI Research Report Series No. 1077. 34pp.
Lasker, R. 1985. An egg production method for estimating spawning biomass of pelagic fish:
application to northern anchovy, Engraulis mordax. NOAA. Tech. Rep. NMFS 36:1–99.
Mackay, A.I. (2018). Operational Interactions with Threatened, Endangered or Protected Species in
South Australian Managed Fisheries Data Summary: 2007/08 - 2016/17. Report to PIRSA
Fisheries and Aquaculture. South Australian Research and Development Institute (Aquatic
Sciences), Adelaide. SARDI Publication No. F2009/000544-8. SARDI Research Report
Series No. 981. 72pp.
Mackie, DW 1995, A management plan for the experimental pilchard fishery, South Australian
Fisheries Management Series paper no. 13.
Mangel, M., and Smith, P.E. (1990) Presence-absence sampling for fisheries management.
Canadian Journal of Fisheries and Aquatic Sciences 47: 1875–1887.
McGarvey, R., and M. A. Kinloch. 2001. An analysis of the sensitivity of stock biomass estimates
derived from the daily egg production method (DEPM) to uncertainty in egg mortality rates.
Fisheries Research 49:303–307.
PIRSA (2011). Ecologically Sustainable Development (ESD) risk assessment of the South Australian
Commercial Marine Scalefish Fishery
PIRSA (2013). Management Plan for the South Australian Commercial Marine Scalefish Fishery.
The South Australian Fisheries Management Series Paper Number 59.
SASIA (2021) Code of Practice for mitigating interactions with Wildlifeandthe South Australian
Sardine Fishery. https://sasardines.com.au/wp-content/uploads/2021/04/SASIA-
CodeOfPractice-PW-2021-Published-.pdf
Sloan, SR, Smith, ADM, Gardner, C, Crosthwaite, K, Triantafillos, L, Jeffries, B and Kimber, N 2014,
National Guidelines to Develop Fishery Harvest Strategies. Fisheries Research and
Development Corporation report, project 2010/061.
South Australian Sardine Industry Association (SASIA), 2015, Code of Practice, For mitigating
interactions with Wildlife and the South Australian Sardine Fishery.
- 11 -Shanks, S 2005, Management Plan for the South Australian Pilchard Fishery, South Australian
Government paper no. 47, South Australian Fisheries Management Series, Primary
Industries and Regions South Australia (Fisheries and Aquaculture), Adelaide.
Stewardson, C., Andrews, J., Ashby, C., Haddon, M., Hartmann, K., Hone, H., Horvat, P., Mayfield,
S., Roelofs, A., Sainsbury, K., Saunders, T., Stewart, J., Nicol, S. and Brent Wise (eds) 2018,
Status of Australian fish stocks reports 2016, Fisheries Research and Development
Corporation, Canberra.
Stratoudakis, Y., M. Bernal, K. Ganias, and A. Uriate. 2006. The daily egg production method: recent
advances, current applications and future challenges. Fish and Fisheries 7:35–57.
Ward, T. M., P. J. Rogers, P. Stephenson, D. K. Schmarr, N. Strong, and L. J. McLeay. 2005.
Implementation of an Age Structured Stock Assessment Model for Sardine (Sardinops
sagax) in South Australia. Final report to Fisheries Research and Development Corporation.
Ward, T. M., P. Burch, and A. R. Ivey. 2010. South Australian Sardine (Sardinops sagax) Fishery:
Stock Assessment Report 2010: Report to PIRSA Fisheries. SARDI Aquatic Sciences
(Adelaide).
Ward, T. M., P. Burch, L. J. McLeay, and A. R. Ivey. 2011. Use of the Daily Egg Production Method
for stock assessment of sardine, Sardinops sagax; lessons learned over a decade of
application off southern Australia Reviews in Fisheries Science 19:1–20.
Ward, T. M., P. Burch, and A. R. Ivey. 2012. South Australian Sardine (Sardinops sagax) Fishery:
Stock Assessment Report 2012. South Australian Research and Development Institute
(Aquatic Sciences), Adelaide.
Ward, T. M., A. R. Ivey, and P. Burch. 2013. Spawning biomass of sardine, Sardinops sagax, in
waters off South Australia in 2013. Report to PIRSA Fisheries and Aquaculture. South
Australian Research and Development Institute (Aquatic Sciences), Adelaide. SARDI
Publication No. F2007/000566–5. SARDI Research Report Series No. 740.41 pp.
Ward, T. M., A. R. Ivey, and J. D. Carroll. 2014. Spawning biomass of sardine, Sardinops sagax, in
waters off South Australia in 2014. Report to PIRSA Fisheries and Aquaculture. South
Australian Research and Development Institute (Aquatic Sciences), Adelaide. SARDI
Publication No. F2007/000566–6. SARDI Research Report Series No. 807. 33 pp.
Ward, T., A. Whitten, and A. Ivey. 2015. South Australian Sardine (Sardinops sagax) Fishery: Stock
Assessment Report 2015.
Ward, T.M., Smart, J., Grammer, G., Ivey, A. and McGarvey, R. (2019). Stock assessment of
Australian Sardine (Sardinops sagax) off South Australia 2019. Report to PIRSA Fisheries
and Aquaculture. South Australian Research and Development Institute (Aquatic Sciences),
Adelaide. SARDI Publication No. F2007/000765-6. SARDI Research Report Series No. 971.
107pp.
Ward, T.M., Ivey, A.R. and Grammer, G.L. (2020). Spawning biomass of Sardine, Sardinops
sagax, in waters off South Australia in 2020. Report to PIRSA Fisheries and Aquaculture.
South Australian Research and Development Institute (Aquatic Sciences), Adelaide. SARDI
Publication No. F2007/000566-11. SARDI Research Report Series No.1074. 27pp.
- 12 -You can also read