Economic Dialogue with Ireland - ECON on 11 May 2022
←
→
Page content transcription
If your browser does not render page correctly, please read the page content below
IN-DEPTH ANALYSIS

Economic Dialogue with Ireland
ECON on 11 May 2022

  This note presents selected information on the current status of the EU economic governance procedures and
  related relevant information in view of an Economic Dialogue with Pascal Donohoe, Minister of Finance of
  Ireland, in the ECON committee of the European Parliament. The invitation for a dialogue is in accordance with
  the EU economic governance framework.

1. Economic situation
According to the Central bank of Ireland, “the economy began 2022 with strong growth momentum from the
lifting of pandemic restrictions. However, higher inflation, the result of sharply rising energy and higher food
prices, as well as greater uncertainty and negative consumer confidence effects, all imply headwinds to growth”.
Overall in 2021 Irish GDP grew by the fastest pace in the euro area (13,5%), despite contracting
somewhat (-5,4%) over the last quarter of the year The increase was driven mainly by exports.
 Figure 1: GDP development compared to the EU Figure 2: HICP development compared to the EU
 and the EA (quarterly change)                and the EA (annual change)

Source Eurostat (here and here).

The International Monetary Fund (IMF) latest Article IV Mission concluding statement also confirms that
“Ireland’s economy has rebounded strongly from the pandemic and GDP surpassed its pre-pandemic
trend. Growth is projected to remain strong, although there is substantial uncertainty due to the indirect impacts

                                  Economic Governance Support Unit (EGOV)
                            Authors: Samuel De Lemos, Cristina Dias, Kristina Grigaitė,
                                Wolfgang Lehofer, Marcel Magnus, Alice Zoppè                                  EN
                                     Directorate-General for Internal Policies
                                             PE 699.538 - May 2022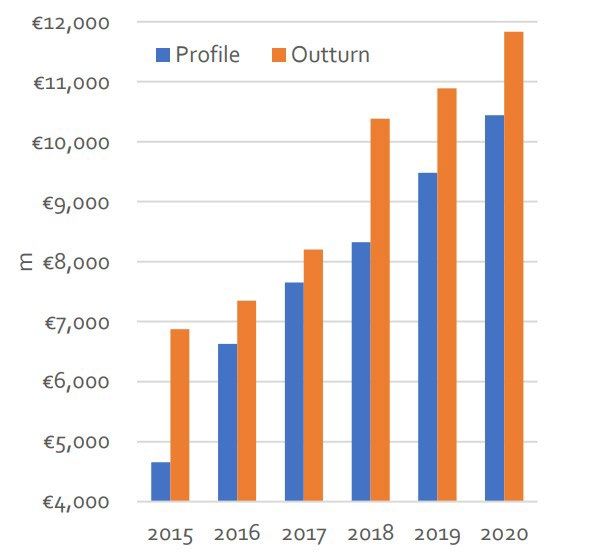
IPOL | Economic Governance Support Unit

from the war in Ukraine”. The IMF slightly revised its forecast for Ireland compared to the one published in
the World Economic Outlook (WEO) in April and projects that “real GDP growth is projected to decelerate to a
still robust 6 and 5 percent in 2022 and 2023, respectively ... headline inflation is projected to average 6.5 percent
(with core inflation rising to 4.5 percent) in 2022 and 2.8 next year”. Nevertheless, the IMF points out that several
pre-pandemic challenges remain that could stall economic recovery (see Section 3.2)
Table 1: GDP and Inflation growth forecasts for Ireland

                                  IMF WEO           Irish             Irish         Economic           COM            Irish Fiscal
                   IMF           April 2022        Central         Governme         and Social        Winter           Advisory
                 Article IV                         Bank           nt Stability      Research          2022             Council
    Year                                                                             Institute
                 May 2022                         April 2022       Programm                          Forecast         December
                                                                        e             March          February            2021*
                                                                                       2022
                                                                   May 2022                            2022

                                  Gross domestic product, annual percentage change

 2019                     4,9              4,9              4,9              4,9              4,9             4,9              2,6

 2020                     5,9              5,9              5,9              5,9              5,9             5,9             -3,5

 2021                   13,5             13,5             13,5             13,5             13,5             13,7              4,7

 2022                     6,0              5,2             6,1              6,4               6,2             5,5              5,2

 2023                     5,0              5,0             5,5              4,4               4,3             4,5              3,5

                                            Inflation, annual percentage change

 2022                     6,5              5,7              6,5              6,2              6,7              4,6             2.2

 2023                     2,8              2,7              2,8              3,0              5,0              2,5             1.9
* Note: The Irish Fiscal Advisory Council uses GNI instead of GDP. Given that Ireland hosts many foreign multi-national corporations,
there are large differences between GNI and GDP, for broader discussion, please see here.

Inflation developments in Ireland follow quite closely the trend of the EU and euro area (EA) averages
since the start of 2021, as the underlying factors driving inflation are similar, with wholesale energy prices
being the primary largest driving factor (according to the Central bank of Ireland, financial markets are
expecting this price pressure to decline in the second half of the year, but still to remain above 2021 levels).
Inflation is projected to reach 5.7%-6.7% in 2022, and later subside to 2.7%-5.0% in 2023 (taking into account
only projections published after the outbreak of the war, see Table 1).
After running large a budget deficit in 2020 and 2021 (8.8% and 3.5% respectively), due to
improvement primarily driven by a rapid recovery of tax revenues and lower than expected
government expenditure, the situation of public finances is estimated to improve. “A further
improvement in the public finances is expected this year, while the general government balance is projected to
return to surplus in 2023, as the withdrawal of temporary pandemic supports and the impact of strong activity
levels on tax receipts outweigh robust core expenditure growth”. According to the Central bank of Ireland, “the
budget surplus is projected to be 1.9 per cent of GNI at the end of the projection horizon in 2024 ... Favourable
debt dynamics are expected to lead to further improvements over the medium term, with the ratio projected to
be 84.7 per cent of GNI in 2024”. It is also noted that very large cash balances held by the National Treasury
Management Agency (NTMA) is another factor that should increase sovereign funding flexibility in a more
uncertain environment going forward.

                                                                  2                                                   PE 699.538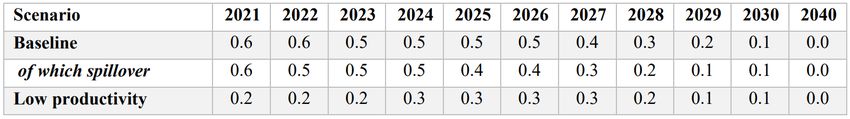
Economic Dialogue with Ireland 11 May 2022

The latest Fiscal Assessment Report of the Irish Fiscal Advisory Council (December 2021) presents a
macroeconomic scenario which set out “a strong recovery and risks broadly balanced over the medium term”.
Based on this scenario, “a budget deficit of 3.4% of GNI was forecasted for 2022 with significant upside risks”.
According to the same report, “the budget is set to reach close to balance by 2023 and to improve modestly
thereafter to reach a surplus of 0.3% of GNI by 2025”. Furthermore, the Council praised the government for
“presenting a clearer strategy than past budgets” while questioning “how major commitments on health and
climate change fit into the government’s medium-term strategy and whether sufficient resources have been
allocated”. It stresses the need for the government “to reinforce its new 5% spending rule”, whereby additional
spending would require tax increases or spending reductions. Finally, it recommended that “over-reliance
on corporate tax receipts to fund public services that has built up in recent years should be reduced”.
According to the latest report by the National                  Figure 3: Corporation Tax Receipts in Ireland
Competitiveness and Productivity Council (September
2021), corporation tax receipts have grown
significantly since 2015 by an average of €1 billion per
annum, and the volatility of the tax head can be seen in
the consistent differences between what was forecast and
year end receipts. In addition, corporation tax receipts
have become a greater part of the State’s total tax take
over the last ten years with 2020 corporation tax receipts
of €11.8 bn equal to 21% of total exchequer receipts.
For the most recent figures of the Irish fiscal balances,
please see Fiscal Monitor (April 2022), by the Irish
Department of Finance.
Also, employment projections are revised upwards            Source: National Competitiveness and Productivity
(even though the outbreak of the war and inflationary       Council, September 2021
pressures on business costs and wages are posing
downside risks to employment developments), as “the outlook for employment is buoyed by increased labour
demand across all economic sectors to absorb additional spare capacity as pandemic support schemes are
wound down and public health measures are lifted”. This would lead to better than anticipated
unemployment rate projections that are expected to reach 6.0% and 5.4% in 2022 and 2023 respectively.
According to the latest Central bank of Ireland Financial Stability Review, “accommodative global financial
conditions – together with other factors, such as shifting household preferences and increased household savings
– have also led to a sharp rise in global house prices”. The trend of growing housing prices is also present
in Ireland, where at the current state house price index is close to the housing prices observed before
the Great financial crisis. Nevertheless, the European Systemic Risk Board (ESRB) since 2016 never issued
neither a warning, nor a recommendation addressed to Ireland, signalling the build-up of medium-term
vulnerabilities related to housing prices, credit dynamics as well as housing affordability.

 PE 699.538                                            3
IPOL | Economic Governance Support Unit

Figure 4: House price index development Ireland, the EU and the EA (2010=100)

Source: EGOV based on Eurostat.

  Box 1: The Irish Corporate tax regime
  The 2019 and 2020 country specific recommendations (CSR) addressed by the EU to Ireland for both 2019 and 2020
  reflect concerns about a number of aspects of the Irish tax regime (notably, the need to broaden the tax base). The
  2018 CSRs had similar concerns (see here). The Commission consistently assessed Ireland’s progress as limited.
  Whilst recognising that the Irish RRP has some measures addressing tax matters, the Commission still regards
  progress as insufficient (see following section). See also Annex 1 for the 2019, 2020 and 2021 CRSs for Ireland.
  The Irish corporate tax regime relies on a number of incentives (see summary here) notably a 12.5% corporation tax
  rate on active business income; a 25% credit on qualifying research and development expenditures (with a total
  effective tax deduction of 37.5%); accelerated tax depreciation allowances for approved energy efficient equipment
  and the ability to exploit intellectual property at favourable tax rates. A press release from the Irish Finance Ministry
  dated October 2021 notes the Irish agreement to the OECD International Tax Agreement after securing a number
  of conditions: (a) the certainty on the applicable scope of the 15% tax rate (which leaves the 12,5% tax rate still
  applicable “For over 160,000 businesses in Ireland with a turnover less than €750 million per annum, who employ
  approximately 1.8 million people”; (b) recognition of the important role that research and development plays;
  Minister Donahue noted: “Innovation matters and it is right that the tax system can support this. I am pleased that it has
  been recognised and delivered in the agreement”. KPMG assessed positively the results of the negotiation, pointing
  out that “while it is difficult to quantify the impact on the Exchequer, we believe there is a chance that the impact could
  be close to net neutral, with a possibility of it being net positive” and that “Ireland’s negotiated outcome demonstrates
  the continued commitment of the Irish government to a competitive and pro-business environment”.
  According to an OECD database (see here), Bulgaria and Hungary have lower statutory corporate income tax rates
  than Ireland (of 10% and 9%, respectively). The OECD data on statutory corporate income tax rate shows the basic
  central government statutory (flat or top marginal) corporate income tax rate. According to the Tax Foundation (see
  here) the “worldwide average statutory corporate income tax rate, measured across 180 jurisdictions, is 23.54 percent.
  When weighted by GDP, the average statutory rate is 25.44 percent.” According to the same source, “The average top
  corporate rate among EU27 countries is 21.30 percent, 23.04 percent among OECD countries, and 69 percent in the G7”.

2. The Irish Recovery and Resilience Plan
Ireland presented its Recovery and Resilience Plan (RRP; available here) to the Commission on 28 May 2021.
The Commission assessed the plan on 16 July and the Council adopted a Council Implementing Decision

                                                              4                                                 PE 699.538
Economic Dialogue with Ireland 11 May 2022
(CID) endorsing the Commission positive assessment on 31 August 2021 1. The Irish plan is aligned with an
overall global investment plan the Government put forward (the National Development Plan); the RRF
contributes to that plan with less than 1%2. The Commission published a summary of the Irish plan (available
here). A comparative table with the Commission’s assessments of a number of plans, including that of
Ireland, can be found here.
Ireland will receive EUR 989 million in grants from the RRF (Ireland asked for no loans, at the moment,
and also did not asked for pre-financing). The RRF corresponds to 0.23% of Irish 2021 GDP. The RRF is
also comparatively small to other EU funds Ireland is due to receive (see Table 2 below). The upcoming RRF
re-calculation of the grants allocation leads Ireland to decrease its grant allocation from around 1 billion to
0,91 billion (further details can be found here, section 1.3).
Table 2: Estimated Ireland allocations under a number of EU funds
Allocation
EU funds
(Million Euros)
RRF 1 000
React-EU 53
Just Transition Fund 85
European Agricultural Fund for Rural Development NGEU 189,7
Cohesion funds 1 195
European Agricultural Guarantee Fund 8 300,4
European Agricultural Fund for Rural Development MFF 2 250,4
Source: European Commission (here)
According to the Commission, around 42% of the plan will support climate investments and reforms
and around 32% of the plan will foster the digital transition. According to the CID annex, the Irish RRP
contains 109 measures, 15 investments and 9 reforms across 3 components (Advancing the Green transition;
Accelerating and expanding digital reforms and transformation; and Social and Economic Recovery and job
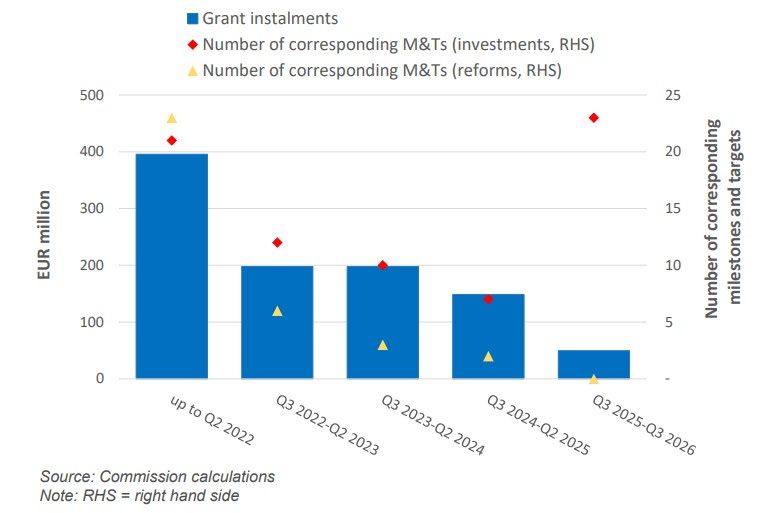
creation). There will be five disbursements. The RRP is rather frontloaded, with disbursements (and
milestones and targets) concentrated mostly in the first half of 2022 (see Figure 5 below).
1
For an overview of Member States’ RRPs and their adoption procedures, see specific EGOV briefing
2
See Irish RRP: “While the €915 million available under the NRRP will constitute less than 1% of total investment under the NDP, the funding will be
directed into complementary investments that will make meaningful contributions to the process of recovery from the impacts of COVID-19”.
PE 699.538 5IPOL | Economic Governance Support Unit
Figure 5: Irish expected disbursement profile
Source: Commission’s presentation to the Council Financial Counsellors Working Party, August 2021
Despite the Commission’s positive assessment of the Irish RRP, the Commission Staff Working Document
(SWD) identifies a number of areas where the Irish plan could be more ambitious or where challenges
remain. These are, notably:
- Ireland plan contains a number of measures addressing gender-related concerns (see specific
EGOV briefing for details). Despite considering that Ireland has addressed some concerns outside its
RRP, the Commission notes “There is scope for improved coverage of early childhood education and
care in Ireland. While the provision of quality and affordable childcare has improved over the past years,
Ireland is still well below the EU average in terms of the proportion of children aged 3 or less attending
childcare for more than 30 hours a week. This continues to have an adverse effect on female labour
market participation. The gender employment gap (12.1% in 2020) is still above the EU average (11.3%).”
(SWD, p. 50);
- Ireland plan contains measures that take into account regional disparities. The Commission
considers that “Nonetheless, given the modest size of the financial contribution and the entrenched
nature of some of the challenges, further efforts are needed in several areas in the coming years”; (SWD,
p. 35);
- The Commission considers Ireland’s plan contain a number of important measures addressing
effective supervision and enforcement of the anti-money laundering framework (on this issue,
see specific EGOV briefing for further details). Nonetheless, the Commission points out that “the plan
does not include actions to bring about effective risk-based supervision by self-regulatory bodies. Outside
the plan, these reforms are complemented on a national level through the introduction of a central
register of beneficial ownership of collective asset-management vehicles, credit unions and unit trusts,
which is expected to help ensure transparency of investment vehicles.” (SWD, p. 39);
6 PE 699.538Economic Dialogue with Ireland 11 May 2022
- On the other hand, the Commission considers the plan only partially addresses challenges related
to features of the Irish tax system that facilitate aggressive tax planning (SWD, p. 39 and specific
EGOV briefing) and does not contain specific measures to broaden the tax base. The Commission
recognises that the issue could be addressed by measures outside the plan (SWD, p. 40) 3;
- As regards macroeconomic imbalances experienced by Ireland, the Commission points out that
“The modest size of the plan implies that the potential to directly address the vulnerabilities in the context
of the macroeconomic imbalance procedure is very limited. Ireland has been identified as a country with
vulnerabilities stemming from large private and public debts and net external liabilities. While the direct
impact of the plan on these vulnerabilities might be very limited, the plan may indirectly help lessen
riskiness of the private debt and external debt to the degree it improves productivity, employment and
competitiveness. Similarly, the planned reforms are expected to strengthen the business environment, as
well as the efficiency of the public sector, thereby further reducing these vulnerabilities and the associated
risks.” (SWD, p. 42).
- the Commission signals that Ireland is likely to be failing ambition to meet its green targets (see
SWD, p. 13 to 17, the EGOV briefing referred to above and the IMF Article IV consultation staff press
release of 5 May). The Carbon Brief platform has been tracking post-COVID recovery measures that
contribute to fostering the green transition. A number of initiatives are identified as being
implemented by Ireland.
Through its RRP, Ireland is also participating in a multi country project (see a specific EGOV briefing for
further details), the European Digital Innovation Hub.
Ahead of receiving a first disbursement under the RRF, Ireland needs to complete two specific milestones
relating to its internal audit and control systems (both to be finalised by Q4 2021). Ireland needs to present
reports confirming its repository system functionalities and another confirming the commitment of
resources for the bodies overseeing implementation and monitoring the RRP (measures 108 and 109; CID
annex, p. 53). Ireland has yet to sign its operational agreement with the Commission (Ireland first payment
request is not expected before end of Q2 2022 due to its expected disbursement profile; see above).
The Irish authorities considered in its RRP 4 that the “Recovery and Resilience Facility is likely to have a small
direct impact from a macroeconomic perspective (...) Overall, the level of GDP is expected to be 0.1 percentage
points larger on average relative to the baseline scenario. The planned expenditure under the National Recovery
and Resilience Plan is also estimated to boost the level of employment by 0.15 percentage points on average over
the 2021-2026 period”. The authorities underlined that the indirect impacts might be larger, considering the
open nature of the Irish economy. Indeed, the Commission’s estimates in the Staff Working Document (SWD)
point to most of the NextGeneration EU (and not only the RRF) impact on Irish economy to come from
positive spillover effects (see Box 2 below).
3
See as well the Commission’s summary of the Irish RRP (here).
4
The RRP (here), p. 11.
PE 699.538 7IPOL | Economic Governance Support Unit
Box 2: Commission’s stylised NGEU impact simulations with QUEST
Model simulations conducted by the Commission using the QUEST model show that the economic impact
of the NextGenerationEU (NGEU) in Ireland could lead to an increase of GDP of between 0.3% and 0.5% by
202622. Spillovers account for a large part of such impact.
According to these simulations, this would translate into up to 6 200 additional jobs. Cross border (GDP) spillovers
account for 0.4 percentage points in 2026, showing the value added of synchronised expenditure across Member
States (line 2). Even in a scenario with a lower productivity of NGEU funds, it would still lead to a significant impact
(line 3)23.
Table 8: QUEST simulation results (%-deviation of real GDP level from non-NGEU case, linear disbursement
assumption over 6 years)
This stylised scenario does not include the possible positive impact of structural reforms, which can be
substantial. A model-based benchmarking exercise shows that undertaking structural reforms that would result
in halving the gap vis-à-vis best performers in terms of indicators of structural reforms could raise Ireland GDP by
11% in 20 years’ time, in line with findings for the EU average 24.
Due to the differences in the assumptions and methodology, the results of this stylised assessment cannot be
directly compared to the numbers reported in chapter 4 of Ireland’s recovery and resilience plan.
22
RRF amounts to roughly 90% of NGEU, which also includes ReactEU, Horizon, InvestEU, JTF, Rural Development and RescEU.
23
Technically, the low productivity scenario considers a significantly reduced output elasticity of public capital.
24
Varga, J, in 't Veld J. (2014), ‘The potential growth impact of structural reforms in the EU: a benchmarking exercise’, European Economy
Economic Papers no. 541. http://ec.europa.eu/economy_finance/publications/economic_paper/2014/pdf/ecp541_en.pdf.
Source: Commission SWD, p. 45
According to European Commission’s Staff Working Document, the involvement of Irish stakeholders in
the consultation process setting up the NRRP was relatively brief. The Irish government was mainly
seeking views from stakeholders by an open online public consultation process requesting inputs from
stakeholders on “two questions: ‘What areas should Ireland prioritise for investments and reforms for inclusion
in the plan?’ [and] ‘What Country Specific Recommendations received by Ireland in 2019 and 2020 are considered
the most relevant for reflection upon in Ireland’s National Recovery and Resilience Plan?’”. The government
received “110 written ideas, including from regional representatives, political parties, business associations,
trade unions, youth organisations, environmental organisations, academia, other civil society stakeholders, and
members of the public” which were summarised and distributed throughout the government departments.
A summary of the public consultation process and how this consultation has been reflected in the plan is
included in the plan itself and can be found here.
According to a recently conducted survey on how national parliaments are dealing with the Next Generation
(NGEU)/RRF, the Irish Parliament - the Houses of the Oireachtas - has not set up a specific committee to
scrutinise RRP implementation. The monitoring is likely - the first RRF payment request is expected to be
later in 2022 - to be analysed through the already established mechanisms for scrutiny of public expenditure.
In Ireland’s case, this means that the individual milestones and targets will be scrutinised by the
parliamentary committees dealing with the specific sector the milestones and targets relate to, while the
overall scrutiny of the RRP will be considered by FINPER 5, the EU Affairs committee, and the committees that
scrutinise appropriate budgetary expenditure (budget oversight committee and audit committee) as
appropriate.
5
Committee on Finance, Public Expenditure and Reform, and Taoiseach.
8 PE 699.538Economic Dialogue with Ireland 11 May 2022
3. Recent EU and/or International policy recommendations
3.1 Latest European Semester recommendations
In its opinion on the Draft Budgetary Plan of Ireland from 24 November 2021, the Commission notes
that “The outlook for public finances continues to be subject to the high uncertainty that surrounds the
macroeconomic projections, including risks related to the evolution of the pandemic and possible scarring
effects.” The Commission recalls “the importance of the composition of public finances and the quality of
budgetary measures, including through growth-enhancing investment, notably supporting the green and digital
transition. Measures included in the National Development Plan, such as residential retrofit and the National
Broadband Plan, are in line with supporting the green and digital transition.”
In the context of the Macroeconomic Imbalance Procedure (MIP), Ireland has been considered as
experiencing macroeconomic imbalances since 2014 6 and was therefore been addressed MIP-related
Country Specific Recommendations also in 2019 and 2020 (please see Annex 3).
In the latest Alert Mechanism Report of November 2021, the Commission noted that during the 2021
Semester cycle, Ireland was experiencing macroeconomic imbalances, in particular involving vulnerabilities
linked to high private, public and external debt (see also EGOV MIP implementation paper). In the November
2021 MIP scoreboard, the following indicators were above their indicative thresholds: the current account
balance, the net international investment position, private sector debt and the activity rate (please see
Annex 2). The Commission decided to examine further the persistence of imbalances or their unwinding
and its conclusions and recommendations will be published on 25 May 2022, within the “Spring Semester
Package”.
3.2 Latest policy recommendations by IMF
The IMF considers in its Art IV Consultation with Ireland (published in June 2021) that there is considerable
uncertainty about the short to medium term prospects for the Irish economy with risks still dominated today
by 1) the implementation of post-Brexit trade agreements and 2) changes in international corporate
taxation:
- Ireland is the EU country most exposed to Brexit due to its close trade and financial links, as well as its high
labour mobility, with the UK economy. The uncertainties surrounding non-tariff barriers to trade remain a
risk that could affect not only the Irish economy as a whole, particularly through disruptions in supply chains,
but also its public finances. Conversely, the potential relocation of UK-based services to Ireland, due to its
favourable and robust legal and other environment and continued access to the EU market, may have
beneficial effects for the Irish economy. The results of the simulation using the IMF's GIMF model suggest a
small but persistent negative impact of the Trade and Cooperation Agreement on growth. Over a five-year
period after Brexit, a small permanent supply shock and non-tariff trade barriers reduce exports and
investment, resulting in a cumulative output loss of 1.7%.
- Future corporate tax revenues could be affected by the adoption of a higher international minimum tax
than Ireland's 12.5% (see Box 1), although this could be mitigated by Ireland's non-tax comparative
advantages which are likely to continue to attract FDI. In these circumstances, the IMF believes that
6
From 2011 until the end of 2013, the EU and IMF provided financial assistance to Ireland. In December 2013, Ireland successfully completed the
EU-IMF financial assistance programme, and was therefore submitted to the surveillance under MIP. Ireland is subject to post-programme
surveillance (PPS) until at least 75% of the financial assistance received has been repaid. PPS will last at least until 2031 (see also specific ESM
page).
PE 699.538 9IPOL | Economic Governance Support Unit
Ireland should continue to build on its important non-tax comparative advantages, such as a strong and
stable legal and policy environment, a favourable business climate and a highly skilled workforce.
More recently, the IMF, including in its staff concluding statement of the 2022 Article IV mission7,
details a series of policy recommendations to address the remaining medium-term challenges facing
the Irish economy:
- Active labour market policies should be further strengthened, including in areas such as retraining and
placement services, with particular attention to youth employment. Productivity can be increased through
better education and vocational training. It is also important to empower women to increase their low
labour market participation, including by increasing the availability of affordable childcare. Employment in
contact-intensive sectors is still lagging, and the construction and multinational enterprises sectors
continue to report severe labour shortages. Policies should, therefore, focus on facilitating labour
reallocation, including through upskilling and provision of affordable childcare programs. In this context,
the IMF welcomes the strategy in the Economic Recovery Plan to strengthen access to training, including the
measures aimed at increasing the take-up of training courses and apprenticeships.
- To reduce shortages of affordable housing, the IMF recommends increased public investment in social
and physical infrastructure as well as in affordable housing, and a focus on boosting productivity in the
construction sector and improving zoning and the permits processes. The government has launched the
“Housing for All” program, which includes measures such as improving zoning, planning, land availability,
and provision of social housing. The IMF encourages timely implementation of this program and placing
further emphasis on policies aimed at enhancing productivity and competition in the construction sector,
further improving dissemination of data on local zoning, and simplifying the process to obtain permits.
- In terms of environment-related policies, Ireland had not met the EU's 2020 climate targets by 2020.
Strong economic growth since 2005 and the sectoral specificity of emissions (1/3 of emissions from
agriculture) largely explain the limited progress in reducing emissions. The IMF considers that Ireland is
making progress in implementing its ambitious climate agenda, but more clarity is needed on measures to
achieve the stated quantitative targets. Important steps towards achieving the new goals include a carbon
tax path to €100 per ton by 2030, green policies in the National Recovery and Resilience Plan (including
retrofitting of public buildings and railroad investment) and plans to boost investment in low-emission
transport, energy-efficient housing, and renewable energy. The IMF also considers that just transition
measures should be a priority to support the affected groups.
7
The statement is released before the publication of the latest Article IV consultation, which is expected to be published in the coming weeks.
10 PE 699.538Economic Dialogue with Ireland 11 May 2022
- Fiscal policy will need to be adapted to stimulate sustainable growth and support social cohesion. Overall
the IMF welcomes the Irish planned medium-term fiscal strategy. The tax base should be broadened to help
finance productivity-enhancing investments in human and physical capital and reduce public debt. The IMF
also considers that there is a need to further improve the efficiency of spending, notably by improving the
implementation of physical and social infrastructure projects, including in the areas of health, education and
housing, also given that the Irish fiscal balance is approaching its pre-pandemic level and public debt
expected to fall below 40 percent of GDP over the medium term, while ensuring value for money. Remaining
uncertainty regarding international corporate income tax (CIT) and long-term demographic trends
necessitate a broadening of the tax base, including by removing preferential VAT rates and gradually
increasing the very low property tax rates while ensuring adequate social safeguards. Given the uncertainty,
future CIT revenues should be treated with caution, allocating any windfalls to the Rainy-Day Fund.
Box 3: Report on Ireland’s Competitiveness Challenge 2021
The Irish Competitiveness and Productivity Council reports to and advises the Taoiseach on competitiveness issues
facing the Irish economy. It published its latest report in September 2021. It made 20 specific recommendations
aimed to address both immediate competitiveness issues, and more medium- and long-term challenges
based on four broad policy strands:
• Ensure Ireland has a dynamic business environment;
• Increase productivity growth;
• Deliver infrastructure for a new way of living; and
• Progress sustainability and inclusivity policies.
The Government has responded to all 20 of the recommendations that were set out in the Competitiveness
Challenge, indicating the range of actions and reforms currently or soon to be implemented, as well as the
Government department responsible for such implementation.
4. Recent performance of the banking sector
The most recent Post-Programme Surveillance Report Ireland 8, published in Autumn 2021, finds that “Irish
banks have maintained solid capital levels during the pandemic, even though the 2021 European Banking
Authority (EBA) stress test highlighted some material vulnerabilities. [...] Going forward, the EBA stress test
results depict Irish banks among those with the largest projected capital depletion over a three-year stressed
scenario. This reflects their heavy exposures to credit risk, translating into larger impairments, and to their strong
reliance on interest income in an environment of persistently low interest rates.” (emphasis added; the results of
the EBA 2021 EU-wide stress test exercise can be found here)
The ECB’s most recent Supervisory Banking Statistics for the fourth quarter 2021 show that the large - i.e.
significant - banks in Ireland were on average slightly less profitable than their peers in the euro area, with
a Return-on-Equity ratio of 5.9% (average of all significant banks: 6.7%), and that they had on average a non-
8
Background: In 2008, the Irish banking sector experienced a deep crisis, experiencing severe funding pressures that re-emerged in 2010, in light
of unresolved questions about the viability of some of the Irish banks, the fiscal implications of the sovereign backstop given to the banking
sector, and protracted but eventually unsustainable central bank liquidity support. A report by the Financial Stability Institute on the banking
crisis in Ireland points out that “At its core, the crisis was a traditional case of unsustainable funding and excess credit growth and concentration of
lending towards a single economic sector, where a bubble developed.” By end-2010, the Irish government had injected in total EUR 46 billion into
the domestic banks, nearly EUR 35 billion thereof into a bank that was later nationalised and wound down (Anglo/INB). Following the agreement
on a euro area assistance programme, the Irish authorities announced in March 2011 a strategy for restructuring the domestic financial sector
around two pillar banks, namely Bank of Ireland (BOI) and Allied Irish Banks (AIB), which in total received another EUR 20 billion in capital (for
more details also see the Ex post Evaluation of the Economic Adjustment Programme Ireland, 2010-2013).
PE 699.538 11IPOL | Economic Governance Support Unit
performing loan ratio of 2.5% that was just slightly higher than that of their peers (average of all significant
banks: 2.1%).
There are three features that have an impact on the recent development of the Irish banking sector:
• Following Brexit, investment banks moved to Ireland.
• Two foreign-owned retail banks have withdrawn from the Irish market, impacting market shares
and the choices available for retail clients and small businesses
• The Irish government has initiated a review on the future of the Irish banking market, having a dual
role as biggest shareholder of Irish lenders.
The balance sheets of Irish banks under the ECB’ Single Supervisory Mechanism more than doubled in recent
years, growing from EUR 260 billion in December 2016 (ECB statistics) to EUR 545 billion in December 2021
(ECB statistics). That increase demonstrates how Brexit affected Ireland's financial landscape, as three major
investment banks (Bank of America, Citi, and Barclays) set up or expanded subsidiaries in the country since
the Brexit vote in 2016. While those banks provide important financial services to global corporations as well
as to the Irish financial sector (e.g. hedging, trading, custody, treasury and payment services), their lending
activity is actually focused on large corporates outside of Ireland.
From an Irish consumer perspective, it is hence unfortunate that two foreign-owned banks (Ulster Bank
Ireland and KBC Ireland) have decided to withdraw from the Irish market, leading to a major reallocation of
market shares among the three remaining retail banks that have provisionally agreed to purchase
performing assets of the exiting banks. According to the most recent Post-Programme Surveillance Report
Ireland, the two banks withdrawing from Ireland are actively looking for buyers of their non-performing loan
portfolio. That report in any case also finds that an additional retail bank serving the Irish market should be
beneficial for the banking sector as a whole, for competition between banks and especially for small
business customers, as interest rates on business loans in Ireland are at present among the highest in the
euro area.
The exit of Ulster Bank and KBC Bank from the Irish market is apparently creating some problems, as the
Irish Central Bank reminded banks in Ireland in a letter dated 27 April 2022 that they need to do more to
ensure that all customers are catered for when the two banks leave the country: “The need for this volume
of customers to move accounts (of which a significant number are primary active personal current accounts)
in the planned timeframe is unprecedented in the Irish market and requires all parties involved to play their
part in ensuring it is executed successfully. Current accounts in particular are important in the everyday lives of
consumers and business alike and play a significant role in the orderly functioning of the economy and the
integrity of the market.” (emphasis added)
Finance Minister Donohoe made a statement on the future of banking in Ireland, published on 1 July 2021,
saying that the sector is currently in a state of flux, and that the recent announcements, including the closure
of bank branches, give the Ministry cause to reflect on the sector’s structure and consider its future. He
announced that his Department will undertake a broad-ranging review “to look in detail at the many
relevant issues including: the societal expectations of the sector and possible gaps in terms of competition and
consumer choice, including delivery channels, and the key role of the banking sector in the provision of
sustainable credit to the economy. The review will need to assess the availability of credit to SMEs from both banks
and non-banks and identify market gaps or failures and consider options to further develop the mortgage
market.” The terms of reference for that review have been published in November 2021; the press critically
remarked that the review is headed by officials at the Department of Finance, despite the State's dual role
as biggest shareholder in the shrinking pool of Irish lenders.
12 PE 699.538Economic Dialogue with Ireland 11 May 2022 Ireland in any case wants to sell the stakes that it holds in Irish banks and return them fully into private ownership. In July 2021, Donohoe announced his intention to sell part of the State’s 13.9% directed shareholding in Bank of Ireland (by end of January this year, the State was no longer the largest shareholder in Bank of Ireland, having sold further tranches of shares that reduced its stake to below 7%, see notification). In December 2021, Donohoe furthermore announced the partial sale of the 71% stake in Allied Irish Banks over six months, setting the stage for the country’s biggest bank to exit majority state ownership. Disclaimer and Copyright The content of this document is the sole responsibility of the author and any opinions expressed therein do not necessarily represent the officia l position of the European Parliament. It is addressed to the Members and staff of the EP for their parliamentary work. Reproduction and translation for non-commercial purposes are authorised, provided the source is acknowledged and the European Parliament is given prior notice and sent a copy. © European Union, 2022. Contact: egov@ep.europa.eu This document is available on Internet at: www.europarl.europa.eu/supporting-analyses PE 699.538 13
IPOL | Economic Governance Support Unit

Annex 1: Euro area - Key macroeconomic indicators
                                           2017           2018         2019          2020         2021                          2022f           2023f
 Real GDP growth – % change on previous year
 Euro area                                  2.6            1.8          1.6           -6.4          5.4                           4.0            2.7
 Ireland                                    8.9            9.0          4.9            5.9         13.5                           5.5            4.5
 GDP per capita – purchasing power parities, Euro
 Euro area                                33,000         34,000       35,000        33,300       35,700                           n.a             n.a
 Ireland                                  61,800         67,000       72,400        74,900       84,000                           n.a             n.a
 General government budget balance – % of GDP
 Euro area                                  -0.9           -0.4         -0.6          -7.2          -7.1                         -3.9            -2.4
 Ireland                                    -0.3           0.1          0.5           -5.1          -1.9                         -1.7            -0.3
 General government structural budget balance * – % of potential GDP
 Euro area                                  -0.9           -0.9         -1.0          -0.8          -0.7                         -1.0            -1.1
 Ireland                                    -1.5           -2.5         -3.3          -2.9          -3.1                         -3.1            -3.1
 General government gross debt ** – % of GDP
 Euro area                                 87.9           85.8         83.8           97.2         95.6                           n.a             n.a
 Ireland                                   67.8           63.1         57.2           58.4         56.0                           n.a             n.a
 Interests paid on general government debt – % of GDP
 Euro area                                  1.9            1.8          1.6            1.5          1.5                           n.a             n.a
 Ireland                                    2.0            1.6          1.3            1.0          0.8                           n.a             n.a
 Inflation (HICP) – % change on previous year
 Euro area                                  1.5            1.8          1.2            0.3          2.6                           3.5            1.7
 Ireland                                    0.3            0.7          0.9           -0.5          2.4                           4.6            2.5
 Unemployment – % of labour force
 Euro area                                  9.1            8.2          7.6            8.0          7.7                           n.a             n.a
 Ireland                                    6.7            5.8          5.0            5.9          6.2                           n.a             n.a
 Youth unemployment – % of labour force (15 – 24 years)
 Euro area                                 11.5           10.9         10.5           11.6         10.7                           n.a             n.a
 Ireland                                   10.9           10.1         10.1           12.0          7.7                           n.a             n.a
 Current account balance ** – % of GDP
 Euro area                                                                                                                        n.a             n.a
 Ireland                                    0.5            5.2         -19.9          -2.7         13.9                           n.a             n.a
 Exports – % change on previous year
 Euro area                                  5.6            3.6          2.7           -9.1         11.0                           n.a             n.a
 Ireland                                    9.6           11.5         10.4            9.5         16.6                           n.a             n.a
 Imports – % change on previous year
 Euro area                                  5.2            3.8          4.7           -9.0          8.8                           n.a             n.a
 Ireland                                    1.2            3.3         41.7           -7.4          -3.7                          n.a             n.a
 Total investments – % change on previous year
 Euro area                                  3.9            3.1          6.8           -7.0          4.2                           n.a             n.a
 Ireland                                    -0.6           -8.9        99.5          -22.9         -37.6                          n.a             n.a
 Total investments – % of GDP
 Euro area                                 20.6           21.0         22.1           21.9         22.0                           n.a.           n.a.
 Ireland                                   33.3           28.2         53.6           39.7         23.5                           n.a.           n.a.
 General government investments – % of GDP
 Euro area                                  2.6            2.7          2.8            3.0          3.0                           n.a             n.a
 Ireland                                    1.9            2.0          2.3            2.3          2.0                           n.a             n.a
 Total final consumption expenditure – % change on previous year
 Euro area                                  1.6            1.4          1.5           -5.4          3.6                           n.a             n.a
 Ireland                                    2.6            4.2          4.2           -5.2          5.6                           n.a             n.a
 Households final consumption expenditure – % change on previous year
 Euro area                                  1.8            1.5          1.3           -8.0          3.5                           n.a             n.a
 Ireland                                    2.2            3.8          3.2          -11.1          5.7                           n.a             n.a
 Income Inequality (Gini Coefficient) – Scale 0-100: 0 = total income equality; 100 = total income inequality
 Euro area                                 30.4           30.6         30.2           30.3           n.a                          n.a             n.a
 Ireland                                   30.6           28.9         28.3           28.3           n.a                          n.a             n.a
 Unit labour cost – nominal – % change on previous year
 Euro area                                  0.7            1.9          1.8            4.5          -0.1                          n.a             n.a
 Ireland                                    -2.7           -3.0         1.4           -4.7          -5.2                          n.a             n.a
Source: all indicators, if not indicated differently, are from Eurostat, with data extracted on 02/05/2022; forecasts (f) and (*) are from DG ECFIN/AMECO; the
euro area is defined as variable composition (EA18-2014, EA19); the euro area general government gross debt is non-consolidated for intergovernmental
loans; (**) from the European Economic Forecasts Winter 2022.

                                                                            14                                                              PE 699.538
Economic Dialogue with Ireland 11 May 2022
Annex 2: Ireland: Macroeconomic Imbalance Scoreboard
Indicators Threshold 2013 2014 2015 2016 2017 2018 2019 2020 2021
3 year average -4/+6% -1.2 -0.3 2.3 0.4 0.2 0.5 -4.7 -5.8 -2.9
Current account balance
as % of GDP
Year value - 1.6 1.1 4.4 -4.2 0.5 5.2 -19.9 -2.7 13.9
Net international investment position
-35% -133.6 -164.6 -198.4 -172.7 -167.3 -183.6 -193.5 -174.0 -138.9
as % of GDP
% change (3 years ) ± 5% -3.8 -3.6 -6.4 -7.1 -6.3 2.3 -1.5 -1.3 -2.6
Real effective exchange rate -
External imbalances 42 trading partners
% change y-o-y - 1.6 -0.8 -7.2 0.9 0.0 1.3 -2.8 0.3 0.0
and competitiveness
% change (5 years) -6% -1..8 -14.8 37.6 58.3 71.0 78.6 73.4 50.0 -
Share of world exports
% change y-o-y 1.8 13.1 40.7 4.0 1.4 6.4 9.9 21.7 -
% change (3 years) 9% -1.7 -3.4 -19.3 -16.2 -14.4 -1.7 -4.3 -6.3 -8.4
Nominal unit labour cost
% change y-o-y - 0.3 -4.7 -15.6 4.1 -2.7 -3.0 1.4 -4.7 -5.2
House prices % change y-o-y deflated 6% 0.0 15.7 10.7 7.2 9.8 8.1 0.3 -0.2 4.3
Private sector credit flow as % of GDP 14% -1.4 2.6 -2.3 -15.8 0.3 -8.8 -9.6 -1.8 -
Private sector debt as % of GDP 133% 266.1 276.6 304.0 283.2 249.8 231.2 209.4 188.9 -
General government gross debt
Internal imbalances (EDP concept) as % of GDP
60% 120.0 104.3 76.7 74.3 67.8 63.1 57.2 58.4 56.0
3 year average 10% 14.9 13.7 11.9 10.1 8.4 7.0 5.8 5.5 -
Unemployment rate
Year value - 13.8 11.9 10.0 8.4 6.7 5.8 5.0 5.7 -
Total Financial Sector Liabilities
16.5% 2.1 19.5 9.6 1.5 4.2 5.2 15.3 7.2 -
% change y-o-y , non-consolidated
Activity rate % 15-64 total pop.
-0.2% 0.2 0.6 1.0 0.9 0.9 0.8 0.6 -0.8 -
(3 year change)
Employment Long-term unemployment active pop. 15-74
0.5% 1.1 -2.2 -3.9 -3.8 -3.6 -3.2 -2.6 -1.7 -
indicators (3 year change).
Youth unemployment % active pop. 15-24
2% -1.4 -6.2 -10.6 -9.9 -9.0 -6.4 -4.3 0.9 -
(3 year change)
Source: Eurostat MIP Scoreboard indicators, data updated on 02 May 2022, see also AMR 2022.
Indicators above/ below the thresholds
PE 699.538 15IPOL | Economic Governance Support Unit
Annex 3: 2019, 2020 and 2021 Country Specific Recommendations
2021 fiscal
2019 CSRs Assessment of implementation 2020 CSRs
IE recommendations
SGP: - of 2019 CSRs SGP: CSR 1
SGP: 1, 2, 3
MIP: CSR 1, 3 February 2020 MIP: CSR 1, 2, 4
MIP: -
1. Achieve the MTO objective in 2020. Limited Progress (this overall assessment of 1. Take all necessary measures, in line 1. In 2022, pursue a supportive fiscal
CSR 1
Use windfall gains to accelerate the country-specific recommendation 1 does not with the general escape clause of the stance, including the impulse
reduction of the general government include an assessment of compliance with the Stability and Growth Pact, to provided by the Recovery and
debt ratio. Limit the scope and Stability and Growth Pact). effectively address the COVID-19 Resilience Facility, and preserve
number of tax expenditures, and pandemic, sustain the economy and nationally financed investment.
broaden the tax base. Continue to support the ensuing recovery. When
address features of the tax system economic conditions allow, pursue
that may facilitate aggressive tax fiscal policies aimed at achieving
planning, and focus in particular on prudent medium-term fiscal
outbound payments. Address the positions and ensuring debt
expected increase in age-related sustainability, while enhancing
expenditure by making the investment. Improve accessibility of
healthcare system more cost-effective the health system and strengthen its
and by fully implementing pension resilience, including by responding
reform plans. to the health workforce’s needs and
ensuring universal coverage for
Split into Sub-CSRs primary care.
• Achieve the MTO in 2020. No assessment of compliance with the Stability
Use windfall gains to and Growth Pact.
accelerate the reduction of
the general government
debt ratio.
• Limit the scope and number Limited Progress. Recent revenue measures are
of tax expenditures, and not meaningfully contributing to broadening
broaden the tax base. the tax base. The main revenue-raising measures
in Budget 2020 include an increase in the carbon
tax rate, an increase in the stamp duty on non-
residential property and several anti-avoidance
measures. Some measures introduced for
limiting aggressive tax planning practices may
help broadening the tax base by closing existing
loopholes. Some measures included in the 2002
Budget even broaden the scope for tax
expenditure and narrow the tax base. These
16 PE 699.538Economic Dialogue with Ireland 11 May 2022
include increases in certain tax credits, an
extension of the Help-to-Buy scheme and higher
capital acquisition tax allowances.
• Continue to address features Limited Progress. Aside from the transposition
of the tax system that may of EU Directives in this area, there are some
facilitate aggressive tax additional reforms, such as the extension of
planning, and focus in transfer pricing rules to non-trading transactions
particular on outbound and to SMEs, however their effectiveness in
payments. addressing the issue of aggressive tax planning
remains to be seen.
• Address the expected Limited Progress. Despite some measures to
increase in age-related increase the cost-effectiveness of healthcare,
expenditure by making the expenditure has continued to increase rapidly.
healthcare system more The ambitious Sláintecare reform provides a
cost-effective and by fully credible vision for making the health system
implementing pension universally accessible and sustainable. However,
reform plans. its implementation is endangered by the
difficulties in improving budget management in
the health system to avoid recurrent overspends.
A Health Budgetary Oversight Group was
established in 2019 with the aim of monitoring
and helping control health spending and
staffing numbers within the budget allocation,
and to act as an early warning mechanism for
any variances. The Roadmap for Pension Reform,
published in 2018, aims to address the long term
sustainability of the state pension system.
However, the envisaged reforms have not yet
been finalised. The 2020 Budget has not
reported on any new measures to address these
issues.
2. Provide personalised active Some Progress. 2. Support employment through 2. When economic conditions allow,
CSR 2
integration support and facilitate developing skills. Address the risk of pursue a fiscal policy aimed at
upskilling, in particular for vulnerable digital divide, including in the achieving prudent medium-term
groups and people living in education sector. Increase the fiscal positions and ensuring fiscal
households with low work intensity. provision of social and affordable sustainability in the medium term.
Increase access to affordable and housing. At the same time, enhance
quality childcare. investment to boost growth
potential.
Split into Sub-CSRs
PE 699.538 17IPOL | Economic Governance Support Unit
• Provide personalised active Some Progress. The share of people aged 0-59
integration support and living in households with very low work intensity
facilitate upskilling, in is falling steadily (from 23.9% in 2013 to 13.1% in
particular for vulnerable 2018), although it is still well above the EU
groups and people living in average (8.8%). Measures taken include
households with low work developing a revised activation framework with
intensity. a particular focus on improving the progression
to employment of vulnerable, inactive
individuals by the Department of Employment
Affairs and Social Protection and the launching
of the Social Inclusion and Community
Activation Programme (2018-2022) which
provides funding to tackle poverty and social
exclusion. Ireland’s latest review of the skills
needs of the green economy by the Expert
Group on Future Skills Needs (Expert Group on
Future Skills Needs, 2010) dates back to 2010 and
is now out of date. The Climate Change Advisory
Council has already flagged skill shortages in the
housing sector, but others are expected to arise
as the climate and energy transition progresses.
Measures have been taken to increase basic and
advanced levels of digital skills, but further
efforts would be needed. Only a low percentage
of the population has basic digital skills, which
might hinder their active participation in a
society increasingly reliant on digital tools.
Providing workers with the skills required,
including digital and those for a smooth and just
transition to a climate neutral economy, would
require investing more in education and
training.
• Increase access to affordable Substantial Progress. Participation in early
and quality childcare. childhood education and care from age three is
now well above the EU average (93.1% in 2018),
and participation in formal childcare of those
below three years (34.4%) is at around the EU
average. At the same time, the share of children
aged less than three years in formal childcare for
30 hours or more (at 10.6%) is lower than the EU
average (17.2%). Limited availability of formal
18 PE 699.538Economic Dialogue with Ireland 11 May 2022
childcare in Ireland affects low-income families
to a greater extent. For them, net childcare costs
as a percentage of disposable income were
among the highest in 2018. Recently launched
programmes (National Childcare Scheme, Early
Learning and Care Programme, First 5)
supporting predominantly low-income families
in reconciling work and care are likely to be
effective in increasing access to affordable and
quality childcare, as well as improving female
labour market participation rates in the coming
years.
3. Focus investment-related Some Progress. 3. Continue to provide support to 3. Pay particular attention to the
CSR 3
economic policy on low carbon and companies, in particular SMEs, composition of public finances, on
energy transition, the reduction of especially through measures both the revenue and expenditure
greenhouse gas emissions, ensuring their liquidity. Front-load sides of the national budget, and to
sustainable transport, water, digital mature public investment projects the quality of budgetary measures
infrastructure and affordable and and promote private investment to in order to ensure a sustainable and
social housing, taking into account foster the economic recovery. Focus inclusive recovery. Prioritise
regional disparities. Implement investment on the green and digital sustainable and growth-enhancing
measures, including those in the transition, in particular on clean and investment, in particular
Future Jobs strategy, to diversify the efficient production and use of investment supporting the green
economy and improve the energy, sustainable public transport, and digital transition. Give priority
productivity of Irish firms — SMEs in water supply and treatment, to fiscal structural reforms that will
particular — by using more direct research and innovation and digital help provide financing for public
funding instruments to stimulate infrastructure. policy priorities and contribute to
research and innovation and by the long-term sustainability of
reducing regulatory barriers to public finances, including, where
entrepreneurship. relevant, by strengthening the
coverage, adequacy and
Split into Sub-CSRs sustainability of health and social
• Focus investment-related Some Progress. Some Progress Ireland adopted protection systems for all.
economic policy on low the Climate Action Plan 2019, which represents a
carbon and energy major step towards more ambitious policies and
transition, the reduction of measures to advance in the transition towards a
greenhouse gas emissions, climate neutral economy. The plan should help
steer public, business and household investment
towards low greenhouse gas projects. However,
the impact of the plan on actual investment
decisions will materialise fully only once the
implementation of the range of measures and
PE 699.538 19IPOL | Economic Governance Support Unit
policies progresses over the coming years. The
increase in the carbon tax to €26 per ton and the
stated intention to increase the tax to €80 per
ton by 2030 also sends a positive price signal. In
turn, the decision to raise the shadow price of
carbon in the Public Spending Code will enable
Ireland to better integrate climate impacts in
public investment decisions. Work also
continues towards the adoption of a new
Renewable Electricity Support Scheme. The
National Development Plan 2018-2027 commits
around €30 billion to address the climate and
energy transition, including a substantial
envelope for sustainable transport. However, the
plan and the envelope dedicated to climate
action will not be updated in light of the Climate
Action Plan. A first call for applications under the
€500 million Climate Action Fund led to the
selection of seven projects that will receive €77
million of financial support. Ireland has not
adequately assessed so far the (private and
public) investment needs related to the
transition towards a climate neutral economy,
though this is important for the design of
policies and measures.
• sustainable transport, Some Progress. A very substantial increase in
public clean transport investment is still needed
to ease congestion and reduce carbon
emissions. The return to economic growth and
the sparse spatial distribution of the population
has led to a high share of workers commuting
daily from outside the main cities. This has
aggravated congestion in recent years and
resulted in increasing CO2 emissions and costs.
While the share of passengers using trains or
buses increased by 0.8pps to 17.4% in 2017, the
fleet of buses and trains is still highly reliant on
diesel engine. The National Development Plan
2018-2027 has committed to promote urban
compact growth, to transit to low emission
buses fleets and to electrify partially the Dublin
20 PE 699.538You can also read