Effects of Montessori Education on the Academic, Cognitive, and Social Development of Disadvantaged Preschoolers: A Randomized Controlled Study in ...
←
→
Page content transcription
If your browser does not render page correctly, please read the page content below
Child Development, xxxx 2021, Volume 00, Number 0, Pages 1–20

    Effects of Montessori Education on the Academic, Cognitive, and Social
    Development of Disadvantaged Preschoolers: A Randomized Controlled
                   Study in the French Public-School System
 Philippine Courtier , Marie-Line Gardes, and                                                 Ira A. Noveck
          Jean-Baptiste Van der Henst                                                  CNRS & Université de Paris
           CNRS, INSERM, & Université de Lyon

                  Marie-Caroline Croset                                  Justine Epinat-Duclos, Jessica Léone, and
                    Université de Grenoble                                          Jérôme Prado
                                                                                CNRS, INSERM, & Université de Lyon

     Previous research on Montessori preschool education is inconsistent and prone to analytic flexibility. In this
     preregistered study, disadvantaged preschoolers in a French public school were randomly assigned to either
     conventional or Montessori classrooms, with the latter being adapted to French public education. Adaptations
     included fewer materials, shorter work periods, and relatively limited Montessori teacher training. Cross-sec-
     tional analyses in kindergarten (N = 176; Mage = 5–6) and longitudinal analyses over the 3 years of preschool
     (N = 70; Mage = 3–6) showed that the adapted Montessori curriculum was associated with outcomes compara-
     ble to the conventional curriculum on math, executive functions, and social skills. However, disadvantaged
     kindergarteners from Montessori classrooms outperformed their peers on reading (d = 0.68). This performance
     was comparable to that of advantaged children from an accredited Montessori preschool.

Social and economic disparities have a tremendous                    4 and tend to grow over time (Jordan & Levine,
impact on the academic, cognitive, and socioemo-                     2009; OECD, 2016). Thus, it is increasingly believed
tional development of children and adolescents. For                  that interventions aimed at reducing inequalities
example, in the United States and across Europe,                     should focus on early childhood, a period of
socioeconomic status (SES) explains up to 15% of the                 enhanced brain plasticity during which cognitive
variance in reading and math performance of high-                    skills may be the most responsive to cognitive and
schoolers (OECD, 2016). Disadvantaged children also                  social stimulation (Thomas & Knowland, 2009). This
lag behind more advantaged peers on measures of                      has led to a renewed interest in preschool programs
cognitive and socioemotional abilities (Farah, 2017).                as a way to reduce the influence of SES disparities
These SES-related differences emerge as early as age                 on early childhood development (Campbell et al.,
                                                                     2014; Duncan & Magnuson, 2013).
   We owe a debt of gratitude to A. Gascher and all of the teach-       Interest in early childhood education emerges
ers from both schools. This research would not have been possi-      from a large body of evidence showing that struc-
ble without their involvement and dedication to the project. We
also thank A. Aguesse, L. Anguenot, M. Barilaro, C. Belanger, E.     tured preschool programs can have a positive impact
Bonassi, J. Bouvier, L. Brusset, A. Couderc, M. Coux, O. Debain,     on school readiness and cognitive development of
M. Debus, F. Desbois, M. Duclos, A. Dussol, J. Fassaya, M. Jac-      disadvantaged children (Campbell et al., 2014; Heck-
quel, Y. Jay, L. Longo, A. Martin, C. Murat, M. Patureau, J. Phi-
lip, M. Pottelain, J. Prost, M. Rengade, S. Reynaud, I. Rouine, L.   man, Moon, Pinto, Savelyev, & Yavitz, 2010). To
Ruty, E. Schuld, S. Serhane, M. Sordet, S. Souici, M. Vigne, A.      date, policies have largely focused on structural fac-
Vittoz, C. Wable and E. Zimmerman for their assistance in col-       tors such as teacher qualification (Jackson, Rockoff,
lecting the data. Finally, we are grateful to all of the children
who participated in this study. This research was supported by
funding from the Institut Carnot de l’Éducation Auvergne Rhône
Alpes (ICE—AuRA PR06). The content is solely the responsibility      © 2021 The Authors. Child Development published by Wiley Periodicals
of the authors and does not necessarily represent the official        LLC on behalf of Society for Research in Child Development.
view of the funder.                                                  This is an open access article under the terms of the Creative Commons
   Correspondence concerning this article should be addressed to     Attribution-NonCommercial-NoDerivs License, which permits use and
Philippine Courtier or Jérôme Prado, Centre de Recherche en        distribution in any medium, provided the original work is properly cited,
Neurosciences de Lyon, CH Le Vinatier, 95 bd Pinel, 69675 Bron       the use is non-commercial and no modifications or adaptations are made.
Cedex, France. Electronic mail may be sent to philippine.courtie     0009-3920/2021/xxxx-xxxx
r@gmail.com or jerome.prado@univ-lyon1.fr                            DOI: 10.1111/cdev.13575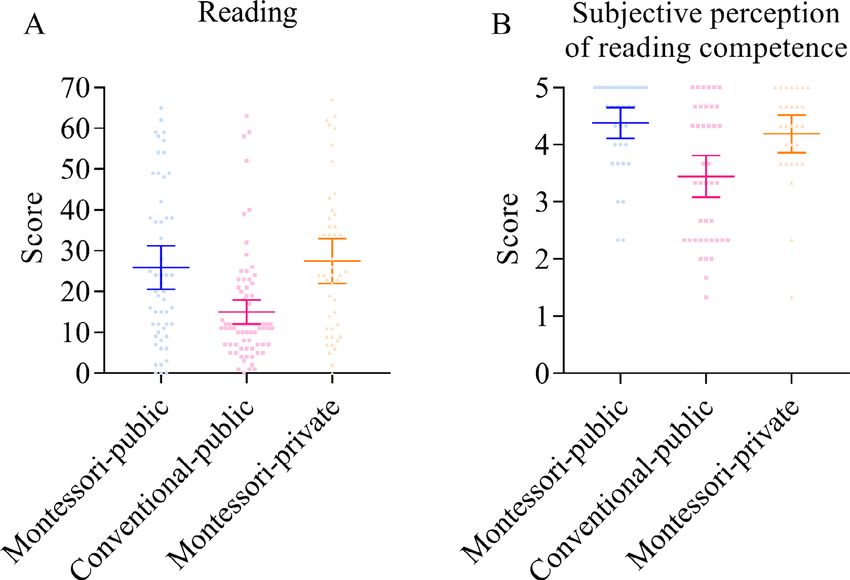
2   Courtier et al.

& Staiger, 2014), class sizes (Chetty et al., 2011), or     conventional preschool classrooms. Indeed, conven-
physical learning environment (Sabol, Soliday Hong,         tional classrooms tend to have same-aged children
Pianta, & Burchinal, 2013). But preschool programs          who are placed in small or whole group, and who
may also vary widely in terms of content and type           make use of a more diverse set of play materials
of instruction (i.e., the curriculum) that children are     (Lillard, 2012). Yet, there have been recent claims
exposed to (Jenkins et al., 2018). For instance, pre-       that the Montessori preschool curriculum is more
school curricula might differ with respect to peda-         consistent with principles of learning and develop-
gogical tools and materials (e.g., concrete vs.             ment than conventional curricula (Lillard, 2019;
abstract), role of the teacher (e.g., leading activities    Marshall, 2017). For example, children in Montes-
vs. supporting children-led activities), organization       sori classrooms systematically learn to read using
of instruction (e.g., small or whole group vs. individ-     multisensorial activities and a phonetic approach,
ualized), and use of assessments (e.g., explicit vs.        consistent with the literature on both embodied
implicit). Yet, relatively little is known about the pre-   cognition (Kontra, Goldin-Meadow, & Beilock,
school curricula that are the most effective, particu-      2012; Pouw, van Gog, & Paas, 2014) and reading
larly for low SES children (Jenkins et al., 2018).          acquisition (Castles, Rastle, & Nation, 2018).
                                                            The Montessori math curriculum also stresses the
                                                            importance of understanding the correspondence
         The Montessori Preschool Curriculum
                                                            between numerical symbols and quantities, in keep-
   One particular preschool curriculum that is cur-         ing with studies showing that early symbolic and
rently experiencing a surge in popularity across            arithmetic knowledge predict later math compe-
many Western countries is the Montessori method.            tence (Jordan, Kaplan, Ramineni, & Locuniak, 2009;
In the United States alone, Montessori programs have        Merkley & Ansari, 2016). Because Montessori class-
expanded from a small number of private schools in          rooms are highly organized and involve a relatively
the 1970s to approximately 4,500 schools nowadays           strict set of rules and principles, it has also been
(including more than 500 public schools; Debs, 2016).       argued that Montessori education may promote the
The Montessori approach is named after Maria                growth of executive functions (Diamond & Lee,
Montessori, an early 20th-century Italian physician,        2011; Lillard, 2019). Finally, open and multiage
who developed a pedagogical method initially aimed          Montessori classrooms may offer an environment
at helping children with intellectual disability as well    with rich, collaborative, and varied social interac-
as typically developing preschoolers from low-in-           tions that may foster early socioemotional skills
come families in Rome. Montessori education                 (McClellan & Kinsey, 1997). Thus, there are reasons
revolves around the idea that children “best learn by       to believe that Montessori preschool education may
absorbing and interacting with different aspects of         lead to greater academic, cognitive, and social out-
their environment, as opposed to being directly             comes than conventional education in young chil-
taught specific knowledge and skills” (Ackerman,             dren.
2019, p. 2). As such, Montessori education relies
on a specific organization and physical environ-
                                                             Previous Research on Montessori Preschool Education
ment, with mixed-age classrooms that are open
and have well-defined spaces for different parts of             However, research evaluating the impact of
the curriculum (e.g., language, math; Lillard &             Montessori education is scarce (see Appendix S1 for
McHugh, 2019a). It also involves specific pedagogical        a list of recent studies). Findings are also inconsis-
tools, including a set of highly organized multisensory     tent. For instance, while some studies have found
and auto-corrective materials that are presented by         that children in Montessori classrooms have better
highly trained teachers and are designed to promote         reading (Lillard, 2012; Lillard & Else-Quest, 2006),
learning through action and manipulation at the             math (Chisnall & Maher, 2007; Denervaud, Knebel,
child’s own pace (Lillard & McHugh, 2019a).                 Hagmann, & Gentaz, 2019; Laski, Vasilyeva, &
Because Montessori pedagogy aims to promote                 Schiffman, 2016; Lillard & Else-Quest, 2006), execu-
self-directed learning, children are allowed to             tive functions (Denervaud et al., 2019; Lillard, 2012;
freely choose their activities. Accordingly, the role       Lillard & Else-Quest, 2006), and social skills (Lil-
of Montessori teachers is more to guide and sup-            lard, 2012; Lillard & Else-Quest, 2006; Lillard et al.,
port each child’s learning trajectory than to               2017) than children in conventional classrooms,
directly teach content (Lillard & McHugh, 2019b).           other studies have found no advantage on similar
   Overall, Montessori preschool education involves         measures of math (Chisnall & Maher, 2007; Lillard,
methods that often differ from those found in most          2012; Mix, Smith, Stockton, Cheng, & Barterian,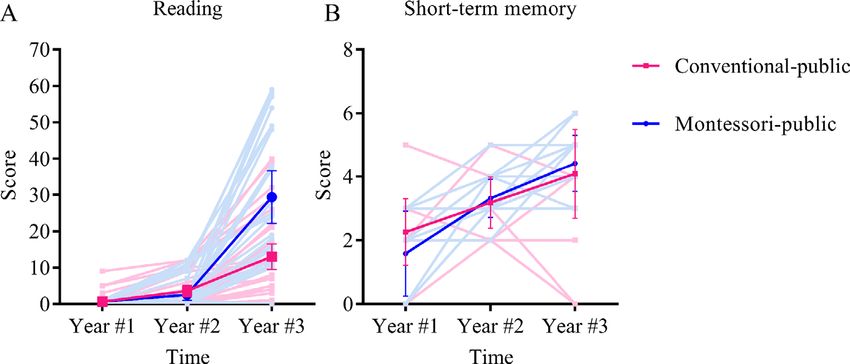
Effects of Montessori Preschool Education   3

2017), executive functions (Denervaud et al., 2019;            Fourth, prior studies employed frequentist statis-
Lillard & Else-Quest, 2006; Lillard et al., 2017), and      tics to compare Montessori to conventional class-
social skills (Lillard, 2012; Lillard et al., 2017). Fig-   rooms, which can make it difficult to know
ure S1 summarizes the number of previously                  whether a lack of difference between groups may
reported effects in favor or against Montessori pre-        support the null hypothesis (i.e., no difference
school education as a function of the domain.               between Montessori and preschool education;
   Furthermore, prior studies have five flaws that            Wagenmakers, Lee, Lodewyckx, & Iverson, 2008) or
limit the generalization of their findings (Marshall,        may reflect a lack of power.
2017). First, parents who voluntarily choose a                 Finally, prior studies often involve a number of
Montessori preschool for their children are likely to       different variables that may not always be analyzed
differ from other parents with regard to their              in the same way (e.g., similar measures may be
involvement in education. Those parents who                 averaged in one study and not in another; Lillard &
choose Montessori are arguably not representative           Else-Quest, 2006; Lillard et al., 2017). This raises
of most families. One way to confront this would            questions about analytical flexibility and makes it
be to (a) randomly assign students to either a              difficult to parse out exploratory from confirmatory
Montessori or a conventional classroom and; (b)             results (Simmons, Nelson, & Simonsohn, 2011). Yet,
investigate children whose parents do not specifi-           to our knowledge, no prior study on Montessori
cally choose a Montessori preschool. However,               education has preregistered its hypotheses and
most prior studies have not used a random assign-           methods.
ment of children (thus confounding effects of peda-
gogy with parental involvement; for a review see
                                                                               Current Study
Ackerman, 2019). Additionally, the two studies that
did use a lottery design (Lillard & Else-Quest, 2006;          While addressing the shortcomings of prior stud-
Lillard et al., 2017) only included children of par-        ies listed above, this study takes advantage of a
ents who opted for enrollment in a Montessori pre-          unique experimental context in which the Montes-
school (raising doubts about the representativeness         sori curriculum was implemented in some (but not
of the study’s sample).                                     all) classrooms of a disadvantaged public preschool
   Second, because most Montessori preschools are           located in the Lyon area in France. All children
tuition-based, they largely enroll children from            from that preschool were randomly assigned (by
high-income families. Even public Montessori pre-           the school) to either Montessori or conventional
schools tend to attract families with a higher              classrooms. Over the course of 4 years, children
income than other preschools (Culclasure, Fleming,          were tested on a range of tasks assessing language,
& Sprogis, 2018; Debs & Brown, 2017). As a result,          mathematical, executive, and social abilities. In a
most prior studies have examined the effect of              cross-sectional experiment (Experiment 1), these
Montessori education on high SES children, which            measures were used to compare the skills of chil-
again makes the findings difficult to generalize to           dren from Montessori classrooms to those in con-
lower income children (but see Lillard & Else-              ventional classrooms at the end of kindergarten. In
Quest, 2006; Lillard et al., 2017).                         a longitudinal experiment (Experiment 2), the same
   Third, preschools greatly vary in the way they           measures were used to track the progress of chil-
implement Montessori education, some being more             dren from preschool entry to the end of kinder-
faithful to the pedagogy than others. This factor           garten (i.e., 3 years of education).
may explain some of the inconsistencies observed               We preregistered hypotheses (based on the cog-
in prior studies. Yet, an objective measure of the          nitive literature and prior studies evaluating
fidelity of implementation of the Montessori peda-           Montessori education), measures, and analytic strat-
gogy has only been collected in a few studies (Lil-         egy for both experiments. Thus, this study reflects a
lard, 2012; Yen & Ispa, 2000). Likewise, previous           primarily confirmatory effort. Data were analyzed
studies have mainly been conducted in the United            using both frequentist and Bayesian statistics. Chil-
States (with some exceptions, e.g., Chisnall &              dren from conventional classrooms followed the
Maher, 2007; Denervaud et al., 2019), where there is        French preschool curriculum, administered by
great heterogeneity in preschool programs and cur-          teachers with the same academic training. This
ricula. Thus, it can be difficult to evaluate to what        ensured homogeneity in the control group (see
extent conventional classrooms may adhere to a              Appendix S3). Children from Montessori class-
homogenous curriculum.                                      rooms      followed     the   Montessori  preschool
4 Courtier et al.
curriculum, which was adapted to the constraints neighborhood and cost-free. Three classrooms in
of public education in France. Such adaptations can this public preschool followed an adaptation of the
be unavoidable because public education will often Montessori curriculum to the context of the French
impose pedagogical and material constraints on public education system (i.e., Montessori-public
programs. To ensure that our findings would be group), whereas five or six classrooms (depending
reproducible and generalizable to other contexts, on the year) followed the conventional French pub-
we took the following three measures. First, we lic curriculum (i.e., Conventional-public group). All
observed and reported the way Montessori educa- children included in the present analyses (see
tion was implemented in public classrooms (see below) were assigned to one of these classrooms by
Appendix S3). Second, we quantified the fidelity of the school when they first enrolled into the public
implementation of the Montessori pedagogy in the preschool at age 3. This assignment was fully ran-
public preschool using a scale developed based on domized except for children with disabilities and
the Montessori curriculum and previous research. staff children (those were excluded from the study).
Finally, we compared the fidelity of implementation The other preschool (i.e., Montessori-private
of the Montessori method in the public preschool to group) included in the study was a private pre-
that of private Montessori preschools in the Lyon school from a neighborhood in which the median
area. We also compared the performance of low equivalized disposable income is €30,020, which is
SES children from the public preschool to the per- well above the French national annual median
formance of high SES children from a private income (see above). Only 8% of individuals living
Montessori preschool accredited by the French affil- in this area have an income that is below the pov-
iate of the Association Montessori Internationale erty threshold. This private preschool received an
(AMI). The AMI, which is the organization Maria official accreditation from the Association Montes-
Montessori and her son founded to carry on her sori de France, which is the French affiliate of the
work, is widely believed to have the highest stan- AMI. As such, it followed a rigorous and high-fi-
dards for Montessori teacher training and imple- delity Montessori curriculum. The school does not
mentation (Lillard, 2012). receive any public funding and entirely relies on
tuitions from parents (€5,100/year).
Data were collected from three cohorts of chil-
Experiment 1 dren in these two schools at the end of their kinder-
garten year, that is, June 2017, June 2018, and June
Method 2019. The experiment was approved by the local
school board and was performed in accordance
Participants
with the ethical standards established by the Decla-
Participants were 196 five- to six-year-olds in ration of Helsinki. Parents gave their written
kindergarten recruited from two preschools in the informed consent and children gave their assent to
Lyon area (France). One preschool was part of the participate in the experiment. Out of the 210 chil-
3-year public preschool system (écoles maternelles) dren, who had been enrolled in their respective
attended by most 3- to 6-year-olds in France schools for 3 years, 14 did not participate in the
(https://www.insee.fr/fr/statistiques/2383587). study because their parents did not give their con-
This public preschool was located in a neighbor- sent. From the original sample of 196 children, chil-
hood in which the median equivalized disposable dren were excluded if they were not fluent in
income is €15,208, which is largely below the French (N = 3), had a diagnosed disability (N = 4),
national median equivalized disposable income changed pedagogy at some point (N = 12), and
(i.e., €20,809, https://www.insee.fr/fr/statistiques/ were related to the staff (N = 1). Therefore, all chil-
4195239). About 33% of individuals living in this dren included in the analyses had received either
area have an income that is below the French pov- 3 years of conventional education (which is stan-
erty threshold. As such, the school is part of the dard in the French public preschool system) or
French “Reinforced Priority Education Network,” a 3 years of Montessori education (which is also stan-
network of schools in which students and teachers dard in Montessori education). Our final sample
benefit from various types of support aimed at comprised 176 children from age 5 to age 6 (86
reducing inequalities and enhancing the academic females). There were 45 children in the Montessori-
achievement of underprivileged students. Enroll- private group, 53 in the Montessori-public group,
ment in public preschools, like everywhere in and 78 in the Conventional-public group. Detailed
France, is reserved for children living in the sample demographics are shown in Table S1.Effects of Montessori Preschool Education 5
Participants from the three groups did not differ considered to be of lower fidelity in the Montessori-
with respect to age (BF01 = 14.29, F(2, 173) = 0.20, public than in the Montessori-private group. How-
p = .82) and gender (BF01 = 12.7, χ2(2, ever, Montessori classrooms from the public pre-
N = 176) = 1.07, p = .59). Background information school were still far more faithful to Montessori
was also collected from parents of a subset of chil- education than the conventional classrooms, which
dren (see Appendix S2 for detailed information). scored very low on our fidelity scale (see Table S2).
Consistent with the demographics of the school
areas (see above), the SES of children from the pub-
Preregistration
lic preschool was relatively low, with an average
monthly household income between €1,500 and Measures and analytic strategy were preregistered
€3,000. In contrast, the SES of children from the pri- via the Open Science Framework (OSF) at https://
vate preschool was higher, with an average osf.io/z2cre. Two additions and a set of modifica-
monthly household income between €3,000 and tions were made to the anticipated analyses since
€5,000. Data on participant ethnicity were not col- the project was preregistered. First, frequentist analy-
lected because the collection of such data is in prin- ses are presented in addition to the preregistered
ciple illegal in France and would require an Bayesian statistics. Second, we decided to include
exceptional waiver from government agencies that the Montessori-private group (which was not prereg-
we did not seek. istered) in Experiment 1 because it provides a useful
A full description of the characteristics of both benchmark against which performance of the
Montessori and conventional classrooms, as well as Montessori-public and Conventional-public groups
a description and results of the scale used to assess can be assessed. Thus, one-way analyses of variance
the fidelity of implementation of Montessori educa- (ANOVAs) were used instead of the preregistered t-
tion, is given in Appendix S3 and Table S2. Briefly, tests. Finally, some changes were made to the calcu-
both the Montessori-private and Montessori-public lation of a few scores to be consistent with prior
groups scored relatively high (i.e., above 80% fide- studies and for the sake of parsimony (these are
lity) on the characteristics and activities scales. How- detailed in Tables 1 and 3).
ever, due to budgetary constraints, Montessori
materials were found to be less numerous in the
Materials
Montessori-public group than in the Montessori-
private group (i.e., 60% vs. 91% fidelity). A com- Children were tested on language, math, and
plete list of the materials present in the Montessori- social competences, as well as on executive func-
public group is given in Appendix S3. Furthermore, tions. The tests assessing language and math skills
to be allowed to operate within the French public are described in Table 1. All these tests except the
education system, the Montessori classrooms in the Tokens test had been used in prior research. The
public school ultimately differed from those in the Tokens test was developed to measure the overall
private school in two respects. First, the public pre- quantitative knowledge of children. It was based on
school had fewer hours of instruction per day than math standards for children in kindergarten in
the private preschool due partly to daily gym France (Ministère de l’Education Nationale & de la
requirements in the French Public schools. For these Jeunesse et des Sports, 2015). The tests assessing
reasons, daily work periods were shorter in the executive functions and social skills (also used in
Montessori-public group than in the Montessori-pri- prior research) are described in Tables 2 and 3.
vate group (1.5–2 hr vs. 2.5 hr, respectively). Sec- In a subset of participants (i.e., children from the
ond, unlike teachers in the Montessori-private last 2 cohorts), we also measured well-being in
group, none of the teachers in the Montessori-pub- school with an adaptation of the Feeling about
lic school were trained in an AMI center at the School (FAS) scale (Valeski & Stipek, 2001). The test
beginning of the experiment. They only held a measured children’s subjective perception of four
degree from a conventional teacher’s college (as is different areas of their school experience: their com-
minimally required in France) and were initially petence in reading, their competence in mathemat-
only largely self-trained in Montessori education ics, their relationship with their teacher, and their
(see Appendix S3 for details about this training). By general attitude toward school. A fifth area was
the end of the study, however, one teacher in the added for the purpose of this study: their relation-
Montessori-public group completed AMI training. ship with their peers. For each area, children
Therefore, the Montessori curriculum might be answered three questions (e.g., “How much do you6 Courtier et al.
Table 1
Descriptions of Tests Assessing Language and Math Abilities
Skill Test Description Scoring
Language
Vocabulary Evaluation du Langage Oral Determine which of four pictures Number of items correctly
(Khomsi, 2001) corresponds to a word given by the answered (0–20)
experimenter
Phonological Evaluation des fonctions Repeat pseudo-words said aloud by the Number of correctly repeated
awareness cognitives et Apprentissages experimenter. There were four two- syllables (0–28)
(Phonologie subtest; Billard syllable pseudo-words, four three-
& Touzin, 2012) syllable pseudo-words and two four-
syllable pseudo-words to repeat
Reading Evaluation Des fonctions Decode letters, then digraphs, increasingly Number of correctly completed
cognitives et des difficult words, and finally sentences. items (0–70)
Apprentissages (Lecture The test was stopped if a child was not
subtest; Billard & Touzin, able to read any of the letters or any of
2012) the digraphs
Pragmatics Scalar task (Stiller, Goodman, & Make pragmatic inferences by constructing Proportion of plausible choices
Frank, 2015) contextually derived “ad-hoc” (non-errors) that are revealing of
implicatures, using sets of pictures with one-feature item choices, i.e.,
contrasting features [pragmatic/(pragmatic + logical)
responses]
Math
Math Woodcock-Johnson III (Applied Respond to 63 increasingly difficult math Number of correctly completed
problem Problems subtest; Woodcock, problems. The first items involved items (0–63)
solving Mather, McGrew, & counting, simple subtraction and
Wendling, 2001) addition, clock reading and calculating
with coins. Items then progress onto
verbal problems. The test is stopped
after participants make six consecutive
errors
Counting Counting task (adapted from Count twice to the highest number known Highest number reached
knowledge Lipton & Spelke, 2005)
Quantitative Tokens Perform 10 quantitative tasks. Children Overall score from 0 to 10
knowledge have to recognize the numerosity of a
given set, create a set given a specific
numerosity, solve simple non-symbolic
arithmetic problems, create a set of the
same numerosity as another distant set,
compare the numerosities of two sets,
recognize the numerosity of a set
created by the addition of two other
sets, recognize the numerosity of a set
created by the subtraction of one set
from another, recognize number
symbols, recognize the position of a
number within a sequence, and use
ordinal information to identify a
position in a sequence
Note. Scores were all consistent with preregistration, with two exceptions. In the counting and tokens tasks, the counting knowledge
score was dissociated from the quantitative knowledge score to facilitate interpretation. In the scalar task, we focused on a global score
for the sake of parsimony.
like going to school?”) with a five-point Likert scale questions to get familiarized with the scale. Raw
(e.g., from “I don’t like it at all” to “I like it a lot”). scores were the mean total scores for each area on
Before starting the test, children had three practice the Likert scale.Effects of Montessori Preschool Education 7
Table 2
Descriptions of Tests Assessing Executive Functions
Skill Test Description Scoring
Short-term Corsi Block Tapping task (Corsi, Repeat a sequence shown by the Maximum number of blocks correctly
and 1972) experimenter by touching blocks glued repeated forward (score = 0–9) for short-
working onto a wooden board. The sequence term memory and maximum number of
memory progressively increases in difficulty. The blocks correctly repeated backward for
sequence is first repeated in the same working memory (score = 0–6)
order as the experimenter, then in
reverse order. For each sequence, there
are four chances to succeed
Self- Head Toes Knees Shoulders task Perform a gesture that is opposite to the Sum of points (0–52)
regulation (Ponitz, McClelland, Matthews, & one shown by the experimenter (e.g.,
Morrison, 2009) touch the toes when asked to touch the
head and the other way around). The
test is made progressively more difficult
by adding knees and shoulders
commands. Children get two points
every time they directly performed the
correct action, one point if they have to
self-correct their action and no point if
they perform an incorrect action
Planning Evaluation Des fonctions Complete three mazes of progressive Sum of the points for all the mazes
cognitives et des Apprentissages difficulty. Each completed maze is worth completed (0–30)
(Planification subtest; Billard & 10 points. Children have a maximum of
Touzin, 2012) 120 s to complete each maze and lose
one or two points depending on their
completion time. The test is stopped if a
child scored 0 at a maze
Note. Scores were all consistent with preregistration.
corrected significance threshold of p = .002 (i.e.,
Procedure
0.05/24 tests). In case of a main effect of group, the
Children were tested individually in a quiet analysis of variance (ANOVA) was followed up by
room of their preschool. The tests were adminis- independent t-tests between groups. Frequentist
tered by different experimenters (graduate students, statistics, however, cannot provide evidence for a
research assistants, and undergraduate students) in null hypothesis. In other words, a nonsignificant
five sessions of approximately 15–20 min. The order effect of the group for a given test would not mean
of sessions was randomized on a child-to-child that a group difference does not exist. Therefore,
basis. No feedback was given to children during we turned to Bayesian statistics to estimate the
testing. Children, teachers, and parents were also strength of evidence (i.e., the Bayes factor, BF) for
not informed about the results during the 3 years the alternate hypothesis of a difference between
of the study. Finally, teachers and parents were groups (H1) versus the null hypothesis of no differ-
blind to the tests until the end of data collection. ence between groups (H0) for each test.
Test scores were entered into a series of Bayesian
ANOVAs with the between-subject factor Group
Analyses
(Conventional-public, Montessori-public, Montes-
Data were analyzed using both frequentist and sori-private). Following Jeffreys (1961), a BF < 3
Bayesian statistics. First, test scores were entered in was considered anecdotal evidence, a 3 < BF < 10
a series of one-way frequentist ANOVAs with the was considered substantial evidence, a 10 < BF <
between-subject factor Group (Conventional-public, 30 was considered strong evidence, a 30 < BF <
Montessori-public, Montessori-private). To account 100 was considered very strong evidence, and a
for the number of tests, the main effect of group BF > 100 was considered extreme evidence that our
was only considered significant at a Bonferroni- data are more likely under the alternate than the8 Courtier et al.
Table 3
Descriptions of Tests Assessing Social Skills
Skill Test Description Scoring
Sharing Dictator Game Share stickers with classmates. Specifically, Number of stickers given (0–10)
(Benenson, Pascoe, & children first choose their 10 favorite
Radmore, 2007) stickers among a choice of 30. They are
then told that, unfortunately, not enough
stickers are available for all of their
classmates. But participants could donate
any number of their stickers to their
classmates (the choice is made while the
experimenter is looking away)
Distributive Resource allocation task Distribute candies to characters in situations Number of candies allocated to the
justice (inspired from of inequality. Three situations are disadvantaged characters in each of the
Huppert et al., 2018) presented (resource inequality between a three conditions (0–4) and in total
rich and a poor character, unequal (0–12)
contribution to a common good between
a hard-working and a lazy character, and
a power inequality between a dominant
and a subordinate character). At the end
of each situation, children are told that
both characters love candies and they
have to distribute 4 candies to the
characters the way they want
Social Social Problem Solving Solve a problem involving a social Number of responses with reference(s) to
competence Task-Revised (object component. Two cartoon children are justice/sharing (0–3; Lillard, 2012), as
acquisition item; shown, one reading a book and the other well as the flexibility (i.e., level of
Rubin, 1988) standing behind him/her (characters novelty) of the second response in
gender matched the gender of the relation to the first response (0–3;
participants). Children are told that the Rubin & Clarke, 1983)
character reading the book has been
reading it for a very long time and that
the other character wants to have the
book. Participants have to imagine what
the character could say or do to get the
book, what else the character could say
or do to get the book, and what they
could themselves say or do if they want a
book that another child is already using.
The same story was used at each testing
session
Theory of Wellman and Liu (2004) Understand the mental state of a character. Number of stories completed successfully
mind task The task involves 5 stories measuring the (0–5)
complexity of theory of mind
understanding (diverse desire, diverse
belief, diverse knowledge, false belief,
hidden emotion). The test is stopped after
two failed stories
Note. Scores were all consistent with preregistration, with two exceptions. In the dictator game, the number of stickers given was used
rather than the number of stickers kept to be consistent with previous studies (Benenson et al., 2007). In the resource allocation task,
the proportion of children who allocated the first candy to the disadvantaged characters was not included for the sake of parsimony.
null hypothesis (i.e., BF10) or under the null evidence for the effects of Montessori education,
hypothesis than the alternate hypothesis (i.e., BF01). we did not choose an informative prior but rather
Given that previous studies provide inconsistent used the default Cauchy distribution prior centeredEffects of Montessori Preschool Education 9
on the null with a width of 0.707 to quantify the children from Montessori public classrooms better
evidence for the alternate hypothesis (that there is readers than children from conventional public
a difference between groups). An effect size of 0 as classrooms, they were also aware of their relatedly
prior was used to quantify evidence for the null high competence.
hypothesis (that there is no difference between Second, there was a main effect of Group on
groups). In case of more than anecdotal evidence the tests measuring math problem solving and
for a main effect of Group, the ANOVA was fol- quantitative knowledge (see Figures 2A and 2B).
lowed up by Bayesian independent t-tests (also However, follow-up analyses indicated that this
with default priors). All analyses were performed effect was entirely driven by the higher scores of
with the JAMOVI software (The Jamovi Project, children from the Montessori-private group.
2019). Specifically, children from the Montessori-private
group had higher math problem solving and
quantitative knowledge scores than children from
Data Availability
both the Montessori-public group (math problem
The data that support the findings of Experiment solving: t(96) = 4.50, p < .001, d = 0.91; quantita-
1 are available via the OSF at https://osf.io/cbr97/ tive knowledge: t(96) = 4.68, p < .001, d = 0.96)
. and the Conventional-public group (math prob-
lem solving: t(120) = 4.60, p < .001, d = 0.86;
quantitative knowledge: t(118) = 3.15, p = .002,
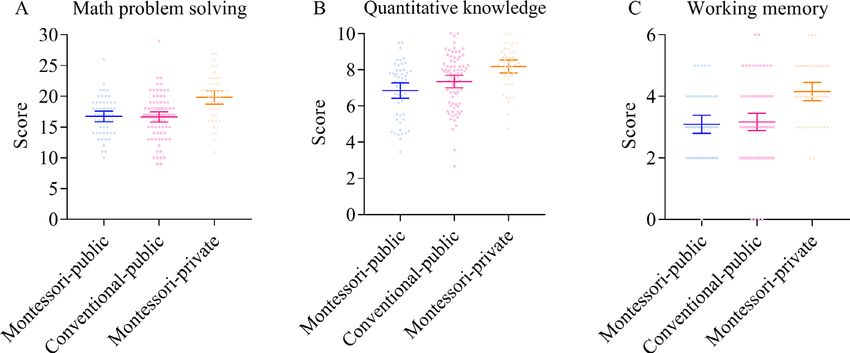
Results and Discussion d = 0.60). There was no difference between the
two groups within the public school (math prob-
Frequentist Results
lem solving: t(128) = 0.12, p = .91, d = 0.02; quan-
Results from the frequentist one-way ANOVAs titative knowledge: t(126) = 1.82, p = .07, d =
are indicated in Table 4 (see Table S3 for exact 0.33). Thus, there was no evidence that Montes-
mean performance on each test). sori education was associated with greater math
First, a significant main effect of Group was skills, as greater performance of children from the
observed on the reading test (see Figure 1A). Fol- Montessori-private group may be attributable to
low-up independent t-tests revealed that children parental differences between the public and the
from the Conventional-public group had lower private school (e.g., income or involvement in
reading scores than children from the Montessori- education).
private group (t(120) = 4.37, p < .001, d = 0.82) and Third, there was a main effect of Group on the
children from the Montessori-public group (t measure of working memory (see Figure 2C). Simi-
(128) = 3.83, p < .001, d = 0.68). There was no dif- lar to math skills, however, the effect was entirely
ference between the two Montessori groups (t driven by the Montessori-private group. T-tests
(96) = 0.42, p = .67, d = 0.09). Therefore, within the revealed that children in the Montessori-private
public preschool (in which classroom assignment group had higher working memory skills than
was randomized), the reading skills of children children in both the Montessori-public group
from Montessori classrooms were higher than the (t(96) = 5.07, p < .001, d = 1.03) and the Conven-
reading skills of children from conventional class- tional-public group (t(120) = 4.57, p < .001,
rooms. The size of this effect (d = 0.68) is consid- d = 0.86). There was no difference between the two
ered very large in education interventions (Kraft, groups within the public school (t(128) = 0.36,
2020). p = .72, d = 0.06). Thus, there was no evidence that
A similar pattern was obtained on the scale mea- Montessori education was associated with greater
suring the subjective perception of reading compe- executive functions than conventional education.
tence, for which a main effect of group was also The main effect of Group was significant in none
observed (see Figure 1B). That is, children from the of the other tests (see Table 4).
Conventional-public group reported being less com-
petent with reading than children from both the
Bayesian Results
Montessori-private group (t(67) = 2.90, p = .005,
d = 0.71) and the Montessori-public group (t(74) = Results from the Bayesian one-way ANOVAs are
4.04, p < .001, d = 0.93). There was no difference indicated in Table 4. Of the 24 tests, 20 led to at
between the two Montessori groups with respect to least substantial evidence for either the null (BF01)
this perceived competence with reading (t(61) = or the alternative (BF10). There was at least substan-
0.92, p = .36, d = 0.23). Thus, not only were tial evidence for a lack of difference between the10 Courtier et al. Table 4 Experiment 1: Main Effect of Group (Montessori-Public, Conventional-Public, Montessori-Private) for Each Test in the Frequentist and Bayesian ANOVAs Skill df F p η2p BF10 BF01 Language Vocabulary 2, 172 5.77 .004 .06 7.9 0.13 Phonological awareness 2, 172 3.22 .042 .04 0.95 1.08 Reading 2, 172 10.70 < .001 .11 10.70 0.09 Pragmatic skills 2, 167 0.93 .40 .01 0.14 7.14 Math Math problem solving 2, 172 13.28 < .001 .13 > 100 < 0.01 Counting knowledge 2, 169 0.38 .69 < .01 0.08 12.5 Quantitative knowledge 2, 169 10.19 < .001 .11 > 100 < 0.01 Executive functions Short-term memory 2, 172 3.81 .02 .04 1.52 0.65 Working memory 2, 172 13.76 < .001 .14 > 100 < 0.01 Self-regulation 2, 172 4.95 .008 .05 4.19 0.23 Planning 2, 101 1.59 .21 .03 0.32 3.13 Social abilities Sharing 2, 173 0.48 .62 .01 0.09 11.11 Distributive justice (overall) 2, 173 1.68 .19 .02 0.25 4 Distributive justice (resources) 2, 173 0.60 .55 .01 0.1 10 Distributive justice (common good) 2, 173 1.52 .22 .02 0.22 4.55 Distributive justice (power) 2, 173 2.10 .13 .02 0.35 2.86 Social competence (justice) 2, 173 1.68 .19 .02 0.25 4 Social competence (flexibility) 2, 173 4.62 .01 .05 3.30 0.30 Theory of mind 2, 173 2.62 .08 .03 0.54 1.85 Feeling about school Teacher relationship 2, 101 0.82 .44 .02 0.17 5.79 Peer relationship 2, 101 1.27 .28 .02 0.25 3.95 Reading competence 2, 101 9.90 < .001 .16 > 100 < 0.01 Math competence 2, 101 0.62 .54 .01 0.14 6.72 General attitude 2, 101 0.66 .52 .01 0.15 6.58 Note. Frequentist statistics: The Bonferroni-corrected significance threshold was p < .002. Significant results are in bold. η2p s represent effect sizes that can be considered small (.01), medium (.06) or large (.14; Cohen, 1988). Degrees of freedom vary because sample sizes change depending on the measure (some participants were absent or refused to complete certain tests). Bayesian statistics: BFs > 3 are indicated in bold. BF10 indicates the strength of the evidence for the alternative (there is a group difference), whereas BF01 values indi- cate the evidence for the null (there is no group difference). ANOVAs = analyses of variance. groups in the tests measuring pragmatic skills, children from both the Montessori-private groups counting knowledge, planning, sharing, distributive (BF10 > 100) and the Montessori-public group justice (overall score as well as resources and com- (BF10 > 100). There was also substantial evidence mon goods subtests), social competence (reference for a lack of difference between the Montessori- to justice), and all measures of FAS except subjec- public and the Montessori-private groups (BF01 = tive perception of reading competence. 4.35). Therefore, Bayesian analyses not only show In contrast, there was at least substantial evi- that children from the Montessori-public group dence for a difference between the groups in the have higher reading skills than children from the tests measuring vocabulary, reading, math prob- Conventional-public group, they also indicate that lem-solving, quantitative knowledge, working children from the Montessori-public group have memory, self-regulation, social competence (flexibil- similar reading skills than children from the ity of the response), and subjective perception of Montessori-private group. Considering the gap in reading competence (see Table 4). In the test mea- reading achievement typically observed between suring reading (see Figure 1A), follow-up t-tests children from different SES backgrounds (Bucking- indicated extreme evidence that children from the ham, Wheldall, & Beaman-Wheldall, 2013), this lack Conventional-public group had lower scores than of difference is noticeable.
Effects of Montessori Preschool Education           11

Figure 1. Experiment 1: Distribution of scores in the two measures for which the average score was higher in children from the Montes-
sori-public group than from the Conventional-public group. (A) Reading. (B) Subjective perception of reading competence. Each blue,
pink, and orange dot represents the score of a child in the Montessori-public, Conventional-public, Montessori-private group (respec-
tively). Error bars represent 95% confidence intervals.

Figure 2. Experiment 1: Distribution of scores in the three measures for which the average score was higher in children from the
Montessori-private group than in the other groups. (A) Math problem solving. (B) Quantitative knowledge. (C) Working memory. Each
blue, pink, and orange dot represents the score of a child in the Montessori-public, Conventional-public, Montessori-private group (re-
spectively). Error bars represent 95% confidence intervals.

   Similarly, in the scale measuring subjective per-                  group than in the Montessori-public group (BF10 >
ception of reading competence (see Figure 1B),                        100). There was anecdotal evidence for the lack of
there was substantial evidence for a lower score in                   difference between the two Montessori groups,
the Conventional-public group than in the Montes-                     (BF01 = 2.70). Therefore, Bayesian analyses indi-
sori-private group (BF10 = 7.99) and extreme evi-                     cated that children from the Montessori-public
dence for a lower score in the Conventional-public                    group perceived being more competent in reading
12   Courtier et al.

than children from the Conventional-public group,          kindergarten in the public preschool, Experiment 2
though there was weak evidence that children from          aimed to answer these questions.
the Montessori-public and the Montessori-private
groups had the same perception.
   In the tests measuring vocabulary, math problem                             Experiment 2
solving, quantitative knowledge, working memory,
and self-regulation, there was at least substantial evi-                           Method
dence that children from the Montessori-private
                                                           Participants
group had higher scores than children from both the
Montessori-public group (all BF10s > 3.83) and the             Participants were a subset of public-school stu-
Conventional-public group (all BF10s > 8.14). Within       dents from Experiment 1 whom we were able to
the public preschool, there was also substantial evi-      follow from preschool entry to the end of kinder-
dence that the two groups did not differ on tests of       garten (i.e., 3 years of education). Initially, 119 stu-
vocabulary (BF01 = 4.55), math problem solving             dents were tested during their first year of
(BF01 = 5.26), and working memory (BF01 = 5; see           preschool. From the original sample of 119 children
Figure 2) as well as anecdotal evidence that the two       (69 in Conventional-public and 50 in Montessori-
groups did not differ on tests of quantitative knowl-      public), 23 left the school at some point during the
edge (BF01 = 1.18) and self-regulation (BF01 = 1.64).      study (12 in Conventional-public and 11 in Montes-
Thus, Bayesian analyses indicated that Montessori          sori-public) and 11 did not have parental consent
education was not associated with better outcomes          for testing at all time points (7 in Conventional-
than conventional education in these tests. Again,         public and 4 in Montessori-public). We also
differences between the private and the public             excluded children who were not fluent in French (2
groups may be attributable to parenting differences        in Conventional-public and 1 in Montessori-public),
as much as differences in curriculum.                      changed pedagogy at some point (11 left Conven-
   Finally, in the test of social competence, there        tional-public for Montessori-public), and were
was substantial evidence that children from the            related to the staff (1 in Montessori-public). Our
Conventional-public group were more flexible in             final sample was therefore composed of 70 students
their response than children from both the                 (33 participants in the Montessori-public group and
Montessori-private group (BF10 = 3.63) and the             37 participants in the Conventional-public group).
Montessori-public group (BF10 = 6.66). There was           Sample demographics are detailed in Table S4. Par-
also a substantial difference for a lack of difference     ticipants from the two groups did not differ with
between the two Montessori groups (BF01 = 4.76).           respect to age (BF01 = 3.85, t(66) = 0.30, p = .77)
This result might suggest that children from Montes-       and gender (BF01 = 3.32, χ2(2, N = 70) = 0.09,
sori classrooms may be less used to finding ways to         p = .77). Participants whose parents filled our home
deal with conflictual situations (e.g., they typically do   environment questionnaire (23 parents from the
not ask for materials when another child uses it but       Conventional-public group and 11 parents from the
rather wait for it to be available). However, it needs     Montessori-public group) indicated that the sub-
to be interpreted with caution because it was not pre-     groups did not differ in household income (BF01 =
dicted and not observed in frequentist statistics.         2.86, t(31) = 0, p = 1), number of siblings (BF01 =
   Overall, results from both frequentist and Baye-        1.96, t(32) = 1.01, p = .32), and languages at home
sian analyses indicate that Montessori education           (BF01 = 1.85, t(32) = 1.09, p = .28).
does not lead to wide-ranging benefits in all mea-
sures of academic, cognitive, and social skills. How-
                                                           Preregistration
ever, the Montessori curriculum clearly appears to
promote reading skills in kindergarten-aged chil-             Measures and analytic strategy were preregis-
dren. Because Experiment 1 was a cross-sectional           tered via the OSF at https://osf.io/pabz3. Those
study that focused on children at the end of kinder-       were faithful to the preregistration, except for the
garten, it remains unclear (a) when a difference in        additional use of frequentist analyses and the slight
reading performance may emerge between children            changes in some scores (see Tables 1 and 3).
from Montessori and conventional classrooms dur-
ing the preschool period and (b) whether any dif-
                                                           Materials
ference between pedagogies may be observed
before kindergarten. By tracking the progress of              The tests used at each time point of Experiment
children from preschool entry to the end of                2 are identical to those described for Experiment 1
Effects of Montessori Preschool Education 13
(see Tables 1–3). The only exceptions are (a) the test
Data Availability
measuring planning skills and (b) the scale measur-
ing FAS. We introduced those at a later stage in the The data that support the findings of Experiment
study and could only collect longitudinal data on a 2 are available via the OSF at https://osf.io/4knh2/.
small subset of participants. Therefore, these two
tests were not analyzed in Experiment 2. In addi-
Results
tion, only nine subtests of the test measuring quan-
titative knowledge are analyzed in Experiment 2 Frequentist Results
(compared to 10 subtests in Experiment 1) because
Average performance by test, group, and time
the last subtest was also added at a later stage dur-
point is indicated in Table S5. Results from the
ing the study.
frequentist 2 × 3 ANOVAs with the between-sub-
ject factor Group and the within-subject factor
Procedure Time indicated a main effect of Time for the
large majority of the tests (see Table S6). This
Testing procedures and test sessions were the
indicated that performance generally improved
same as in Experiment 1. Data were collected over
with age across both groups. There was a main
three time points from two cohorts of children. The
effect of group for the reading test (see Table
first time point was at the beginning of their first
S7), which was qualified by an interaction
year of preschool (i.e., in October 2015 for cohort #1
between Group and Time (see Table 5). Follow-
and in October 2016 for cohort #2). The second time
up t-tests revealed that whereas the two groups
point was halfway during their second year of pre-
did not differ from one another at Year #1 (t
school (i.e., January 2017 for cohort #1 and January
(63) = 1.74, p = .09, d = 0.43) and Year #2 (t
2018 for cohort #2), The third and final time point
(63) = 0.96, p = .34, d = 0.24), children from the
was at the end of their kindergarten year (third
Montessori group outperformed children from
year of preschool; i.e., June 2018 for cohort #1 and
the Conventional-public group at Year #3 (t
June 2019 for cohort #2). At each time point, five to
(63) = 4.32, p < .001, d = 1.07; see Figure 3A). In
seven experimenters collected the data.
other words, the benefits of Montessori education
on the growth of reading skills were not visible
Analyses before kindergarten. The interaction between
Group and Time was significant in none of the
As in Experiment 1, longitudinal data in Experi-
other tests, indicating that Montessori education
ment 2 were analyzed using both frequentist and
did not impact the growth of any other skills in
Bayesian statistics. First, test scores were entered in a
this longitudinal sample.
series of 2 × 3 frequentist ANOVAs with the
between-subject factor Group (Conventional-public,
Montessori-public) and the within-subject factor Bayesian Results
Time (Year #1, Year #2, Year #3). To account for the
As shown in Table S6, evidence for an effect of
number of tests, effects were only considered signifi-
Time was at least substantial on most tests. This
cant at a Bonferroni-corrected significance threshold
indicated that performance improved with age.
of p = .003 (i.e., 0.05/18 tests). In case of an interac-
There was no more than anecdotal evidence for a
tion between Group and Time, the ANOVA was fol-
main effect of Group in all tests except for the social
lowed up by independent t-tests between groups.
competence test (reference to justice), for which
Bayesian statistics were further used to estimate
there was substantial evidence (see Table S7). This
the strength of evidence (i.e., BF) for the alternate
main effect, however, was entirely driven by a
hypothesis of a difference in development between
higher score for children from the Conventional-
groups (H1) versus the null hypothesis of no differ-
public than the Montessori-public group at Year #2
ence in development between groups (H0) for each
(see Table S5). More importantly, there was extreme
test. Test scores were entered into a series of Baye-
evidence for an interaction between Group and
sian ANOVAs with the between-subject factor
Time for the reading test (see Table 5). Follow-up
Group (Conventional-public, Montessori-public,
Bayesian t-tests revealed anecdotal evidence for a
Montessori-private) and the within-subject factor
lack of a difference between the two groups at Year
Time (Year #1, Year #2, Year #3). Default priors
#1 (BF01 = 1.11), and Year #2 (BF01 = 2.63). How-
were used. All analyses were performed with the
ever, there was extreme evidence that children from
JAMOVI software (The Jamovi Project, 2019).14 Courtier et al.
the Montessori-public group outperformed children measuring vocabulary, phonological awareness,
from the Conventional-public group at Year #3 pragmatic skills, counting knowledge, sharing, dis-
(BF10 > 100; see Figure 3A). Thus, in line with fre- tributive justice, and theory of mind. Therefore,
quentist statistics, Bayesian analyses indicated that with the notable exception of reading, there was
the large gap in reading skills between children evidence that the growth of academic, cognitive,
from Montessori classrooms and children from con- and social skills was largely similar in children
ventional classrooms only emerged at the end of from Montessori classrooms and children from con-
kindergarten. ventional classrooms. Results from both Experiment
The only other test in which there was more than 1 and Experiment 2 are discussed in the following
anecdotal evidence for an interaction between section.
Group and Time was the measure of short-term
memory (see Table 5). As shown in Figure 3, this
effect was mainly driven by a difference between
General Discussion
the groups at baseline (i.e., Year #1). Indeed, Baye-
sian t-tests indicated anecdotal evidence that chil- Overall, our cross-sectional and longitudinal find-
dren from the Conventional-public group ings largely support the null hypothesis (i.e., no dif-
outperformed children from the Montessori-public ference between the Montessori and the
group at Year #1 (BF10 = 2.30), whereas there was conventional preschool curriculum) in the majority
anecdotal evidence that the groups had a similar of competences tested here. For example, we found
performance at Year #2 (BF01 = 2.94) and Year #3 that children in Montessori-private group outper-
(BF01 = 2.32). Finally, evidence for a lack of interac- formed children from the Conventional-public
tion between Group and Time was at least substan- group (who followed the French national curricu-
tial for most of the other tests, including tests lum) on measures of reading, math skills, and
Table 5
Experiment 2: Interaction Between Group (Montessori-Public, Conventional-Public) and Time (Year #1, Year #2, Year #3) for Each Test in the Fre-
quentist and Bayesian ANOVAs
Skill df F p η2p BF10 BF01
Language
Vocabulary 2, 132 1.55 .22 .02 0.23 4.35
Phonological awareness 2, 126 0.01 .99 < .01 0.08 12.5
Reading 2, 126 22.26 < .001 .26 > 100 < 0.01
Pragmatic skills 2, 124 0.03 .97 < .01 0.05 20
Math
Math problem solving 2, 124 2.97 .06 .05 1.05 0.95
Counting knowledge 2, 126 0.62 .54 .01 0.11 9.10
Quantitative knowledge 2, 126 3.73 .03 .06 1.44 0.69
Executive functions
Short-term memory 2, 126 5.13 .007 .08 4.75 0.21
Working memory 2, 126 0.70 .50 .01 0.37 2.70
Self-regulation 2, 130 2.09 .13 .03 0.4 2.50
Social abilities
Sharing 2, 130 0.14 .87 < .01 0.04 25
Distributive justice (overall) 2, 130 0.21 .81 < .01 0.1 10
Distributive justice (resources) 2, 130 0.49 .61 .01 0.12 8.33
Distributive justice (common good) 2, 130 0.43 .65 .01 0.08 12.5
Distributive justice (power) 2, 130 0.17 .84 < .01 0.01 100
Social competence (justice) 2, 130 1.60 .21 .02 0.79 1.27
Social competence (flexibility) 2, 130 2.21 .11 .03 0.43 2.32
Theory of mind 2, 128 0.75 .48 .01 0.12 8.33
Note. Frequentist statistics: The Bonferroni-corrected significance threshold was p < .003. Significant results are in bold. η2p s represent effect
sizes that can be considered small (.01), medium (.06) or large (.14; Cohen, 1988). Degrees of freedom vary because sample sizes change
depending on the measure (some participants were absent or refused to complete certain tests). Bayesian statistics: BFs > 3 are indicated
in bold. BF10 indicates the strength of the evidence for the alternative (there is an interaction between Group and Time), whereas BF01 val-
ues indicate the evidence for the null (there is no interaction between Group and Time). ANOVAs = analyses of variance.You can also read