Efficiency of beach clean-ups and deposit refund schemes (DRS) to avoid damages from plastic pollution on the tourism sector - in Cape Town, South ...
←
→
Page content transcription
If your browser does not render page correctly, please read the page content below
Efficiency of beach clean-ups
and deposit refund schemes
(DRS) to avoid damages
from plastic pollution on the
tourism sector
 in Cape Town, South Africa

Authors: Jain, A., Raes, L., Manyara, P.
May 2021

GLOBAL MARINE AND POLAR PROGRAMME

About IUCN
IUCN is a membership Union uniquely composed of both government and civil society organisations.
It provides public, private and non-governmental organisations with the knowledge and tools that
enable human progress, economic development and nature conservation to take place together.

Created in 1948, IUCN is now the world’s largest and most diverse environmental network, harnessing
the knowledge, resources and reach of more than 1,400 Member organisations and some 18,000
experts. It is a leading provider of conservation data, assessments and analysis. Its broad membership
enables IUCN to fill the role of incubator and trusted repository of best practices, tools and
international standards.

IUCN provides a neutral space in which diverse stakeholders including governments, NGOs, scientists,
businesses, local communities, indigenous peoples organisations and others can work together to
forge and implement solutions to environmental challenges and achieve sustainable development.

www.iucn.org
twitter.com/IUCN/

Efficiency of beach clean-ups
and deposit refund schemes
(DRS) to avoid damages
from plastic pollution on the
tourism sector
 in Cape Town, South Africa
Authors: Jain, A., Raes, L., Manyara, P.

This policy brief is the summary of the Master’s thesis for University of
Nantes, 2019-2020. The thesis was completed at IUCN, Switzerland as
part of the Marine Plastics and Coastal Communities (MARPLASTICs)
project. The following report is an analysis of the costs and benefits
of current beach clean-ups in Cape Town, and it aims to estimate the
cost efficiency of implementing a Deposit Refund Scheme (DRS) in
conjunction with beach clean-ups. (Full Thesis).
The designation of geographical entities in this book, and the presentation of the material, do not imply the
expression of any opinion whatsoever on the part of IUCN or other participating organisations concerning the
legal status of any country, territory, or area, or of its authorities, or concerning the delimitation of its frontiers or
boundaries.

The views expressed in this publication do not necessarily reflect those of IUCN or other participating
organisations. IUCN is pleased to acknowledge the support of its Framework Partners who provide core funding:
Ministry for Foreign Affairs of Finland; Government of France and the French Development Agency (AFD); the
Ministry of Environment, Republic of Korea; the Norwegian Agency for Development Cooperation (Norad);
the Swedish International Development Cooperation Agency (Sida); the Swiss Agency for Development and
Cooperation (SDC) and the United States Department of State.

This publication has been made possible by funding from the Swedish International Development Cooperation
Agency (Sida) from the Marine Plastics and Coastal Communities (MARPLASTICCs) project in Kenya,
Mozambique, South Africa, Thailand and Viet Nam.

Published by:              IUCN, Gland, Switzerland, Global Marine and Polar Programme

Copyright:                 © 2021 International Union for Conservation of Nature and Natural Resources

                           Reproduction of this publication for educational or other non-commercial purposes
                           is authorised without prior written permission from the copyright holder provided
                           the source is fully acknowledged. Reproduction of this publication for resale or other
                           commercial purposes is prohibited without prior written permission of the copyright
                           holder.

Citation:                  Jain, A., Raes, L., Manyara, P., Efficiency of beach clean-ups and deposit refund schemes
                           (DRS) to avoid damages from plastic pollution on the tourism sector in Cape Town,
                           South Africa. Switzerland: IUCN. 10 pp.

Authors:                   Aanchal Jain, Leander Raes (Economic Knowledge Unit, IUCN),
                           Peter Manyara (IUCN ESARO)

Editors:                   Jennifer Ross-Jones, Lynn Sorrentino (Publication Coordinator)

Reviewers IUCN:            Janaka de Silva, Lynn Sorrentino

Cover Photo:               Beach in Kenya, White Rhino Films.

Design and layout:         Imre Sebestyén, jr / Unit Graphics

Available from:            IUCN (International Union for Conservation of Nature)
                           Global Marine and Polar Programme (GMPP)
                           Rue Mauverney 28
                           1196 Gland
                           Switzerland
                           Tel +41 22 999 0000
                           Fax +41 22 999 0002
                           www.iucn.org/theme/marine-and-polar/our-work/close-plastic-tap-programme/reports
Table of contents
Introduction . . . . . . . . . . . . . . . . . . . . . . . . . . . . . . . . . . . . . . . . . . . . . . . . . . . . . . . . . . . . . . . . . . . . . . . . . . . . . . . . . . . . . . . . . . . . . . . . . . . . . . . . . . . . . . . . . . . . . . . . . . . . . . . . . . . . 1
Impacts of beach litter on tourism and its economic cost . . . . . . . . . . . . . . . . . . . . . . . . . . . . . . . . . . . . . . . . . . . . . . . . . . . . . . . . . . . . 1
Measures to remove plastic litter from the coastlines. . . . . . . . . . . . . . . . . . . . . . . . . . . . . . . . . . . . . . . . . . . . . . . . . . . . . . . . . . . . . . . . . . . 1
Study area . . . . . . . . . . . . . . . . . . . . . . . . . . . . . . . . . . . . . . . . . . . . . . . . . . . . . . . . . . . . . . . . . . . . . . . . . . . . . . . . . . . . . . . . . . . . . . . . . . . . . . . . . . . . . . . . . . . . . . . . . . . . . . . . . . . . 1
Study objective. . . . . . . . . . . . . . . . . . . . . . . . . . . . . . . . . . . . . . . . . . . . . . . . . . . . . . . . . . . . . . . . . . . . . . . . . . . . . . . . . . . . . . . . . . . . . . . . . . . . . . . . . . . . . . . . . . . . . . . . . . . . 2
Results. . . . . . . . . . . . . . . . . . . . . . . . . . . . . . . . . . . . . . . . . . . . . . . . . . . . . . . . . . . . . . . . . . . . . . . . . . . . . . . . . . . . . . . . . . . . . . . . . . . . . . . . . . . . . . . . . . . . . . . . . . . . . . . . . . . . . . . . . . . . . 4
Impacts on tourism revenue . . . . . . . . . . . . . . . . . . . . . . . . . . . . . . . . . . . . . . . . . . . . . . . . . . . . . . . . . . . . . . . . . . . . . . . . . . . . . . . . . . . . . . . . . . . . . . . . . . . . . . . 4
Impact on tourism employment. . . . . . . . . . . . . . . . . . . . . . . . . . . . . . . . . . . . . . . . . . . . . . . . . . . . . . . . . . . . . . . . . . . . . . . . . . . . . . . . . . . . . . . . . . . . . . . . . . 4
Beach cleaning efficiency for all coastal plastic litter. . . . . . . . . . . . . . . . . . . . . . . . . . . . . . . . . . . . . . . . . . . . . . . . . . . . . . . . . . . . . . . . . . . 4
Beach cleaning efficiency for plastic bottles. . . . . . . . . . . . . . . . . . . . . . . . . . . . . . . . . . . . . . . . . . . . . . . . . . . . . . . . . . . . . . . . . . . . . . . . . . . . . . . . 4
Impact on plastic bottle collection with the implementation of a DRS . . . . . . . . . . . . . . . . . . . . . . . . . . . . . . . . . . . . . . . 4
Total cost of clean beaches (with beach clean-ups and DRS). . . . . . . . . . . . . . . . . . . . . . . . . . . . . . . . . . . . . . . . . . . . . . . . . . . . . . . 5
Cost efficiency of clean beaches . . . . . . . . . . . . . . . . . . . . . . . . . . . . . . . . . . . . . . . . . . . . . . . . . . . . . . . . . . . . . . . . . . . . . . . . . . . . . . . . . . . . . . . . . . . . . . . . . 7
Impact on employment after DRS implementation . . . . . . . . . . . . . . . . . . . . . . . . . . . . . . . . . . . . . . . . . . . . . . . . . . . . . . . . . . . . . . . . . . . 7
Sensitivity Analysis. . . . . . . . . . . . . . . . . . . . . . . . . . . . . . . . . . . . . . . . . . . . . . . . . . . . . . . . . . . . . . . . . . . . . . . . . . . . . . . . . . . . . . . . . . . . . . . . . . . . . . . . . . . . . . . . . . . . . . . 7
Conclusion. . . . . . . . . . . . . . . . . . . . . . . . . . . . . . . . . . . . . . . . . . . . . . . . . . . . . . . . . . . . . . . . . . . . . . . . . . . . . . . . . . . . . . . . . . . . . . . . . . . . . . . . . . . . . . . . . . . . . . . . . . . . . . . . . . . . . . 9
Bibliography. . . . . . . . . . . . . . . . . . . . . . . . . . . . . . . . . . . . . . . . . . . . . . . . . . . . . . . . . . . . . . . . . . . . . . . . . . . . . . . . . . . . . . . . . . . . . . . . . . . . . . . . . . . . . . . . . . . . . . . . . . . . . . . . . . 10Introduction
Introduction
Impacts of beach litter on tourism and its economic cost
Plastic debris is commonly found on many employment (Jang, 2011). According to a survey
beaches (Hammer, 2012). The quantities of conducted in Cape Town, South Africa, clean
plastic debris items found vary greatly over beaches are one of the most important factors
the course of any year and differ by location for tourists; plastic litter can dissuade them
(Thompson et al., 2009a). Accumulation of from coming to the beaches (Ballance, 1996).
plastic debris is greater near densely populated For instance, €25 and €40 million represent
areas and on more frequently visited beaches. the estimated loss in tourism revenue due to
Plastic litter on beaches is primarily sourced coastal litter in South Korea and California,
from adjoining land areas (Hammer, 2012). The respectively (Jang et al., 2014; Leggett et al.,
build-up of plastic litter on beaches can have a 2014). Dirty beaches also increase the costs for
large impact on a country’s economy, wildlife, governments, local municipalities, and NGOs
and the physical and psychological wellbeing to ensure clean, attractive, and safe beaches
of individuals (Moore et al., 2001; Donohue et al., for tourists. These costs include the collection,
2001). transportation and disposal of litter, and the
associated administrative costs. In most cases,
The major economic cost of this plastic debris the costs spent on cleaning are justifiable; the
is the reduced aesthetic appeal of coastal areas. benefits harvested from doing so are generally
This adversely affects the tourism industry, much higher (Ryan, 2000).
leading to a loss of output, revenue, and
Measures to remove plastic litter from the coastlines
There are several solutions to address the coastlines. Lastly, addressing consumer
coastal litter problem. Preventative measures behaviours (such as implementing taxes on
include strengthening producers’ extended plastic bottles) can also reduce plastic littering
responsibility, implementing a ‘Deposit Refund by discouraging the consumption of plastic
Scheme’ (DRS), and/or improving waste materials in the first place. This study focuses
management practices. Removal measures on the costs and benefits of implementing DRS
involve the direct removal of litter from the in conjunction with beach-clean up actions.
Study area
This study focuses on Cape Town City, one employment. For instance, the tourism sector
of the most touristic regions in South Africa, directly employed 43,566 people in 2018. Total
where beaches are a natural, focal attraction employment in the tourism sector in Cape Town
(Sowman, 1990). Cape Town is one of the has grown over 2.6% over the last decade (City of
most visited cities in South Africa with 49% Cape Town, 2019).
of international tourists and 20% of domestic
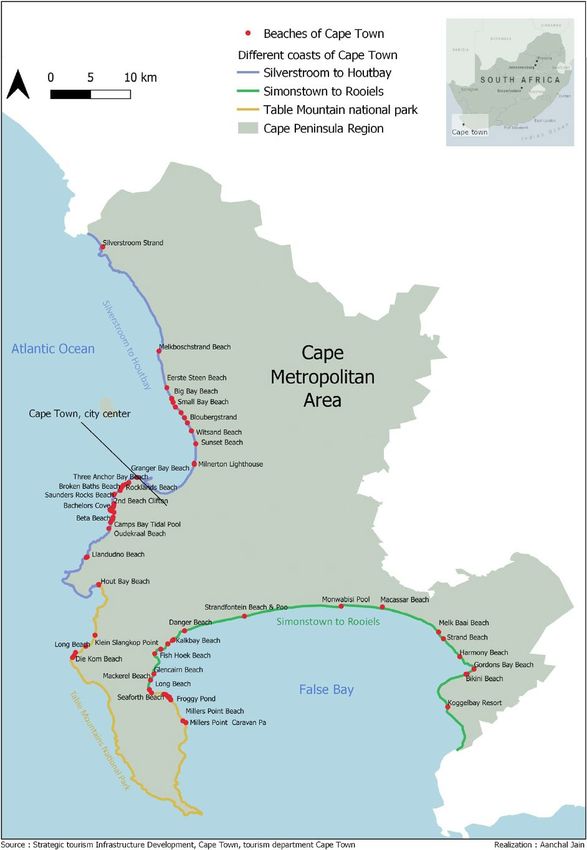
tourists (City of Cape Town, 2019). Tourism in A large number of tourists visit Cape Town,
Cape Town not only contributes significantly which is known for its coastline that stretches
to the region’s GDP, but also generates for approximately 307 km hosting 73
Efficiency of beach clean-ups and deposit refund schemes (DRS) to avoid
damages from plastic pollution on the tourism sector in Cape Town, South Africa
■ 1Introduction
beaches (Figure 1). However, a rapidly growing To target this problem, Cape Town has
economy, touristic pressures, and waste implemented a variety of beach clean-up
streams associated with development and programs, organised at three different levels.
population growth pose an increasing threat First are those organised by the government,
to Cape Town’s valuable beaches by increasing which comprise a majority (90%) of all clean-ups.
the number of pollutants and litter on the The Department of Environment, Forestry and
coastline (Newman, 2019). Plastic accounts for Fisheries (DEEF) of South Africa has launched
94-98% of all the litter on Cape Town beaches various projects to ensure a clean South African
(Takunda, 2019). Continued degradation of coastline, such as ‘Work for the Coast (WFTC)’
beaches could significantly impact Cape and ‘International Coastal Clean-up (ICC)’.
Town’s economy. According to a study on Second, the City of Cape Town Metropolitan
Cape Town, foreign tourists stated that a Municipality also takes care of regular cleaning
drop in cleanliness standards could influence of the coastline and residential areas through its
the choice of beaches frequented; up to 97% waste management department. Third, select
of tourists would not be willing to come to NGOs are engaged in beach cleaning through
beaches with more than ten large items of their own or sponsors’ funding. In addition, a
debris per metre. This reduced expenditure few other local NGOs and individual volunteers
on travel to beaches would correspond are also engaged in conducting clean-ups.
to a considerable decrease in the total
recreational value of beaches and a reduction
in the regional economy (Ballance, 1996).
Study objective
This study aims to: (1) estimate if current beach 86%, 94%, and 100%).2 Lastly, a sensitivity analysis
clean-up efforts in Cape Town, South Africa is carried out verify whether efficiency results
are efficient in avoiding losses in the tourism are consistent if beach tourism is less impacted
revenue sector; and (2) to analyse how the by beach litter than originally assumed.
efficiency of beach cleaning changes with Nine different scenarios are considered for
the implementation of a Deposit Refund the sensitivity analysis, ranging from a 90%
Scheme1(DRS). To estimate the efficiency of a reduction in tourism numbers if coastal litter
DRS, five scenarios are considered with different is not cleaned up, to only a 10% reduction in
return rates of bottles by consumers (i.e. 74%, tourism numbers.
1 When purchasing a product, an individual will pay a deposit for the packing, which is reimbursed when the packaging is
returned. This encourages return and reuse by consumers, and therefore reduces the number of such items ending up as
litter (Numata, 2005).
2 74% is considered as the defining threshold; below this return rate, the deposit rate will go below R 0.1, which is practically
impossible to achieve. The return rates (86%, 94% and 100%) were randomly selected to analyse what happens when the
return rate is increased by 10%.
2 ■ Efficiency of beach clean-ups and deposit refund schemes (DRS) to avoid
damages from plastic pollution on the tourism sector in Cape Town, South AfricaIntroduction
Figure 1: Map of beaches in Cape Town City, South Africa
Efficiency of beach clean-ups and deposit refund schemes (DRS) to avoid
damages from plastic pollution on the tourism sector in Cape Town, South Africa
■ 3Results
Results
Impacts on tourism revenue
Approximately R 7.8 billion could potentially revenue, representing 91% of total coastal
be lost if international tourists are unwilling to tourism revenue and 67% of overall tourism
visit Cape Town’s beaches, and R 591 million in revenue. An estimated 1.5% of the GDP of Cape
the case of domestic tourists.3 Overall, if there is Town could be impacted by the presence of
plastic litter on the beaches, Cape Town could plastic litter that is not cleaned up (City of Cape
lose up to R 8.5 billion in total coastal tourism Town, 2019).
Impact on tourism employment
The revenue which could have been lost in 67.8% of total employment in the total tourism
the absence of beach clean-ups could employ sector and 91% of total employment in coastal
approximately 29,258 people in the tourism tourism in Cape Town would lose their job due
sector. According to the calculation in this study, to the plastic litter on beaches.
Beach cleaning efficiency for all coastal plastic litter
Due to the regular organisation of beach clean- avoided damage), beach clean-ups are a very
ups, Cape Town is avoiding a loss of R 8.5 billion. efficient intervention. For every Rand spent
If the cost of conducting clean-ups (R 13 million on the beach clean-ups, 1.9 g of plastic litter is
per year), is compared to the benefit (i.e. the collected, and R 665 tourism revenue is saved.
Beach cleaning efficiency for plastic bottles
Out of all the waste, plastic bottles were found 9.6, whereas cleaning a single plastic bottle can
to be the most abundant, making up 14% of save an estimated R 6,249. This indicates that
all plastic litter found on the beaches. From an every Rand spent on cleaning up plastic bottles
efficiency perspective, the cost of cleaning one will save R 654 (See Table 3).
single bottle from the coastline is on average R
Impact on plastic bottle collection with the
implementation of a DRS
In addition to beach clean-ups, other is a DRS. This study focuses on the joint
instruments can be employed to reduce plastic implementation of a DRS system for plastic
waste by preventing it from ending up on the bottles alongside beach clean-ups, the latter to
beach in the first place. One such instrument remove the remaining litter from beaches.
3 R = South African Rand currency sign.
4 ■ Efficiency of beach clean-ups and deposit refund schemes (DRS) to avoid
damages from plastic pollution on the tourism sector in Cape Town, South AfricaResults
It is estimated that 635 million bottles are are littered on the coastline. This reduces beach
consumed annually in Cape Town. 245,265 clean-up costs for bottles to R 315,815.
bottles end up as litter without a DRS system
in place (See Baseline, Table I). However, by In the last scenario - with a 100% return rate - no
implementing a DRS - with a 74% of return rate more plastic bottles need to be cleaned from
(DRS 74%)4 - only 66,054 bottles are littered and the beach; only the remaining litter is cleaned
will need to be cleaned through beach clean ups so as not to negatively impact coastal tourism.
(Table 1). This reduces the beach cleaning cost This said, achieving a 100% return rate of plastic
for bottles from R 2,345,290 to R 631,630. bottles is difficult to achieve.
In the second DRS scenario, 87% of bottles are Overall, the presence of a DRS can significantly
collected, which means that only 33,027 bottles reduce the number of bottles littered on beaches
from 245,000 to 15,000 (in scenario DRS 94%).
Table 1: Bottles collected through DRS and beach clean-ups with different return rates
Impact on beach
Impact on DRS system
clean-ups
Scenarios Return Deposit Bottles Bottles not Cost of DRS Bottles Cost cleaning
Rate rate returned returned (ZAR) littered on bottles from
(ZAR)5 beaches beaches (ZAR)
Without DRS - - - - - 245,264 2,345,290
DRS 74% 74% 0.1 470,000,116 165,135,176 128,927,191 66,054 631,630
DRS 87% 87% 2.3 552,567,704 82,567,588 136,097,546 33,027 315,815
DRS 94% 94% 11.6 597,027,174 38,108,117 139,638,422 15,243 145,761
DRS 100% 100% 46.56 635,135,291 0 142,851,791 0 0
Total cost of clean beaches (with beach clean-ups and DRS)
Jointly implementing a DRS and beach proportion of DRS costs spent on the collection
clean-ups decreases the total costs to clean of bottles (which could have otherwise ended
the coastline. For example, in Scenario 2 (DRS up on beaches). Contrary to Table 1, which
74%), the total cost to clean beaches decreases shows the total costs of the DRS, Table 2 only
from R 13 million to 11 million. This is because shows the proportional DRS costs for bottles
an increased DRS cost decreases the bottles that would have otherwise ended up on the
littered on beaches, which reduces beach clean- beach. The purpose here is not to show the
up costs by at least 14%. If 100% of bottles are costs incurred to collect plastic, but to show the
returned, the beach clean-up cost will further costs incurred to clean beaches.
decrease by R 1 million. As the number of bottles
returned to DRS increases, fewer bottles are Figure 2 depicts two types of data: (1) DRS costs
littered on the beaches. As a result, this reduces limited to beaches (which are 4% of the total
the overall beach clean-up costs. DRS set-up costs, and 96% lower than the beach
clean-up costs); and (2) beach clean-up costs
Table 2 provides the total beach clean-up (which decrease with the introduction of a DRS).
costs (not limited to plastic bottles), and the
4 DRS74% represents the scenario where only 74% of bottles are returned back to the system.
Efficiency of beach clean-ups and deposit refund schemes (DRS) to avoid
damages from plastic pollution on the tourism sector in Cape Town, South Africa
■ 5Results
Table 2: Total costs to clean beaches through beach clean-ups and DRS
Total cost to clean
Cost of cleaning Cost of beach
Scenarios beaches with both
beaches with DRS (ZAR) clean-ups (ZAR)
interventions (ZAR)
Without DRS 13,029,387 13,029,387
DRS 74% 51,571 11,367,299 11,315,728
DRS 87% 54,439 11,054,352 10,999,913
DRS 94% 55,855 10,885,713 10,829,858
DRS 100% 57,141 10,741,238 10,684,097
Figure 2: Different DRS scenarios
Figure 3: DRS related costs to clean-up the bottles from the beaches
6 ■ Efficiency of beach clean-ups and deposit refund schemes (DRS) to avoid
damages from plastic pollution on the tourism sector in Cape Town, South AfricaResults
Cost efficiency of clean beaches
Table 3 shows the efficiency of combining the plastic enters the ocean (Moore et al., 2001). A
different systems, with the efficiency being DRS can also benefit the waste management
calculated as ‘benefits/costs’ or ‘avoided loss department, leading to increased recycling, and
for the tourism sector/costs of the system’. The decreased landfill costs.
efficiency increases when the two systems are
operated together.
Table 3: Efficiency of combining DRS and beach
clean-ups to avoid losses for the tourism sector
For the purposes of this study, efficiency was
calculated according to the economic benefits
Scenarios Cost Efficiency estimate
for the tourism sector, i.e. the avoidance of
losing tourists due to pollution of beaches. Without DRS 654
All other potential benefits generated from DRS 74% 749
implementing one of the two interventions
DRS 87% 770
or a combination of both, are not considered
for this study. Other benefits include, for DRS 94% 782
example, positive impacts on marine wildlife DRS 100% 793
and improved marine water quality as less
Impact on employment after DRS implementation
The implementation of a DRS has the potential placed for beach clean-up; and hence, some of
to generate many other benefits in addition these jobs will be lost. However, even if 100% of
to avoiding damage to the tourism sector. bottles are returned, an estimated total of 1,028
Most importantly, a DRS can potentially create jobs (including lost jobs) could be generated
at least 741 jobs, including employment for by the two interventions being implemented
collecting the bottles in big stores (2 workers together. This would account for at least 2.34%
per big retail store) and administrative staff of the total jobs in the tourism sector. Thus, the
(15 employees). Furthermore, an estimated implementation of a DRS, with ongoing beach-
350 jobs are created through beach clean-ups. clean ups could support economic recovery
By contrast, the increasing return rate from a through green job creation.
DRS will decrease the efforts that have to be
Sensitivity Analysis
As tourists become less sensitive to plastic This shows that as the importance of clean
pollution, the efficiency of beach cleaning beaches decreases for tourists, the impact
efforts is reduced as well, as less benefit on avoiding losses in the tourism revenue
(avoided losses) is generated from the same decreases, as tourists will spend or visit the
cost. For example, in the first scenario (without beaches as usual. This decreases the value of
DRS), the cost efficiency decreases from 654 to the externality that plastic debris on beaches
72 with a reduction in tourist sensitivity from is causing; the lower the externality value, the
90% to 10%. Similarly, in the second scenario lower the efficiency will be. For instance, if 90%
(DRS with 74% return rate), the cost efficiency of tourists are concerned by littered beaches,
also decreases from 749 to 82 with a reduction every R 1 spend on cleaning beaches will bring
in tourist sensitivity from 90% to 10%. R 654 into the economy. If only 30% of tourists
are concerned by littered beaches, the efficiency
will decrease to R 111 for every R1 spent. However,
Efficiency of beach clean-ups and deposit refund schemes (DRS) to avoid
damages from plastic pollution on the tourism sector in Cape Town, South Africa
■ 7Results
even under these scenarios, the beach cleaning with a DRS. The cost efficiency increases as the
solutions are still efficient, as the avoided losses DRS return rates increase. At the same time,
are higher than every rand spent on reducing the efficiency will decrease as fewer tourists
the number of plastic bottles on beaches. are affected by beach litter and as the tourists’
sensitivity decreases.
In summary, to clean beaches, beach clean-
ups are more efficient if implemented along
Table 4: Total Cost Efficiency of beach clean-ups and DRS with varied tourists’ sensitivity
Change in tourists’ sensitivity towards beach litter (%)
DRS Scenario 90% 80% 70% 60% 50% 40% 30% 20% 10% 0%
Total Cost Efficiency
Without DRS 654 575 503 431 359 287 215 144 72 0
DRS74% 749 659 576 494 412 329 247 165 82 0
DRS87% 770 677 593 508 423 339 254 169 85 0
DRS94% 782 688 602 516 430 344 258 172 86 0
DRS100% 793 697 610 523 436 348 261 174 87 0
8 ■ Efficiency of beach clean-ups and deposit refund schemes (DRS) to avoid
damages from plastic pollution on the tourism sector in Cape Town, South AfricaConclusion
Conclusion
This study shows how the presence of marine tourism of 90%, every rand spent on cleaning
plastic pollution on can have a major impact beaches will help Cape Town avoid a loss of
on the tourism sector, potentially reducing R 654. By contrast, with the implementation
tourism revenue and employment by up to of a DRS, every rand spent by Cape Town on
91%. By spending R 13 billion on regular beach cleaning beaches will avoid losses of R 749 to R
clean-ups, Cape Town avoids a damage of an 793 for the tourism sector.
estimated R 8.5 billion.
In addition, the implementation of a DRS
Adopting a Deposit Refund Scheme in system can contribute to the creation of jobs
combination with the current beach clean- in retail, bottle collection, waste management,
up practices could reduce the cost of beach as well as administrative staff to ensure the
cleaning by an estimated 14%. The reduction in smooth functioning and implementation of
the number of plastic bottles on beaches and the DRS. While not considered for the purposes
the cost of a DRS will continue decreasing as of this study, other potential benefits are also
the bottle return rates increase; in other words, generated from the implementation of a DRS.
the DRS will become more efficient. Jointly These benefits include: a reduction in waste
implementing the two interventions increases management and collection costs, reduced
the overall cost efficiency of keeping the landfill costs, reduced household waste disposal
beaches clean. Without a DRS system in place, costs, reduced illegal dumping, increased
and considering a potential reduction in beach recycling, and improved marine water quality.
Efficiency of beach clean-ups and deposit refund schemes (DRS) to avoid
damages from plastic pollution on the tourism sector in Cape Town, South Africa
■ 9Bibliography
Bibliography
Abalansa, S. (2020). The Marine Plastic Litter Issue: Jones, M.M. (1995). Fishing debris in the Australian
A Social-Economic Analysis, Sustainability, 12(20): marine environment. Marine Pollution Bulletin, 30(1):
p. 12, Available at: https://www.researchgate.net/ p. 30, Available at: doi: 10.1016/0025-326X(94)00108-L.
publication/349140134_The_Marine_Plastic_Litter_
Issue_A_Social-Economic_Analysis. Legett, C., Scherer, N., Curry, M. & Bailey, R., and
Haab, T. (2014). Assessing the economic benefits of
Ballance, A. (1996). The Recreational use value of reductions in marine debris: A pilot study of beach
beaches in the Cape Peninsula, South Africa. M.Sc. recreation in Orange County, California, National
Thesis, University of Cape Town. Oceanic and Atmospheric Administration, p. 44,
Available at: http://marinedebris.noaa.gov/sites/default/
City of Cape Town, Williams S., Crous M., Ryneveldt, files/MarineDebrisEconomicStudy.pdf.
L. (2019). Economic Performance Indicators for Cape
Town, Available at: http://www.capetown.gov.za/ Moore, W.K, Scott, D.L. (1983). Beverage container
work%20and%20business/doing business in the city/ deposit laws: a survey of the issues and results, The
businsssupport and guidance/economic reports/ Journal of Consumer Affairs, 17(1): p. 57 80, Available at:
Economic%20resources%20and%20publication. https://www.jstor.org/stable/23859188?seq=1.
Derraik, J. (2002). The pollution of the marine Nelson, C. and Botrill, D. (2002). Evaluating the
environment by plastic debris: a review, Marine contribution of beach quality wards to the local
Pollution Bulletin, 44 (9), Available at: https://doi. tourism industry in Wales the Green Coast Award.
org/10.1016/S0025-326X(01)00139-4. Ocean and Coastal Management, Ocean and Coastal
Management, 45 (2-3): p.45, Available at: doi: 10.1016/
Donohue, M.J., Boland, R.C., Sramek, C.M., and S0964-5691(02)00053-4.
Antonelis, G.A. (2001). Derelict fishing gear in the
north western Hawaiian Islands: diving surveys and Newman, B. & Taaljard S. (2019). Know your Coast,
debris removal in 1999 confirm threat to coral reef City of Cape Town, p.5, Available at: https://resource.
ecosystems. Marine Pollution Bulletin, 42 (12): p.14, capetown.gov.za/documentcentre/Documents/
Available at: doi: 10.1016/s0025-326x(01)00139-4. City%20research%20reports%20and%20review/
Know%20Your%20Coast%202019.pdf.
Galgani, F., Hanke, G., Werner, S., Oosterbaan, L.,
Nilsson, P., Fleet, D., et al. (2013). Monitoring guidance Ryan P.G. (1988). The characteristics and distribution
for marine litter in European Seas, JRC Scientific and of plastic particles at the sea surface off the
Policy Reports, Report EUR 26113 EN, p. 120, Available southwestern Cape Province, South Africa. Marine
at: https://circabc.europa.eu/w/browse/85264644 ef32 Environmental Research, 25(4): p. 25, Available at: doi:
401bb9f1 f640a1c459c2. 10.1016/0141-1136(88)90015-3.
Galgani, F., Piha, H., Hanke, G., Werner, S., and MSFD Sowman, M. (1990). The Status of Coastal
GES Technical group. (2011). Marine litter: Technical Zone Management in South Africa, Coastal
recommendations for the implementation of MSFD Management, 21(3); p. 21, Available at: doi:
requirements, Publications Office of the European 10.1080/08920759309362201.
Union, Available at: http://publications.jrc.ec.europa.eu/
repository/handle/111111111/22826 Takunda Y.C., von Blottnitz, H. (2019). Accumulation
and characteristics of plastic debris along five beaches
Hess, N.A.; Ribic, C.A., and Vining, I. (1999). Benthic in Cape Town, Marine Pollution Bulletin, 138, Available
marine debris with an emphasis on fishery related at: doi: 10.1016/j.marpolbul.2018.11.065
items, surrounding Kodiak Island, Alaska, 1994 1996,
Marine Pollution Bulletin, 38(10): p.38, Available at: doi: Tudor, D. T., Williams, A. T. (2008). Important aspects
10.1016/S0025-326X(99)00087-9. of beach pollution to managers: Wales and the Bristol
Channel, UK. Journal of Coastal Research, 243: p. 735
Hidalgo Ruz, V., & Thiel, M. (2015). The contribution of 745, Available at: https://doi.org/10.2112/06-0727.1.
citizen scientists to the monitoring of marine litter,
Marine Anthropogenic Litter, p. 433, Available at: Walker, T.R.; Ris, K.; Arnould, J.P.Y., and Croxall, J.P., 1997.
https://doi.org/10.1007/978-3-319-16510-3_16. Marine debris surveys at Bird Islands, South Georgia
1990 1995, Marine Pollution Bulletin, 34(1): p.34,
Jang, Y. C., Hong, S., Lee, J., Lee, M. J., & Shim, W. Available at: doi: 10.1016/S0025-326X(96)00053-7.
J. (2014). Estimation of lost tourism revenue in
Geoje Island from the 2011 marine debris pollution
event in South Korea. Marine Pollution Bulletin,
81(1): p. 49-54, Available at: https://doi.org/10.1016/j.
marpolbul.2014.02.021.
10 ■ Efficiency of beach clean-ups and deposit refund schemes (DRS) to avoid
damages from plastic pollution on the tourism sector in Cape Town, South AfricaINTERNATIONAL UNION FOR CONSERVATION OF NATURE WORLD HEADQUARTERS Rue Mauverney 28 1196 Gland Switzerland Tel +41 22 999 0000 Fax +41 22 999 0002 www.iucn.org
You can also read