Environmental sequencing to infer patterns of eukaryotic evolution
←
→
Page content transcription
If your browser does not render page correctly, please read the page content below
Digital Comprehensive Summaries of Uppsala Dissertations
 from the Faculty of Science and Technology 2054

 Environmental sequencing to infer
 patterns of eukaryotic evolution
 Combining long-read and short-read metabarcoding

 MAHWASH JAMY

 ACTA
UNIVERSITATIS
 UPSALIENSIS ISSN 1651-6214
 ISBN 978-91-513-1242-2
 UPPSALA URN urn:nbn:se:uu:diva-446935
 2021

Dissertation presented at Uppsala University to be publicly examined in Ekmansalen,
Evolutionary Biology Centre (EBC), Norbyvägen 14, Uppsala, Friday, 10 September 2021 at
13:00 for the degree of Doctor of Philosophy. The examination will be conducted in English.
Faculty examiner: Professor Micah Dunthorn (Natural History Museum, University of Oslo).

Online defence: https://uu-se.zoom.us/j/69496814472

Abstract
Jamy, M. 2021. Environmental sequencing to infer patterns of eukaryotic evolution.
Combining long-read and short-read metabarcoding. Digital Comprehensive Summaries of
Uppsala Dissertations from the Faculty of Science and Technology 2054. 70 pp. Uppsala: Acta
Universitatis Upsaliensis. ISBN 978-91-513-1242-2.

Our view of eukaryotes is biased towards plants, animals, and fungi. But the vast majority
of eukaryotic diversity is microbial in nature. These microbial eukaryotes are key players
in all ecosystems on earth and are collectively known as protists. Over the past decade we
have gathered a better understanding of environmental protist diversity and ecology through
metabarcoding studies, which routinely generate millions of reads corresponding to short
fragments (< 500 bp) of the 18S gene. However, the limited phylogenetic signal of these short
reads hinders their use in investigating questions of an evolutionary nature.
 To overcome this limitation, we introduced a method for long-read metabarcoding in Paper
I of this thesis. We validated this method by amplifying DNA from three soil samples and
sequencing with PacBio to obtain a ca. 4500 bp region of the ribosomal DNA operon spanning
the 18S and 28S genes. The long-reads were taxonomically annotated using a phylogeny-
aware approach, and were used to infer robust 18S-28S phylogenies of the environmental
diversity.
 In Paper II, we investigated habitat evolution across the eukaryotic tree of life, using
a unique combination of long-read and short-read metabarcoding data in a phylogenetic
framework. We showed that transitions across the marine-terrestrial habitat boundary are more
frequent than previously assumed, and that eukaryotic groups vary in their ability to cross
this habitat boundary. We inferred that the last eukaryotic common ancestor inhabited non-
marine environments, and that subsequent transitions across the marine-terrestrial boundary
likely played a key role in eukaryotic evolution by opening new niches to fill.
 Paper III focused on determining the effects of habitat and latitude on the rates of molecular
evolution of protists. Analyses on phylogenies inferred from long-read metabarcoding data
found no systematic differences in the evolutionary rates of marine and terrestrial species.
Additionally, contrary to expectations, not all eukaryotic groups showed an increase in
evolutionary rates towards the equator, with some groups displaying the opposite trend.
 Finally Paper IV isolates the parasite of the endangered freshwater pearl mussel in Sweden,
and phylogenetic analyses including long-read metabarcoding data identifies it as a gregarine
belonging to the genus Nematopsis.
 In summary, this thesis introduces a new method for environmental sequencing of protists,
and urges future studies to use both long-read and short-read metabarcoding data to study
outstanding questions in eukaryotic evolution and ecology.

Keywords: Protists, eukaryotes, environmental sequencing, ribosomal DNA, PacBio, long-
read metabarcoding, phylogenetics, salt barrier, habitat evolution, eukaryotes evolution,
evolutionary rate, Apicomplexa, pathogen

Mahwash Jamy, Department of Organismal Biology, Systematic Biology, Norbyv. 18 D,
Uppsala University, SE-75236 Uppsala, Sweden.

© Mahwash Jamy 2021

ISSN 1651-6214
ISBN 978-91-513-1242-2
URN urn:nbn:se:uu:diva-446935 (http://urn.kb.se/resolve?urn=urn:nbn:se:uu:diva-446935)
To my parents

List of Papers

This thesis is based on the following papers, which are referred to in the text
by their Roman numerals.

 I Jamy, M., Foster, B., Barbera, P., Czech, L., Kozlov, A., Stama-
 takis, A., Bending, G., Hilton, S., Bass, D., Burki, F. (2020)
 Long-read metabarcoding of the eukaryotic rDNA operon to phy-
 logenetically and taxonomically resolve environmental diversity.
 Molecular Ecology Resources, 20(2):429–443

 II Jamy, M., Biwer, C., Vaulot, D., Obiol, A., Jing, H., Peura, S.,
 Massana, R., Burki, F. (2021) Global patterns and rates of habitat
 transitions across the eukaryotic tree of life. Manuscript

 III Jamy, M., Vaulot, D., Burki, F. (2021) Habitat, latitude, and the
 rate of molecular evolution in eukaryotes. Manuscript

 IV Alfjorden, A., Brännström, I. O., Wengström, N., Jamy, M.,
 Kristmundson, A., Jansson, E., Burki, F. (2021) Identification of
 a new gregarine parasite [Apicomplexa, Alveolata] in mass mor-
 tality events of freshwater pearl mussels (Margaritifera margar-
 itifera). Manuscript

Reprints were made with permission from the respective publishers.
The following papers were published or submitted during the course of my
doctoral studies, but are not part of this thesis.

Burki, F., Sandin, M. M., Jamy, M. (-) Diversity and ecology of protists re-
vealed by metabarcoding. Current Biology. Submitted (invited review)

Strassert, J. F. H., Jamy, M., Mylnikov, A. P., Tikhonenkov, D. V., Burki, F.
(2019) New phylogenomic analysis of the enigmatic phylum Telonemia fur-
ther resolves the eukaryotic tree of life. Molecular Biology and Evolution.
36(4):757-765

Avia, K., Lipinska, A., Mignerot, L., Montecinos, A., Jamy, M., Ahmed, S.,
Valero, M., Peters, A., Cock, J., Roze, D., Coelho, S. (2018) Genetic diversity
in the UV sex chromosomes of the brown alga Ectocarpus. Genes. 9(6):286

Onsbring, H., Jamy, M., Ettema, T. J. G. E. (2018) RNA sequencing of Sten-
tor cell fragments reveals transcriptional changes during cellular regeneration.
Current Biology. 28(8):1281-1288.e3
Contents Introduction ................................................................................................... 11 Note ............................................................................................................... 13 A brief overview of protist diversity and classification ................................ 14 Metabarcoding to reveal environmental protist diversity ............................. 17 The general metabarcoding workflow ...................................................... 17 What does a metabarcoding dataset represent? ........................................ 20 A shift away from phylogeny-based analyses (and back again) .............. 21 Long-read metabarcoding ............................................................................. 24 Which sequencing platform should be used? ........................................... 25 Insights into protist diversity from metabarcoding ....................................... 28 How has evolution shaped protist diversity? Integrating ecology and evolution ........................................................................................................ 31 What can phylogenies tell us? ....................................................................... 33 Phylogenetic placement ............................................................................ 33 Ancestral State Reconstruction ................................................................. 35 Inferring rates of evolution ....................................................................... 37 Integrating metabarcoding data in a phylogenetic framework ...................... 40 Research Aims............................................................................................... 41 Paper Summaries ........................................................................................... 42 Paper I. Long-read metabarcoding of eukaryotes ..................................... 42 Paper II. Habitat evolution across eukaryotic tree of life ......................... 42 Paper III. Rate of molecular evolution in protists .................................... 43 Paper IV. A gregarine parasite infecting freshwater pearl mussels .......... 44 Conclusions and Future Perspectives ............................................................ 45 Popular Science Summary ............................................................................ 47 Svensk sammanfattning................................................................................. 49 ﺧﻼﺻہ ﺑراﺋﮯ ﭘﺎﭘوﻟر ﺳﺎﺋﻧس.................................................................................. 51
Acknowledgements ....................................................................................... 53
References ..................................................................................................... 58
Abbreviations

ASR Ancestral state reconstruction
bp Base pairs
DNA Deoxyribonucleic acid
EPA Evolutionary placement algorithm
GTR General time reversible model, DNA substitution model
ITS Internal transcribed spacer of the ribosomal operon
LDG Latitudinal diversity gradient
LSU Large subunit (28S) ribosomal gene
MCMC Markov chain Monte Carlo
ML Maximum likelihood
PacBio Pacific Biosciences
PCR Polymerase chain reaction
PR2 Protist Ribosomal Reference database
rDNA Ribosomal DNA
RNA Ribonucleic acid
SMRT Single-molecule real-time sequencing
SSU Small subunit (18S) ribosomal gene
Introduction

“These animalcules had divers colours, some being whitish and transparent;
others with green and very glittering little scales; others again were green in
the middle, and before and behind white; others yet w’ere ashen grey. And the
motion of most of these animalcules in the water was so swift, and so various,
upwards, downwards, and round about, that ’twas wonderful to see”
 [Leeuwenhoek’s discovery of protists and bacteria in Sep, 1674 (Dobell
 and Van Leeuwenhoek 1932)]

There are an estimated 8.7 million species of eukaryotes on Earth (Mora et al.
2011). Much of the work on characterizing this impressive diversity has been
done on more conspicuous eukaryotes: animals, plants and fungi. However,
these familiar groups are only a few branches on the eukaryotic tree of life
(Martin 2015). It is in fact Leeuwenhoek’s “animalcules”, or more accurately,
microbes, ranging in size from less than a micrometre to several millimetres,
that comprise the vast bulk of eukaryotic diversity (Baldauf et al. 2000; Burki
et al. 2020). Collectively known as protists, these microbes come in a breath-
taking array of forms: ciliates with complex feeding structures that can be re-
grown if lost, radiolarians with intricate mineral skeletons, symmetrical colo-
nies of green algae, tiny armour-plated haptophytes, or glass-encased diatoms,
to name only a few relatively well-studied examples. Protists have much to
offer to those interested in understanding how life works in all its glorious
facets. They are inherently interesting because of their peculiar cell biology,
one example being the ciliates with their micro- and macronucelus, that differs
from the standard textbook picture. So studying them can reveal the full
breadth of biology in all its complexity, which otherwise would not be possi-
ble by looking at animals or plants alone. They hold clues important for solv-
ing the puzzle of eukaryote evolution and eukaryogenesis (Koonin 2010). Fur-
thermore, they are key members of microbial communities that drive all eco-
systems on earth. They are important primary producers, generating 40% of
the world’s oxygen (Corliss 2004), and also perform critical roles in our eco-
systems as decomposers, predators and parasites.

Although the small size of protists and our inability to culture most species in
the lab has presented significant challenges historically, our knowledge about
protist diversity and ecology has rapidly accumulated in recent years. This is

 11
largely owing to recent technological advances that allow the extraction and
sequencing of genetic material directly from environmental samples. Environ-
mental sequencing, especially metabarcoding, has proven particularly useful
for revealing unprecedented protist diversity and characterizing how micro-
bial eukaryotic communities vary in space and time. However, current meth-
odologies are limited by short sequencing length, often less than 500 base
pairs (bp). Consequently, the data generated have limited phylogenetic signal,
impairing our ability to investigate ecological and evolutionary questions that
rely on phylogenetic analyses. Furthermore, it can be difficult to analyse novel
lineages and characterise their position in the tree of life, especially if the
novel lineage is very divergent from known reference sequences.

In this thesis, I introduce high-throughput long-read metabarcoding of natural
eukaryotic communities whereby we sequence a ~4500 bp fragment of the
ribosomal DNA operon, spanning the 18S and 28S genes (Paper I). The in-
creased phylogenetic signal of the long-reads enables phylogeny-aware taxo-
nomic annotation and the inference of more robust phylogenies of environ-
mental diversity, thereby providing an evolutionary perspective of natural
communities. Importantly, these taxon-rich phylogenies also allow us to in-
corporate the vast amount of existing short-read metabarcoding. With the re-
sulting comprehensive phylogenies, we can investigate questions of an evolu-
tionary nature using the full-scale of environmental diversity. In Paper II, we
use these combined data to answer the following questions: How often do eu-
karyotes transition between marine and non-marine habitats? Are certain
groups more adept at crossing this habitat boundary? Which environment did
major eukaryotic clades originate in? In Paper III we investigate the effect of
habitat and latitude/climate on the rate of molecular evolution. Do marine taxa
evolve faster than non-marine taxa? Do species near the equator have faster
evolutionary rates? Finally, in Paper IV, we use environmental sequencing,
histology and imaging techniques to isolate and describe an apicomplexan
parasite from the endangered freshwater pearl mussel. We use our long-read
dataset to phylogenetically characterise the parasite and examine its preva-
lence in natural communities.

In the following summary text, I provide an overview of standard metabar-
coding techniques, long-read metabarcoding, and insights into protist diver-
sity and ecology provided by metabarcoding. The patterns of protist diversity
and ecology raise several fundamental questions at the crossroads of ecology
and evolution, and to investigate them, I advocate for the use of long-read and
short-read metabarcoding. Answering these questions requires the use of sev-
eral phylogeny-based methods, and I introduce these to the reader. Finally, I
finish with the most important findings from this thesis.

12
Note

Due to format constraints, some of the supplementary material from this thesis
(alignments, and large phylogenies) is available on a Box folder, and will be
maintained until 1st November 2021:

https://uppsala.box.com/s/v2ulcxxkvzjoyhard2frrq4sct26yqjn

 13
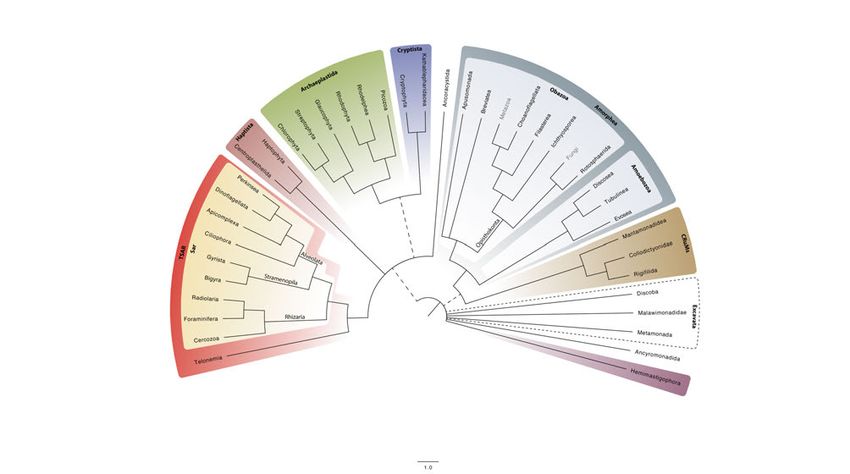
A brief overview of protist diversity and
classification

How are all eukaryotes on earth related to each other? While this is still an
active area of research, significant progress has been made, particularly in the
last 20 years (Baldauf et al. 2000; Burki et al. 2007, 2020; Brown et al. 2018;
Strassert et al. 2019). Our current view of the eukaryotic tree of life (Figure 1)
has largely been informed by phylogenomics, i.e. phylogenetic inferences us-
ing datasets involving several hundred genes, which is especially necessary in
order to resolve deep-branching nodes (Burki 2014; Burki et al. 2020). The
eukaryotic tree of life is typically divided into several “supergroups”—large
groups for which we have reasonable evidence of their monophyly. These su-
pergroups can include several traditional “kingdom”-level clades (e.g. the an-
imal and fungal kingdoms are included in the supergroup Obazoa) (Figure 1).
It should be noted that the root of the eukaryotic tree remains elusive, and
several studies have proposed different roots over the years (Derelle and Lang
2012; He et al. 2014; Derelle et al. 2015; Jewari and Baldauf 2021).

Below, I briefly introduce the main eukaryotic lineages.

TSAR
This group is composed of Telonemia, Stramenopila, Alveolata, and Rhizaria,
of which the latter three form the group Sar. Altogether, Sar is thought to con-
tain nearly half of all protist diversity (Del Campo et al. 2014). Rhizaria in-
cludes groups such as radiolarians and foraminifera which form intricate skel-
etons and shells made of silica and calcium carbonate respectively. Also in-
cluded are the cercozoans, a diverse group covering parasites of animals,
plants, and algae (Sierra et al. 2016; Bass et al. 2019), heterotrophic flagellates
dominating soils, voracious predators sucking out their prey’s cell contents,
and many others. Stramenopila comprise diatoms, golden algae, the plant
pathogen group oomycetes (Gyrista), as well as the network producing laby-
rithulomycetes, MArine STramenopiles and other flagellates (Bigyra). Fi-
nally, the Alveolata include ciliates, dinoflagellates, and the parasitic apicom-
plexa and perkinsids.

14
Haptista
Haptista is made up of the photosynthetic haptophytes, and the heterotrophic
sun-animalcules aka centrohelids.

Figure 1. Current view of the eukaryotic tree of life. Supergroups are indicated in
different colours. Branches for which there are more uncertainties are shown as
dashed lines. Lineages shown correspond to the fourth rank in the PR2 database
(PR2_transitions; e-Supp Material), and black text indicates lineages composed (at
least partially) of protist diversity. Figure adapted from Burki et al. 2020.

Archaeplastida
This group contains lineages with primary plastids (chloroplasts) such as land
plants, green algae, red algae, and glaucophytes. Recently, it was found to also
include non-photosynthetic lineages such as rhodelphids, and the picozoa
(Gawryluk et al. 2019; Schön et al. 2021).

Cryptista and Palpatimonas
This group is home to the cryptophytes which are photosynthetic algae com-
mon in freshwater, and the heterotrophic kathablepharids.

Amorphea
Amorphea is composed of two large groups: Obazoa and Amoebozoa. The
former includes animals, fungi, and their single-celled relatives (such as

 15
choanoflagellates, breviates and apusomonads). Amoebozoa on the other hand
contain a large diversity of amoeboid protists and slime moulds.

CRuMs
This grouping puts together several free-living protist lineages: namely the
collodictyons, rigifilids, and the mantamonads (Brown et al. 2018).

Excavata
This is the only group that is supported by morphological evidence (a feeding
groove “excavated” on one side of the cell), but not well supported by molec-
ular phylogenies (Simpson and Patterson 1999; Derelle et al. 2015). It tenta-
tively contains three main lineages: metamonads, discobids, and malawimon-
ads. While most metamonads are symbionts or parasites with highly reduced
mitochondria and live in low-oxygen environments, discobids mostly have
non-reduced mitochondria and are either free-living or parasitic.

Hemimastigophora
This is the most recently proposed supergroup, and is perhaps the most depau-
perate, containing only the hemimastigotes, flagellated cells occurring in soils
and freshwater in low abundance (Lax et al. 2018).

16
Metabarcoding to reveal environmental protist
diversity

A small sample of soil taken from a football field will contain hundreds of
thousands of eukaryotic cells. The same holds true for a sample taken from a
pond in Uppsala, or from the Pacific Ocean—in fact from anywhere on earth.
Which species are present in these samples? Do we find different protists in
each of these samples? There are two main ways to tackle these questions.
One could for instance, examine these samples under a microscope and try to
identify species using morphology. However, while valuable, this method is
slow, low-throughput, requires expertise, and it is difficult to morphologically
distinguish protists smaller than 5 µm or so (Massana 2015). Furthermore,
some organisms might look morphological identical, but in fact represent dif-
ferent species (aka cryptic species) (Sarno et al. 2005; Gaonkar et al. 2017; De
Luca et al. 2021). The other option is to extract DNA directly from these sam-
ples and sequence it (environmental sequencing). Environmental sequencing
comes in two main flavours. The first is shotgun metagenomics and meta-
transcriptomics which involve sequencing the entire DNA (or cDNA) content
in a sample, and then assembling into genomes/transcriptomes. Metagenomic
assembly is extremely challenging, even more so for eukaryotes due to the
large size and complexity of their genomes. The problem is further exacer-
bated by the lack of reference genomes for much of eukaryotic diversity. For
this reason, most environmental sequencing studies on protists have not used
metagenomics (though there have been several recent exciting developments
in this field, for example West et al. 2018; Richter et al. 2019; Delmont et al.
2020; Obiol et al. 2020). The other method of environmental sequencing, and
the one that I will focus on in this thesis, is metabarcoding. Metabarcoding
involves amplifying and sequencing a specific molecular marker, an approach
that has proved to be highly valuable for studying environmental protist di-
versity.

The general metabarcoding workflow
The general metabarcoding workflow consists of a series of steps in the field,
the lab, and then bioinformatics (illustrated in Figure 2; see Creer et al. 2016;

 17
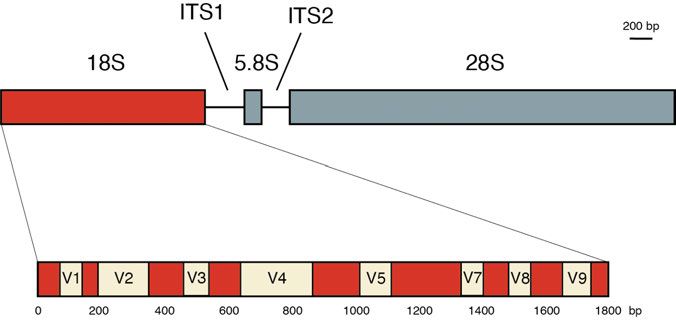
Taberlet et al. 2018; Santoferrara 2019) for a more detailed overview of the
topic).

Sample collection
Once a study has been designed, the first step is to collect environmental sam-
ples. The type, location, timing, volume, and number of samples depends on
the scientific question under consideration. Additionally, samples are also
handled differently depending on the source material—for instance, protists
in aquatic samples are often separated into distinct size fractions in order to
study the different size groups independently.

Figure 2. A simplified workflow of metabarcoding starting from sample collection
to wet lab work, sequencing and ecological analyses.

Lab work
Next, total DNA and/or RNA is extracted from the environmental samples,
which involves lysing cells to release their genetic material. A targeted DNA
region (or barcode) is then amplified with PCR and subsequently sequenced
on a high-throughput sequencing platform. The choice of this barcode depends
on the taxonomic group under consideration: for fungi, it is the internal tran-
scribed spacer (ITS) in the ribosomal operon that is most widely used (Schoch
et al. 2012); the cytochrome oxidase c subunit (COI) marker is commonly
used for animals (Hebert et al. 2003); and plant researchers favour the ribu-
lose-1,5 biphosphate carboxylase-oxygenase large subunit (rbcL) gene
(Newmaster et al. 2006). But when studying broad eukaryotic diversity, it is
the 18S (SSU) gene that is most commonly used due to its universality, ease

18
of amplification, and high taxonomic information (Figure 3) (Hillis and Dixon
1991). In particular, large-scale metabarcoding studies in the past decade have
focused on the short, hypervariable V4 and V9 regions of the 18S gene (de
Vargas et al. 2015; Duarte 2015; Kopf et al. 2015; Mahé et al. 2017;
Santoferrara et al. 2020). While metabarcoding is often associated with am-
plifying and sequencing short (< 500 bp) genetic markers, in Paper I of this
thesis, we present a method for long-read metabarcoding (see “Long-read
metabarcoding”). Unless targeting a specific protist group, general eukaryotic
primers are used to recover the entire eukaryotic community (but see the sec-
tion “What does a metabarcoding dataset represent?”).

Figure 3. The top panel shows a general overview of the rDNA operon showing the
18S, 5.8S and 28S genes (5S is encoded elsewhere). Interstitial spacers, ITS1 and
ITS2 separate the 18S and 5.8S genes and 5.8S and 28S genes respectively. The
lower panel shows a more detailed schematic of the 18S gene. Darker regions repre-
sent conserved regions while lighter regions represent variable regions and are la-
belled 1-9.

Bioinformatics
Raw sequencing data needs to be processed before downstream analyses.
These filtering steps often include culling poor-quality reads, detecting and
removing chimeras and other artefacts, handling sequencing errors, and fi-
nally, clustering sequences into operational taxonomic units (OTUs) or am-
plicon sequencing variants (ASVs). It should be noted that OTUs rarely reflect
a direct correspondence to species, but instead are a practical solution for han-
dling large data, and dealing with sequencing errors. Over the years, a number
of popular tools and pipelines have been established for processing and clus-
tering short-read metabarcoding data such as qiime, mothur, vsearch, dada2,
swarm, and lulu (Schloss et al. 2009; Caporaso et al. 2010; Mahé et al. 2014;
Rognes et al. 2016; Frøslev et al. 2017). On the other hand, fewer pipelines

 19
and dedicated tools exist for long-read metabarcoding which is a much newer
technology. In this thesis, we present a new pipeline to process long-read
metabarcoding data (Papers I and II).

An important step after read clustering is assigning taxonomy to sequences.
Again, a number of tools exist to tackle this, with the common principle to
perform sequence similarity searches against reference databases such as PR2
and SILVA (Guillou et al. 2012; Quast et al. 2013). These methods are rapid
and well suited for large datasets, however, they do not perform well for se-
quences that are too divergent from labelled, reference sequences (Berger et
al. 2011). Indeed, sequences less than 80% similar to known references are
often discarded in metabarcoding studies (de Vargas et al. 2015). One method
to identify such divergent sequences is to phylogenetically “place” them on to
reference phylogenies inferred from known reference sequences (Berger et al.
2011; Barbera et al. 2019). However, this too requires labelled, reference se-
quences which are often generated through Sanger sequencing, a low-through-
put and labour-intensive process. Fortunately, the development of long-read
metabarcoding (Papers I and II) presents a high-throughput way of populat-
ing these reference databases.

Following sequence annotation, analyses to investigate ecological questions
are carried out, ranging from the calculation of alpha and beta diversity, net-
work analyses, ordination methods, and phylogeny-based analyses.

What does a metabarcoding dataset represent?
Metabarcoding studies routinely generate millions of barcodes. But how well
do these datasets correspond to the actual community present in the source
samples? Numerous studies over the years have highlighted biases that can
arise during different metabarcoding steps, and how to best alleviate them
(Taberlet et al. 2018; Harrison et al. 2019; Santoferrara 2019). First, although
we use general eukaryotic primers, not all members of the community are am-
plified. No primer pair is truly universal, and therefore certain taxa might be
missed in biodiversity surveys. For example, animal parasites belonging to the
fast-evolving rhizarian group, Ascetosporea are often missed by general pri-
mers, and the marine-dominant diplonemid clade is completely absent in V4
datasets (Mukherjee et al. 2015; Bochdansky et al. 2017; Bass et al. 2019).
Furthermore, obligate intracellular parasites in general may be difficult to pick
up in biodiversity surveys unless their hosts are specifically targeted
(Hartikainen et al. 2014; Ward et al. 2018; Bass et al. 2019). Additionally,
environmental sequencing studies rarely capture all of the components of the
rare biosphere, though high-throughput sequencing does alleviate this prob-
lem to a certain extent. On the flip side, not all sequences in metabarcoding

20
datasets represent biologically active residents; some sequences may be
sourced from dead or lysed cells, other sequences may represent cells dis-
persed from other habitats (e.g. surface runoff into coastal waters), and still
others may simply be chimeras or other sequence artefacts (Taberlet et al.
2018; Harrison et al. 2019; Santoferrara 2019; Gottschling et al. 2020).

Comparisons with mock communities and metagenomic datasets have also
revealed that relative abundances of taxa can be skewed due to preferential
amplification during PCR, or due to high 18S copy number in cells (Elbrecht
and Leese 2015; Krehenwinkel et al. 2017; Pitsch et al. 2019; Obiol et al.
2020). This may for example be the case for diplonemids which have multiple
rDNA copies, and their dominance in the oceans may therefore have been
overestimated (Mukherjee et al. 2020).

Finally, it is worthwhile to consider what our diversity estimates are actually
measuring. As previously mentioned, OTUs (and ASVs) do not necessarily
correspond to species. Indeed, some OTUs may represent multiple species
with highly similar 18S sequences (diversity underestimation). On the other
hand, some OTUs may be derived from the same organisms and reflect intra-
genomic variability (diversity overestimation) (Caron and Hu 2019).

Despite all of these biases and limitations, metabarcoding is currently the best
and most cost-effective tool for assessing the diversity of natural microbial
communities in detail. Comparisons with metagenomic approaches (which
should be unbiased by the PCR step), microscopy and mock communities have
revealed that overall, metabarcoding provides a robust, useful, and qualitative
or semi-quantitative view of eukaryotic communities (Santoferrara 2019;
Obiol et al. 2020).

A shift away from phylogeny-based analyses (and back
again)
The different sequencing technologies available over the years have heavily
shaped the possibilities of research on microbial communities. Initial studies
in the early 2000s used Sanger sequencing which was costly and involved the
laborious and time-intensive step of cloning amplicons before sequencing
(López-García et al. 2001; Moon-Van Der Staay et al. 2001). These studies
regularly obtained 18S sequences of around 1000 bp or more which were an-
alysed in a phylogenetic context to assess novel diversity. It was by inferring
phylogenies with environmental and reference sequences that entirely novel
clades were revealed, such as the Marine Stramenopiles (MASTs) and Marine

 21
Alveolates (MALVs) (López-García et al. 2001; Moon-Van Der Staay et al.
2001; Massana et al. 2004a,c).

Later, the emergence of 454 pyrosequencing quickly followed by Illumina and
Ion Torrent technologies, enabled the generation of millions of reads corre-
sponding to short (≤ 500 bp) V4 or V9 fragments of the 18S gene, resulting in
the bulk of metabarcoding surveys that we are familiar with today (Amaral-
Zettler et al. 2009). While these short-reads capture a much greater proportion
of the eukaryotic community, they contain little phylogenetic signal (Box 1).
We thus saw a general shift away from phylogeny-based analyses (though
there are some exceptions e.g. Dunthorn et al. 2014a; Mahé et al. 2017;
Lewitus et al. 2018; Lentendu and Dunthorn 2021). Current short-read
metabarcoding sequencing studies do detect novel diversity in environments,
but cannot precisely determine its phylogenetic affiliation. For example, one-
third of the diversity sequenced by a global marine expedition (Tara Oceans)
could not be taxonomically assigned to any group, including 11 cosmopolitan
OTUs (de Vargas et al. 2015). Therefore, Sanger sequencing is still the tech-
nology of choice for exploring group-specific diversity where obtaining
longer sequences to enable phylogenetic inference is desirable (e.g. Lara et al.
2016; Ward et al. 2018), though we note that this role might be fulfilled by
long-read metabarcoding in the future.

Poor taxonomic annotation of divergent sequences is not the only problem that
arises due to the little phylogenetic signal of short-reads. Indeed, it can also
be challenging to use this data to investigate questions of an evolutionary na-
ture, which by nature, often require phylogenetic inference (Dunthorn et al.
2014a). Some of these challenges are overcome by the development of a suite
of tools dedicated to phylogenetic placement (Matsen et al. 2010; Berger et al.
2011; Barbera et al. 2019; Czech et al. 2020). Additionally, the development
of long-read metabarcoding is now allowing taxon-rich, robust, phylogenetic
inference (Papers I and II), thus alleviating some of the challenges tradition-
ally faced by metabarcoding.

22
Box 1. Why is it difficult to infer phylogenies from short-read metabarcoding
data?

Short-read metabarcoding datasets typically contain many thousands of taxa,
and very few bp. The first reason why it can be difficult to infer phylogenies
is that there is simply not enough data! Second, it can be difficult to parallelize
the tree search algorithm because there are so many taxa, greatly inflating the
tree space. And finally, due to the “shape” of the dataset (many taxa, few bp),
accuracy suffers (Bininda-Emonds et al. 2001). This is because the tree space
has a “rough likelihood surface” (see figure below), where a large number of
local optima exist that cannot be distinguished from each other statistically
(Stamatakis et al. 2020).

A phylogenomics dataset can be considered a “well-shaped” dataset, while
a short-read metabarcoding dataset can be considered a “badly-shaped” da-
taset, with many local optima. Figure adapted from a lecture given by A.
Stamatakis (Stamatakis 2018).

 23
Long-read metabarcoding

The first long-read metabarcoding study appeared in 2013, in which Mosher
et al. amplified the entire bacterial 16S gene (1500 bp) on the Pacific Biosci-
ences (PacBio) RS platform (Mosher et al. 2013). This study estimated error
rates to be as high as 17-18%, far too high to reliably assess microbial diver-
sity. Since then, third-generation sequencing technologies, namely PacBio and
Nanopore, have improved drastically and have much lower error rates that are
comparable to Sanger sequencing (Loit et al. 2019). And while the microbial
ecology community has yet to broadly adopt these technologies for metabar-
coding, long-read metabarcoding is becoming increasingly popular (Figure 4),
and several proof-of-concept studies have been published recently, including
Paper I of this thesis (Schloss et al. 2016; Wagner et al. 2016; Heeger et al.
2018; Tedersoo et al. 2018; Martijn et al. 2019; Jamy et al. 2020).

These sequencing technologies generate reads of length 1500-6000 bp
(Heeger et al. 2018; Orr et al. 2018; Jamy et al. 2020), long enough to contain
the complete 18S gene (covering both V4 and V9), or even the entire riboso-
mal DNA operon (Figure 3), including the ITS region and the 28S gene. The
increased length and phylogenetic signal of these reads presents a number of
advantages. First, the increased genetic information allows better taxonomic
classification of environmental sequences compared to the short V4 or V9 se-
quences, regardless of the taxonomic annotation method used (Heeger et al.
2018; Chung et al. 2020; Jamy et al. 2020; Jeong et al. 2021). Second, these
reads can potentially be used to rapidly populate reference databases, not just
for the 18S gene, but for the ITS region and 28S gene as well. The long-reads
contain all these markers linked together, which is useful for establishing as-
sociations between them. Third, these reads can also be used to infer taxon-
rich reference phylogenies on to which existing short-read data can be placed,
as we show in Paper II of this thesis. Fourth, by inferring phylogenetic trees,
we can visualize and assess the phylogenetic diversity of an environmental
sample (Paper I), and potentially discover novel clades along with resolving
their position in the tree of life (Jamy et al. 2020; Kolaříková et al. 2021;
Strassert et al. 2021). Finally, these taxon-rich phylogenies can allow us to
explore eukaryotic biodiversity in an eco-evolutionary context (Papers II and
III; see “How has evolution shaped protist diversity?”), thus opening up an
exciting avenue of research. As always, there are potential pitfalls associated
with the method which remain to be critically assessed. For instance, long-

24
range PCRs are more prone to chimera formation (though this problem can be
somewhat alleviated by reducing the number of PCR cycles; Heeger et al.
2018). It seems likely however, that the benefits far outweigh the risks.

Figure 4. A trend of the increasing popularity of long-read metabarcoding. The
number of studies each year in Google Scholar containing the words “metabarcod-
ing” and “PacBio”/”Nanopore”/”long-read” was plotted.

Which sequencing platform should be used?
There are three main options for sequencing long-read amplicons: Nanopore,
PacBio, and Synthetic Long Reads (SLR; now commercially available as
LoopSeq). Each has its own sets of strengths and weaknesses and ultimately
choosing the right sequencing platform depends on the study design, the cost,
the taxonomic scope of the study, and the genetic marker being used. Below,
I will briefly present the three sequencing technologies and discuss when they
are best suited considering their pros and cons.

 25
!"#$%&'
R%6-$Z)&"+"#-K$=)5O%"$.-i4-&5%&>$*""$0).$)$0%>0$#)J$-##"#$#)*-K$-.*%()*-A$*"$
@-$)#"4&A$90$
-##"#$#)*-$5)&$@-$,)#>-,?$"/-#5"(-$J%*0$P%#54,)#$P"&.-&.4.$T-i4-&5%&>$XPPTm$
!%>4#-$gY$XT50,"..$-*$),3$;H9EY3$O#%-',?K$A4#%&>$.-i4-&5%&>$,%@#)#?$+#-+K$0)%#+%&$
)A)+*-#.$ )#-$ ,%>)*-A$ *"$ *0-$ -&A.$ "'$ )(+,%5"&.K$ *04.$ >-&-#)*%&>$ 5%#54,)#%Q-A$
BZD$(",-54,-.$XT_MI$@-,,$*-(+,)*-m$!%>4#-$gY3$B4#%&>$.-i4-&5%&>K$*0-$+",U
?(-#).-$>"-.$#"4&A$*0-$BZD$(",-54,-$.-/-#),$*%(-.$)&A$-)50$5"(+,-*-$#4&$
*0#"4>0$*0-$'"#J)#A$"#$#-/-#.-$.*#)&A$%.$*-#(-A$)$k+)..l3$D$5%#54,)#$5"&.-&.4.$
.-i4-&5-$XPPTY$%.$>-&-#)*-A$'#"($),,$+)..-.$"'$)$(",-54,-$A4#%&>$+".*U+#"U
5-..%&>3$I0%.$PPT$0).$)$.4@.*)&*%),,?$,"J-#$-##"#$#)*-$.%&5-$*0-$-##"#.$)#-$#)&U
A"(,?$A%.*#%@4*-AK$)&A$%.$5"(+)#)@,-$*"$T)&>-#$.-i4-&5%&>$XR"%*$-*$),3$;H9[Y3$
!4#*0-#("#-K$*0%.$-##"#$#)*-$*-&A.$*"$A-5#-).-$).$*0-$&4(@-#$"'$+)..-.$%&5#-).-.$
XT50,"..$ -*$ ),3$ ;H9EY3$ I0%.$ ()6-.$ =)5O%"$ .-i4-&5%&>$ .4%*)@,-$ '"#$ )..-..%&>$
0%>0,?$5"(+,-L$5"((4&%*%-.K$)&A$%*$%.$'"#$*0%.$#-)."&$*0)*$J-$"+*-A$'"#$*0%.$
+,)*'"#($'"#$*0-$#-.-)#50$+#-.-&*-A$%&$*0%.$*0-.%.3$N&$)"*+,&-K$J-$+#-.-&*$A)*)$
'#"($*0#--$."%,$5"((4&%*%-.$.-i4-&5-A$"&$*0#--$T_MI$X.%&>,-$(",-54,-$#-),$
*%(-Y$5-,,.$"&$T-i4-,$NK$J0%,-$%&$)"*+,&--K$J-$+#-.-&*$)AA%*%"&),$A)*)$'#"($9G$
.)(+,-.$*0)*$J-#-$.-i4-&5-A$"&$'"4#$T_MI$5-,,.$"&$*0-$&-J-#$T-i4-,$NN$%&U
.*#4(-&*3$

!"#$%&'-)'K-$'5/%$2'+%'&-$'2$,&'7-+*7'/'8+">2$'7&#/%8$8'LMI'4B=K'>$22'&$:52/&$'
?,+#*/#8'/%8'#$($#7$'7&#/%87'8$5)1&$8')%'+#/%6$'/%8'6#$$%'#$75$1&)($20CD'1)#1"2/#)W$8'
>0'-/)#5)%'/8/5&$#7'?0$22+*C3'K-$'5+20:$#/7$':+2$1"2$'?)%'6#$0C'7$J"$%1$7'&-$'1)#A
1"2/#'&$:52/&$':"2&)52$'&):$7D'6$%$#/&)%6'7">#$/87'+#'T5/77$7U'7-+*%')%'&-$'5/%$2'+%'
&-$'#)6-&3'X/1-'5/77'-/7'/'-)6-'5#+5+#&)+%'+,'#/%8+:20'8)7&#)>"&$8'7$J"$%1)%6'$##+#7D'
*-)1-'/#$'#$:+($8'*-$%'&-$'!!4')7'6$%$#/&$8'8"#)%6'5+7&A5#+1$77)%63&

(")&*&+,'
I0-$_%&N]Z$)&A$"*0-#$.-i4-&5-#.$'#"($]L'"#A$Z)&"+"#-K$')("4.$'"#$*0-%#$
+"#*)@%,%*?$)&A$#)+%A$+#"5-..%&>$"'$.)(+,-.K$"+-#)*-$@?$4&J%&A%&>$*0-$BZD$
A"4@,-$0-,%L$)&A$A#%/%&>$*0-$.%&>,-$.*#)&A-A$BZD$*0#"4>0$)$+#"*-%&$&)&"+"#-K$
%&A45%&>$.(),,$/",*)>-$',45*4)*%"&.$J%*0$-/-#?$@).-$*0)*$+)..-.$*0#"4>03$N*$%.$
*0-.-$/",*)>-$50)&>-.$*0)*$)#-$(-).4#-A$)&A$4.-A$*"$%&'-#$*0-$.-i4-&5-$"'$&4U
5,-%5$)5%A.$XO#)&*"&$-*$),3$;HHGY3$I0-$()%&$A#)J@)56$"'$Z)&"+"#-$.-i4-&5%&>$

 $
is its high raw error rate which is currently around 11 to 15% (Loit et al. 2019). The raw error rate can be remediated through generating consensus sequences from multiple reads (Loit et al. 2019; Baloğlu et al. 2021), however this means that it is unsuitable for assessing complex communities, at least until techno- logical developments lower the error rate. Currently, Nanopore sequencing is best suited for assessing the presence of pathogens (for which rapid processing is desirable), when sequencing in the field is desirable, or for sequencing sim- ple communities or targeted lineages (Quick et al. 2015; Parker et al. 2017; Pomerantz et al. 2018; Loit et al. 2019; Strassert et al. 2021). LoopSeq Synthetic Long Reads (SLRs) or LoopSeq is the newest technology available for long-read metabarcoding. This method does not actually generate long reads, but relies on Illumina sequencing of barcoded molecules (with barcodes indicating the origin of each molecule). As the name implies, the resulting sequences are stitched together using the barcode information into synthetic long reads. As a result it has the lowest error rates, around 0.005% (Callahan et al. 2021). At present, there are two kits available, one enabling 16S sequenc- ing for prokaryotes, and another targeted for 18S and ITS sequencing for fungi, and is therefore unsuitable for studies interested in the entire rDNA op- eron. 27
Insights into protist diversity from
metabarcoding

Over the past decade, metabarcoding has opened a window to the microbial
world. We’ve certainly come a long way from the early days of environmental
sequencing, from the first studies in 2001 generating ~30 sequences on aver-
age, to large scale sampling efforts such as the TARA Oceans project which
alone generated hundreds of millions of reads from the world’s oceans
(López-García et al. 2001; Moon-Van Der Staay et al. 2001; de Vargas et al.
2015). Both global and local biodiversity surveys have captured snapshots of
the eukaryotic community at different times and places in our oceans, lakes,
soils, and even extreme environments such as hot springs and acid mine drain-
age (Bates et al. 2013; Massana et al. 2015; de Vargas et al. 2015; Duarte
2015; Kopf et al. 2015; Pernice et al. 2016; Khomich et al. 2017; Mahé et al.
2017; Oliverio et al. 2018, 2020; Xue et al. 2018; Boenigk et al. 2018; Giner
et al. 2019; Annenkova et al. 2020; Seppey et al. 2020; Wolf and Vis 2020;
Luan et al. 2020). Putting together these snapshots provided by metabarcoding
has truly revolutionized our understanding of protist diversity and how it is
shaped. Below I briefly summarize some of the key findings revealed by
metabarcoding. This list is by no means exhaustive, and I focus in particular
on findings that are relevant to my thesis.

Protists are diverse and form complex interactions
One of the most striking findings of metabarcoding surveys is just how diverse
protists are. For instance, the Tara Oceans global survey estimated that our
oceans are home to around ~150,000 OTUs. Some of this diversity was un-
known to science before environmental sequencing studies, such as MALVs
(marine alveolates)(Moon-Van Der Staay et al. 2001; Guillou et al. 2008),
MASTs (marine stramenopiles)(López-García et al. 2001; Massana et al.
2002, 2004b) and MASHOL (marine small holozoan clade)(Arroyo et al.
2020). Others were lineages known to science, but their diversity and abun-
dance had previously been underestimated. This was for examples the case for
diplonemids in the surface and deep oceans (de Vargas et al. 2015; Flegontova
et al. 2016), and for apicomplexans in neotropical forest soils (E Eric Ma E et
al. n.d.). Overall, it is heterotrophs and not autotrophs that seem to dominate
each environment both in terms of abundance and diversity (with the possible

28
exception of freshwater systems)(Singer et al. 2021). This hyper-dominance
of heterotrophs indicates that protists are heavily involved in trophic interac-
tions, and indeed, this is supported by network and co-occurrence analyses
(Lima-Mendez et al. 2015; Oliverio et al. 2020). It is also speculated that it is
these interactions or symbioses, both among protists, and with other organ-
isms, that might have been the driving factor for the vast protist diversity we
see today(de Vargas et al. 2015). Some of these interactions are already being
documented by combining environmental sequencing data with imaging tech-
niques such as FISH (fluorescent in-situ hybridization) (e.g. (Massana et al.
2009; Chambouvet et al. 2019; Piwosz et al. 2021)), and single-cell genomics
(Martinez-Garcia et al. 2012).

It should be noted that a big chunk of this protist diversity belongs to the so-
called “rare biosphere”. All samples are usually composed of a few hypera-
bundant taxa, and a long tail of rare taxa (Dunthorn et al. 2014b; Logares et
al. 2015). While sequencing and PCR errors may contribute somewhat to this
rare biosphere, it is established that these rare taxa are real and metabolically
active (though their impact in the ecosystem remains unclear) (Logares et al.
2015). Some of these taxa might be conditionally rare, becoming abundant
when environmental conditions become suitable again, or they can remain
permanently rare, never exceeding a certain abundance (Logares et al. 2014,
2015).

How is protist diversity structured?
Metabarcoding studies are also revealing how protist diversity is structured in
space and time. According to a recent synthesis of community ecology
(Vellend 2010, 2016), there are four main processes that determine commu-
nity assembly: (1) selection from environmental factors such as salinity, pH,
predators etc. can filter out ill-adapted species from a community; (2) disper-
sal of species can allow them to enter new communities, (3) communities can
fluctuate over time simply through ecological drift; (4) and new species are
introduced over evolutionary time through the process of speciation. All of
these processes are thought to act to in conjunction, however, the relative im-
portance of each process in different environments and scales is yet to be es-
tablished (Santoferrara et al. 2020).

One of the questions resolved by metabarcoding was whether “everything is
everywhere”, as elegantly formulated in the Baas Becking hypothesis (the
complete statement is “everything is everywhere, but the environment se-
lects”)(Becking 1934). Under this hypothesis, it was posited that protists have
unlimited dispersal abilities, meaning that a protist taxon can be found in all
its preferred habitats, no matter how geographically distant. Numerous studies
have now shown that this assumption is (almost entirely) false, and that most

 29
protists do display biogeographies, at least in part due to dispersal limitation
(Bates et al. 2013; de Vargas et al. 2015; Lentendu et al. 2018; Singer et al.
2019). For instance, a global soil study found 671 out of 672 OTUs to have
restricted geographic ranges. Therefore, in order to capture the full diversity
of protists, one must sample from a wide variety of locations.

Another key finding revealed by a meta-analysis of metabarcoding studies is
that at the global level, protist communities can be divided into marine, and
non-marine communities, with freshwater communities more similar to those
in soil than in oceans (Singer et al. 2021). (Indeed, it was previously thought
that for protists, freshwater and soil habitats are not so different (Robertson et
al. 1997), however this has since been disputed (Sieber et al. 2020)). Many
lineages dominant in marine habitats (e.g. Radiolaria) are absent in terrestrial
settings, and vice-versa. Altogether this points to salinity being one of the
main factors structuring protist communities at the global scale (Logares et al.
2009; Singer et al. 2021) (also see Paper II). When comparing the marine and
terrestrial realms, the latter have been found to contain far more diversity, es-
pecially in soils (Singer et al. 2021). Terrestrial communities have also been
found to be more heterogenous (Singer et al. 2021), indicating a larger role of
dispersal limitation, and reflecting the many microhabitats found in soils and
freshwaters(Oloo et al. 2016), as opposed to oceans where protist communi-
ties are more homogenized due to the mixing of waters (Richter et al. 2019).

Finally, metabarcoding studies can also test whether general ecological pat-
terns known in plants and animals are also displayed by protists. One example
of this is the latitudinal diversity gradient (LDG)—a poleward decline of spe-
cies richness—which is one of the most well document ecological patterns in
macroorganisms (Hillebrand 2004). The LDG was only very recently detected
in marine surface waters (Ibarbalz et al. 2019), but notably has not been dis-
covered in deep sea waters, or in global soils (Oliverio et al. 2020).

30
How has evolution shaped protist diversity?
Integrating ecology and evolution

Several fundamental questions arise from the patterns described in the previ-
ous section. For instance, why do we observe an increase in species diversity
near the equator in surface oceans? Answering such questions requires an in-
tegration of ecological and evolutionary theory (Cavender-Bares et al. 2009;
Hernández et al. 2013; McPeek 2017; McGill et al. 2019). This is because
ecological patterns are not independent of the evolutionary history of lineages;
it is evolution that influences how species interact with their environment. At
the same time, ecological interactions (with the biotic and abiotic environ-
ment) shape the evolutionary trajectories of lineages. Or as George Evelyn
Hutchinson so eloquently put it: the evolutionary play is carried out in the
ecological theater (Hutchinson 1965). Ecology and evolution (and in particu-
lar macroecology and macroevolution) are often treated as distinct fields in
biology1, but it is an artificial divide.

Investigating questions at the cross roads of ecology and evolution often re-
quires phylogenetic inference, and for protists, the metabarcoding data that is
routinely used for ecological analyses is rarely used for inferring phylogenies
due its limited phylogenetic signal (Berger et al. 2011) (but see Dunthorn et
al. 2014a; Lewitus et al. 2018; Lentendu and Dunthorn 2021). One might ask
why it is not better to use phylogenomic data, which allows robust tree calcu-
lations, to study questions in ecology and evolution. The answer is that
metabarcoding data offers the comprehensive view of protist diversity, and is
often associated with excellent metadata on location, time, and measurements
of abiotic variables.

In this thesis, we introduce long-read metabarcoding of the rDNA of broad
eukaryotic diversity which generates data with greater phylogenetic signal
(Paper I).

1
 It should be pointed out that there are several examples of work that link ecology and evolution
such as the niche conservatism hypothesis which states that ecological niches evolve slowly
along a phylogeny, and closely related species are therefore more likely to occupy similar
niches (Peterson et al. 1999; Ackerly 2003). Another example is the field of paleontology which
for investigates how diversity varied through different climate periods and environmental con-
ditions over time (Hagino and Young 2015).

 31
In addition, we incorporate the vast, existing short-read metabarcoding data in
Paper II to investigate whether the distinctive protist groups in marine and
terrestrial environments the result of a few habitat transitions that have oc-
curred rarely in evolutionary history as is suggested by several studies (Von
Der Heyden et al. 2004; Logares et al. 2007b, 2009; Carr et al. 2017)? Or is
this diversity the result of multiple, frequent, more recent habitat transitions
(Logares et al. 2007a, 2008; Žerdoner Čalasan et al. 2019; Annenkova et al.
2020)? Did eukaryotic life originate in the oceans?

In Paper III, we investigate whether terrestrial and marine habitats exert dif-
ferent pressures on their inhabitants, resulting in systematic differences in the
rate of molecular evolution in terrestrial and marine protists. Furthermore, we
investigate which mechanism is responsible for generating the latitudinal di-
versity gradient in marine surface protists. • A popular explanation is the “ki-
netic energy hypothesis” which posits that the higher temperature in the trop-
ics results in higher metabolic rates and faster generation times, resulting in
an increase in the rate of molecular evolution, and ultimately an increase in
speciation rate (Allen et al. 2002, 2006b; Brown et al. 2004). Indeed faster
rates of evolution in tropical regions have been documented for various
macroorganisms(Davies et al. 2004; Wright et al. 2006; Lumbsch et al. 2008;
Orton et al. 2019) as well as for foraminifera (Allen et al. 2006a). But can the
kinetic energy hypothesis be generalized for all protist groups? Or do other
hypotheses explaining the LDG fit better?

In order to investigate these questions, we used several phylogeny-based
methods and analyses. In the next few sections, I present a brief overview of
the methods used in this thesis.

32
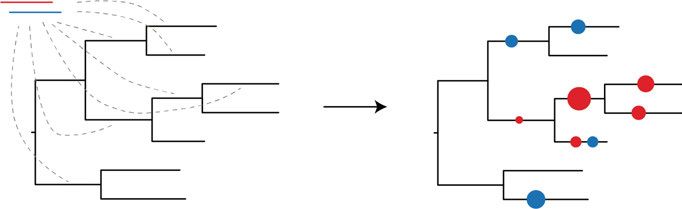
What can phylogenies tell us?

A phylogenetic tree is a hypothesis about the evolutionary relationships of
taxa, usually inferred from sequence data. There are two pieces of information
contained in a phylogeny which will be illustrated with the toy example in
Figure 6. (1) The topology of the tree indicates that A is more closely related
to B than to C. Similarly, A and B are more closely related to C, D and E than
to F and G. And so on. (2) The branch lengths indicate the number of substi-
tutions that have taken place in the respective lineages. Here, the freshwater
clade (C and D) is fast evolving, or has a higher evolutionary rate (See Infer-
ring rates of evolution).

Figure 6. A phylogenetic tree with 7 taxa, where taxa F and G are the out-
group. All taxa are marine except for C and D which are found in freshwater.

We can also infer that the ancestral lineage of all seven taxa was likely marine
(using maximum parsimony), and that there was a transition from marine to
freshwater somewhere along the marked branch (See Ancestral state recon-
struction).

Phylogenetic placement
Classifying environmental diversity based on phylogenies has been demon-
strated to be far more reliable than similarity-based methods (Berger et al.

 33
You can also read