EThe 15Initiative - Proposals and Analysis Agriculture and Food Security Group - E15 Initiative
←
→
Page content transcription
If your browser does not render page correctly, please read the page content below
The   E15                Initiative

Strengthening  the  multilateral  trading  system

         Agriculture and Food Security Group
               Proposals and Analysis

                   Bali, December 2013

                       Co-convened with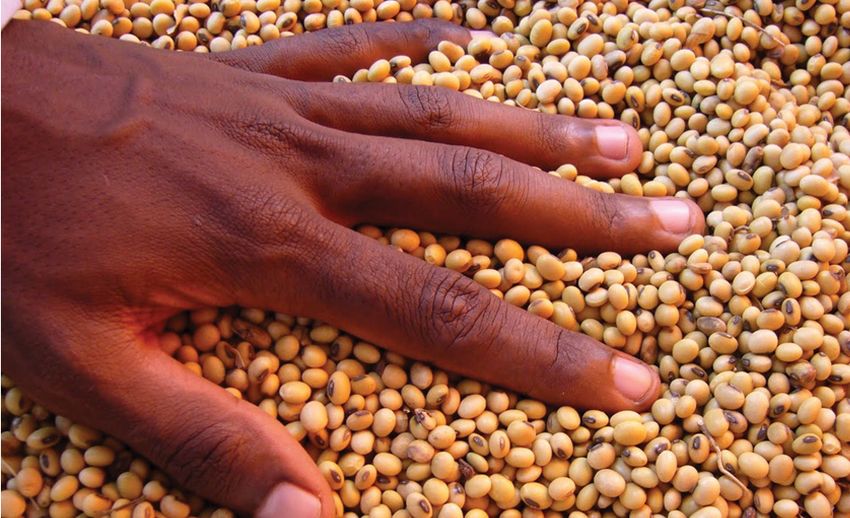
"#$   !%&                '()*)+*),$

!"#$%&"'$%(%&)"'$)*+,"(,-"$#-,)"#-.(%&)/0/"$*

        Agriculture and Food Security Group
              Proposals and Analysis

                  Bali, December 2013

                      Co-convened with
!"#$%&'()*+($,-

Published by

International Centre for Trade and Sustainable Development (ICTSD)
7 Chemin de Balexert, 1219 Geneva, Switzerland
Tel: +41 22 917 8492 - e-mail: ictsd@ictsd.ch - web site: www.ictsd.org

Publisher and Chief Executive:       Ricardo Meléndez-Ortiz
Programmes Director:                 Christophe Bellmann

Acknowledgments

This paper has been produced under the ICTSD Programme on Global Policy and Institutions.

Initiated by ICTSD in 2011, the E15 Initiative is a partnership with the World Economic Forum to create a non-partisan, expert-led
multi-stakeholder dialogue to explore options for strengthening the governance and functioning of the multilateral trade system.
For more information on the initiative and its experts please visit www.e15initiative.org

The Group on Agriculture and Food Security is co-convened with the International Food & Agricultural Trade Policy Council
www.agritrade.org

With the support of:

And ICTSD’s Core and Thematic Donors:

Citation: ICTSD; (2013); Agriculture and Food Security Group; Proposals and Analysis; Geneva, Switzerland, www.ictsd.org

The views expressed in this publication are those of the authors and do not necessarily reflect the views of ICTSD or the funding
institutions.

Copyright ©ICTSD and Partners, 2013. Readers are encouraged to quote this material for educational and non-profit purposes,
provided the source is acknowledged. This work is licensed under the Creative Commons Attribution-Non-commercial-No-Derivative
Works 3.0 License. To view a copy of this license, visit: http://creativecommons.org/licenses/by-nc-nd/3.0/ or send a letter to Creative
Commons, 171 Second Street, Suite 300, San Francisco, California, 94105, USA.
ISSN 2077-5520

                                                                   1
"%$,($,-

     Introduction. By Ricardo Meléndez Ortiz and Ellen Terpstra                         5

     1. Has the Treadmill Changed Direction?
     By Seth Meyer and Joseph Schmidhuber                                               7
     2. Do Yesterday’s Disciplines Fit Today’s Farm Trade?
     By Jean-Christophe Bureau and Sébastien Jean                                       18
     3. Trade and Food Security
     By Bipul Chatterjee and Sophia Murphy                                              38
     4. Agricultural Trade and Food Security: Some Thoughts about a Continuous Debate
     By Eugenio Diaz Bonilla                                                            47
     5. Climate Change Mitigation and Adaptation
     By David Blandford                                                                 69

     6. Transparency, Monitoring and Surveillance
     By Tim Josling                                                                     78

     7. About the Authors                                                               86

     8. List of Expert Group Members                                                    88

                                                       2
to ensure trade policy measures help protect consumers
                                                                     from the negative impacts of higher and more volatile

.$,/%)0",.%$                                                         prices, while at the same time enabling small producers in
                                                                     developing countries to harness the benefits of higher prices.

                                                                       Out of the first group meetings, several major ideas took
                                                                     root. Experts from the group were asked to expand upon
                                                                     these concepts in papers that delve into the rationale behind
  The e15initiative                                                  specific ideas for reforming the way the multilateral trade
                                                                     system deals with agriculture.
   A plethora of critical, impending issues mire the
multilateral trading system of today. Ensuring food security            The second paper in this compilation, Do Yesterday’s
in times of high and volatile prices, addressing concerns            Disciplines Fit Today’s Farm Trade?, is an issue paper by
around natural resource scarcity or scaling up sustainable           Jean-Christophe Bureau and Sébastien Jean that addresses
energy production and diffusion, are just a few of many.             the challenges and policy options for agriculture at the Bali
The fragmentation of production through highly complex               Ministerial Conference (MC9). The authors argue that, in
global value chains also poses critical challenges at the            light of the current challenges such as export restrictions,
analytical and policy level. In the meantime, preferential           price fluctuations, biofuels policies, climate change, etc,
trade agreements continue to proliferate and have now                agricultural negotiations need to be significantly refocused,
become the de facto locus to deepen integration and further          and in some cases rescaled.
liberalisation. In the face of the Doha deadlock, some have
questioned the way in which negotiations are conducted,                Next comes a Think Piece by Bipul Chatterjee and Sophia
arguing that the WTO’s established practices of decision-            Murphy, e15 Trade and Food Security. The authors emphasize
making, such as the notion of single undertaking, are ill-           the fact that international trade in agricultural commodities
suited to the fast changing challenges of our times.                 need better rules, as the Doha Agenda has been overtaken by
                                                                     time and events. Looking at the Doha Agenda, the authors
  In light of these pressing challenges, the e15initiative           assert, there are many issues on which governments could
is a process aimed at exploring possible futures for the             advance if they were to focus on confidence-building and
multilateral trade system. Launched in 2012 by ICTSD,                ensuring that governments can protect their food security
the initiative engages top global experts and institutions           interests while working within a multilateral trading system.
in thinking ahead on critical issues facing the multilateral
trading system, bringing fresh ideas to the policy                      Fourth, is an Issue Paper by Eugenio Diaz Bonilla titled Food
environment, solutions and opportunities for governance              Security. Diaz Bonilla looks in detail at the challenges that
reform.                                                              have created the recent global food shortages. He breaks the
                                                                     issues down into the conceptual issues behind food security,
  Within this paper                                                  the high food prices in the present and for the future, the
                                                                     links between energy, biofuels and food prices, and climate
   This paper is a compilation of the material that has been         change. Also, the means by which food security has been
produced by the working group on Agriculture, Food Security          discussed in the Uruguay and Doha rounds and the WTO
and Sustainable Development. The expert group is convened            disciplines for dealing with food security are reviewed.
by the International Centre for Trade and Sustainable
Development (ICTSD) alongside the International Food &                 The following Think Piece, International Trade Disciplines
Agricultural Trade Policy Council (IPC) to explore the many          and Policy Measures to Address Climate Change Mitigation
changes facing the global food trading system and their              and Adaptation in Agriculture by David Blandford, is an in-
implications for sustainable development. Their objective is         depth analysis of the implications of climate change policies
to develop concrete policy options the multilateral trading          on agriculture and trade. He surmises that there is a need
system could employ to positively impact agriculture trade           for greater international concensus on what domestic policy
and improve food security, especially for the poorest global         measures are likely to be effective for tackling the effects
citizens.                                                            of climate change in agriculture and are also the least trade
                                                                     distorting. Out of this need, Blandford recommends a setting
  The background paper that appears first in this compilation        a series of priorities for dealing with climate change in
set the context for the launch of the expert group’s dialogue.       current trade negotiations.
It looks at the conditions under which the global food
market shifted to become supply constrained, throwing food             In the final piece by Tim Josling titled Transparency,
security into question, especially for the poorest nations.          Monitoring and Surveillance, the importance of transparency
It then examines the implications for trade negotiations             for a well-functioning agricultural trade system is
where policy shifts have not yet taken place as the Doha             highlighted. After reviewing the mechanisms in which
Round agreements still focus on protecting producers. The            transparency could improve food and agriculture markets,
background paper advocates for a twin track approach                 Josling makes a series of recommendations for making

                                                                 3
constructive changes to the Agreement on Agriculture as
part of the Doha Round at the Bali Ministerial Conference.
The work of the e15 expert group on Agriculture Trade,
Food Security and Sustainable Development offers a strong,
innovative set of ideas for reforming and improving how
agriculture is managed in the multilateral trading system.
The pieces within this compilation are initial concepts that
offer insight into the thoughts and discussions of the leading
experts that make up the working group. While the ideas
presented here only reflect the views of their respective
authors, together, they begin to form a better picture of
possible direction in which the multilateral trading system
could evolve in order to manage trends of the current and
future global marketplace.
Further information about the expert group on
the Functioning of the WTO, the experts, and latest
developments with the e15initiative can be found at www.
e15initiative.org
Ricardo Meléndez Ortiz Ellen Terpstra
Chief Executive, ICTSD Chief Executive, IPC
4Agricultural policy formation during this period
reflected the pressure on producer income, leading to the
1!-2,1(2,/(!)+.''2 development of an array of price supports, buffer stock
programs, acreage set asides and export subsidies, by a
handful of developed countries, to dispose of excess supplies
"1!$*()2)./(",.%$3 onto international markets, propping up domestic farm
income. Fear of a competing process of supporting, stocking
and subsidized exports by a small number of developed
Seth Meyer and Joseph Schmidhuber countries motivated the Doha Development Agenda (DDA)
negotiations to reduce export subsidies and improve market
access around the world. Naturally, little attention was paid
While this paper draws heavily on the results and dynamics to ensuring export flows given abundant supplies. With
presented in Alexandratos and Bruinsma 2012, it explores low prices and abundant world stocks, such contingencies
the reports limitations with respect to bioenergy and other seemed unnecessary.
uncertainties and how they may influence trade policy
and negotiations. For decades agricultural commodity
markets in developed countries have been characterized
by Cochrane’s treadmill where with each advancement
in technology, supplies shifted out, pressing against an *'%7!'28%80'!,.%$2*/%&,12,%2-'%&9270,2
inelastic demand (Cochrane 1958). Food demand for crops, &.,12&.)(2/(*.%$!'2:!/.!,.%$-
shifted outward with growth in population and income
around the world, but failed to keep up with productivity
growth for several primary agricultural commodities setting Over the last 40 years, world population expanded
crop prices on a multi-decade path of decline. Under such from 3.7 billion people in 1970 to 7.0 billion people today,
circumstances, the benefits of technological progress, akin to a near doubling. Over the next 40 years, the global
through increased productivity and falling production population is expected to growth by another 2.3 billion
costs, were passed on to domestic consumers and to people (UN, 2011) and to reach a new high of 9.3 billion
trading partners through low prices and abundant supplies. people by 2050. This means that the global population will
As a result of these productivity gains, since the 1970s, increase at a much slower rate and even with significantly
per-capita calorie consumption in the developing world smaller absolute annual increments. As a result, the growth
improved, but with varied results across regions (Figure of agricultural production and consumption will necessarily
1). There has been a persistent but falling number and grow less rapidly than in previous decades. Population
share of malnourished at a global scale (Figure 2), while in growth will, however, remain high in some countries and it is
regions where population growth has been most rapid, sub- precisely these countries which currently struggle with high
Saharan Africa for example, the number of malnourished levels of undernourishment; they are likely to face continued
has increased even as their share of the population falls hunger problems in the foreseeable future, albeit at less
(Figure 3). drastic levels.
3500
4.*0/(256
3300
Kcal/person/day, by region and country groups,
3100
1990-2007
2900
Kcal/person/day
'(*($)6
2700
2500 Developing
South Asia
2300
N. East/N. Africa
2100
1900 Developed
E. Asia excl. China
1700
Sub Saharan Africa
1500
China
Developing excl. S. Asia
00
04
06
02
0
4
8
6
0
4
8
6
2
0
4
8
6
2
Lat. America
92
198
198
198
198
198
199
199
199
199
197
197
197
197
197
20
20
20
20
19
(Source: Alexandratos and Bruinsma 2012)
5The overall slowdown in population growth, however, between developed and developing countries. Despite the
masks considerable differences at the regional level. While outlook towards a richer world and a narrowing gap between
much of the developed world will grow at slower than rich and poor countries, income disparities within many
average rates, with more and more countries entering into developing countries are expected to remain significant. In
absolute population declines by 2050, several developing such a setting of high intra-country income disparity, income
regions will continue to exhibit high population growth growth alone will not suffice to eliminate poverty and
rates. As a result, many of these countries with rapidly hunger. It will require measures to stimulate pro-poor growth
growing populations are also countries which currently have but also direct and targeted food security interventions,
above average rates of malnutrition, resource constraints and such as food and social safety nets to make more visible
significant food security problems. Many of them are in sub- inroads into hunger reduction (SOFI 2012). The underlying
Saharan Africa. projections of this note (The latest projections from the
FAO’s Global Perspective Studies Group, World Agriculture
Towards 2030/2050: The 2012 Revision, Alexandratos and
.$"%+(2*/%&,12,%2"%$,.$0(92!'7(.,2!,2 Bruinsma 2012) do not foresee such a radical shift in policies.
This is reflected both in a slow reduction of the number of
'%&(/2/!,(- undernourished but also in dampened growth rates for
The outlook to 2050 not only suggests that the world will
be more populous, but also that it will be considerably more 7 In general, the projected demand for food is effective demand rather
affluent. Global GDP is projected to grow 2.5-fold by 2050 than potential demand, i.e. demand by those rich enough to obtain
(World Bank 2010), resulting in a narrowing income gap needed food supplies.
1100 45
4.*0/(2;6
980
1000 40
Undernourishment in the Developing World
PERCENTAGE UNDERNOURISHED
901 885
900 852 852 35
800 30 '(*($)6
MILLIONS
700 25 Prevalence (right axis)
600 23.2% 16,8% 20 Number (left axis)
15,5% 14,9% WFS TARGET
500 18,3% 15
400 10 (Source: SOFI 2012)
MDG TARGET
300 5
0
92
1
6
09
5
12
00
1
-0
20
-
0-
7-
10
04
-2
0
9
20
99
20
19
20
19
250 60 4.*0/(2projected food demand (with a continuing gap between potential spurred food imports by developing countries in the past and
and effective demand)1. is expected to accelerate these trade flows in the future (see
Figure 5). Urbanization, greater affluence and a more formalized
The slowdown in population growth in conjunction with food chain also come at a cost. They are often associated with
growing saturation levels in food demand for some segments increased losses, notably processing losses and food waste at the
of the population are expected to translate into slower overall household level. In addition, urbanization promotes sedentary
growth rates for demand and supply. The latest FAO projections lifestyles and reduces overall calorie requirements. This often
assert that agricultural production growth will increase by some results, without commensurate reductions in food intakes, in
60 percent between 2005 and 2050 to meet effective demand. an increase in the prevalence of overweight and obesity, which
This marks a significant departure from the expansion by 170 can coexist with malnutrition and undernourishment (“double
percent seen in the previous 45 year period. burden” of malnutrition).
4/%+2/0/!'2,%20/7!$ /.-.$*2$(,2.+8%/,2$(()-2.$2)(:('%8.$*2
"%0$,/.(-
In addition to population and income growth the long-term
outlook foresees the continued shift towards a world that is more Changing diets
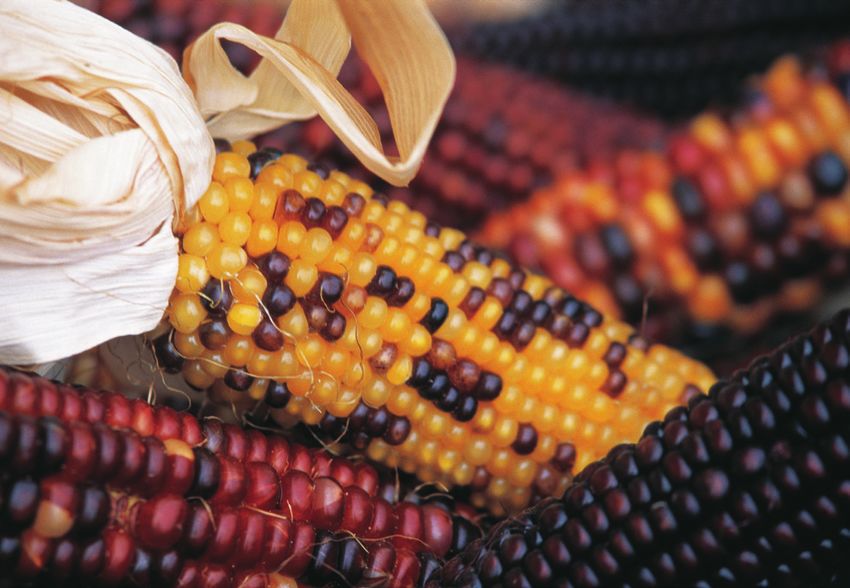
populous and affluent, but also much more urban (Figure 4).
While only 37% of the world’s population resided in urban areas With urbanization and income growth come increasing
in 1970, the share of urban dwellers had risen to 57% by 2010 consumption of vegetable oils and livestock products
and is projected to be over 67% by 20502. (meat and dairy); while these factors have already lifted
meat and milk consumption in many developing countries,
Food consumption in urban areas means that more people substantial gaps in consumption levels between developed
will exit the informal rural food environments of subsistence and developing countries remain and are expected to remain
or semi-subsistence production to enter formalized urban (Alexandratos and Bruinsma op cit) over the next four
food chains. Urbanization brings with it less time to prepare decades. Cultural and religious factors, as well as persistent
food, more demand for fast food and convenience products poverty in some countries, support the projection of a
and overall change in food consumption patterns. But it also persistent gap in meat consumption and slowing growth in
means a change in food supply and distribution channels. Better world consumption.
infrastructure, shorter and cheaper transportation linkages, and
supermarkets with convenience products and cold chains make Feed use
urbanized markets accessible to foreign food suppliers. This has
Feed consumption is also to undergo a geographic shift with
nearly all growth in feed use and livestock numbers expected
to occur in the developing world. In conjunction, trade in
1 http://esa.un.org/unup/ feed grains, oilseeds and oilseed meals is likely to grow, a
substantial portion through south-south trade (Figure 6).
WORLD URBAN VS. RURAL POPULATION
7,0
4.*0/(2=6
urban
6,0 Urban and rural population, past and projected,
UN Population Division, 2011
5,0
4,0
BILLION
3,0 rural
2,0
1,0
0,0
1950 1960 1970 1980 1990 2000 2010 2020 2030 2040 2050
8Feed use is projected to grow at a faster rate than food use ,1(2/.-(2%427.%40('-62$(&2!$)2
over the coming decades. Alexandratos and Bruinsma see
a 40% growth in cereals food consumption by 2050, while 8%,($,.!''?2'!/*(2)(+!$)24/%+2,1(2
non-food uses, primarily feed use, grows at over 50% over ($(/*?2-(",%/
the same period. The difference is even more pronounced in
developing countries where cereal food use grows by 50%
while non-food use, again almost exclusively feed use in
these countries, grows by over 75% during the same period. New demands
These developments in feed use are driven by a number
of factors. First, a combination of cost and health aspects The picture of the long term outlook described thus far is one
has tilted consumption patterns from ruminant to pig and of a continuation of demand constrained food environment,
poultry meat in developed and developing countries alike. rising incomes, population, and urbanization notwithstanding.
In general, this raises feed requirements, particularly where In fact, the outlook for key drivers of the global food system
rearing ruminants was based on pasture and roughage suggests a strong deceleration of overall demand growth from
feeding. At the same time, intensity factors for non- 170 percent over the last 45 years to 60 percent in the next 45
ruminant feeding have increased, i.e. modern, integrated years. An inspection of actual demand growth over the past seven
and formalized livestock feeding operations increasingly rely years, however, suggests that a concentration of the analysis of
on cereal and oilmeal based feeds as opposed to food waste food and feed demand alone is unlikely to capture the demand
and other residues commonly used in ‘backyard’ feeding. dynamics of the future. Persistently high energy prices and
While higher intensity factors are likely to boost compound policies to promote the use of agricultural products for biofuel
feed requirements, more intensive production systems production have established new dynamics in the traditionally
also stand to benefit from higher feeding efficiency rates, slow growing food markets. These factors also pose the question
dampening the effects. More intensive and mature feeding as to whether a fundamental examination of the past demand
systems benefit from technical progress, resulting in lower constrained market paradigm is warranted. These issues will be
feed requirements per unit of output (meat, milk, eggs, or addressed in the next section.
aquaculture). The shift in the feeding systems will also drive
feed grain trade. To meet their feed requirements, developing Modern biofuel policies have their origins in the oil shocks of
countries will have to import an increasing share of their feed the 1970, followed by a steady decline in commodity prices.
grain needs from developed markets, where feed use is likely Brazil supported the development of a domestic sugarcane based
to stagnate in view of saturation of consumption patterns ethanol production industry and encouraged the creation of the
for livestock products and increasingly mature and efficient needed consumer infrastructure. In subsequent years, low oil
feeding systems. prices would weigh heavily on its profitability. During this same
period, the US used its most readily convertible feedstock, maize,
to do the same. Historically, policy support in both countries
has been substantial with a gradual shift from subsidization to
mandates or use requirements, shifting the burden from tax
20
4.*0/(2>6
Net agricultural trade of developing countries,
10 data and projections,
(Source: Alexandratos and Bruinsma 2012)
0
BILLION 2004-06ICPS
1,0
-20
-30
-40
-50
1960 1970 1980 1990 2000 2010 2020 2030 2040 2050
79payers to motorfuel consumers. Liberalization of the ethanol relative size of the two markets and the extent to which current
market in Brazil occurred toward the end of the 1990s although policy actually supports prices is key to understanding future
some tax preferences remain along with the minimum blending demand. If demand were driven purely by policy, such policies
requirement, currently 20% in all gasoline. The US instituted could be managed similar to historic buffer stock programs
direct subsidies to fuel blenders in the 1980s which only expired to maintain commodity price stability to support and smooth
at the end of 20113, leaving a system of mandates, established in farm income, but at the expense of higher commodity prices
2005 and expanded in 2007, as the most visible and ‘important’ to consumers. The elasticity of demand would be reduced but
means ofsupport (Thompson et al). managed to achieve stability. Indeed biofuels were envisioned
to play just such a role through market demand early in the
From an energy user to an energy producer evolution of policy.
Traditionally, the largest direct effect of energy markets into The current situation, however, might offer a different picture
agriculture markets was through input costs, with the agricultural of future demand relative to that seen historically and envisioned
sector being a large energy user in both farm and supply chain in FAO’s long run outlook. With the expiration of ethanol
operations as well through the use of nitrogen fertilizers derived blenders subsidy in US and in the midst of the of one of the worst
from natural gas. Demand from the energy market, for example droughts in half a century there were assertions that a waiver
through the production of biofuels and biomass for electrical of the mandate would have little immediate effect on reducing
generation, presents a fundamentally different potential market demand for ethanol and therefore ethanol prices.4 To a point,
for agricultural commodities as the size of the energy market biofuel production has grown and, given the size of the energy
dwarfs current renewable energy production from agriculture. Of market, a long run link has been established between the two
course, the use of agricultural commodities in the production of markets which potentially provides significant long run demand
energy is not new. In various forms, crops and production residues elasticity to commodity markets (De Gorter and Just 2008;
have contributed to the energy sector from simple direct burn of Balcombe and Rapsomanikis).
commodities and crop residues, and more recently in their large-
scale conversion to liquid fuels for use in the transport sector. In a scenario of large scale market demand for energy
production inputs from agriculture to produce liquid motorfuels,
The use of agricultural commodities in the production of petroleum prices set a long run floor under feedstock prices
biofuels, among other factors, has increased commodity prices in and bioenergy competes with stockholding as the regulating
recent years (Abbott et al., 2008, 2009; Dewbre et al., 2008; EC, mechanism for prices, with notable differences. Biofuels,
2008; ERS, 2008; IFPRI, 2007; Meyers and Meyer, 2008; OECD- depending on the underlying price of energy, can replace
FAO, 2008, 2010; World Bank, 2008; Westhoff, 2010), but the stockholding as the mechanism which establishes a commodity
2 The biodiesel blenders credit of $1.00 per gallon was recently reinstated : Does the RFS matter?
through 2013.
1200 4.*0/(2@6
Cereal feed (million tons) and livestock
1000 production ($billion)
AND $ BILLION LIVESTOCK PROD.
'(*($)6
MILLION TONS CEREALS FEED
800
Feed Developed
600 Livestock Developed
Feed Developing
400 Livestock Developing
(Source: Alexandratos and Bruinsma 2012)
200
0
1980 1990 2000 2010 2020 2030 2040 2050
77floor price and depending on the long run price of oil, could serve the assumed demand growth is far slower than the 170%
to keep agricultural commodity prices high and the market in a growth between 1961 and the 2005/07 base year, this is not
perpetual ‘stock-out’ and exposed to short run supply crunches to imply that such growth will be easier to achieve.6 Land
which will rely on competitive bidding between food and energy and water resource use are likely to face greater constraints
markets. at the margins of growth than have been seen in the past.
Both quantity and quality of land and water availability will
be more limited and will come into production at a greater
,%&!/)-2!2-088'?2"%$-,/!.$()2&%/') cost. In the case of water, resource depletion, salinization
and competition from non-agricultural uses will hamper
the expansion of irrigated area. To increase production, the
With growth in population and income and the possibility world will continue to rely on gains in crop yields, in fact this
of increased demand, and a higher demand elasticity dependence will even grow (Table 1).
from bioenergy production, the existing resource base will
be called on to meet the growing demand. Output grew Land constraints
impressively over the last 40 years, but expectations are
that future sustainable gains in output will be more difficult At the global level there is a significant amount of
to achieve. Other factors such as climate change and energy land with rainfed crop production potential, 7.2 billion
prices will produce additional challenges. hectares, of various degrees of suitability of which 1.6 billion
hectares are currently in use for crop production, including
Sources of productivity Growth irrigated area (GAEZ and Fischer, G. et al, 2002, 2011). A
significant portion of the land with potential for expansion
Growth in agricultural output comes from an expansion of is currently under forest and other uses or of only marginal
area under cultivation, increased yields per planted area and suitability. Estimates suggest that there exist some 1.4 billion
increased cropping intensity (such as multiple plantings of hectares of prime land that could be brought into cultivation.
rice crops in a given year or double cropping of soybeans and Much would come at the expense of pastures, however, and
wheat over a season). In their outlook work, Alexandratos would require considerable investment to make the land
and Bruinsma asses effective demand in 2050 and proceed suitable for production and more accessible to markets. The
to outline how the anticipated 60% growth in production can ‘spare land’ is concentrated in a small number of countries;
be met by available productive resources (Table 1).5 While constraints may be very pronounced in other regions. Where
3 The authors’ numbers represent effective demand, that is, not the 4 It bears repeating that this effective demand assumes limited growth
volume necessary to adequately feed the world, but the volume in demand from bioenergy production and thus represents a low end
obtained from economic and productive resources available to demand estimate from this particular factor, but significant uncertainty
consumers. remains in other demand factors as well.
,!7'(256
Sources of growth in crop production (percent)
(Source: Alexandratos and Bruinsma 2012)
Arable land Increases in Yield
expansion cropping intensity increases
1961 - 2007 2005/07- 1961 - 2007 2005/07- 1961 - 2007 2005/07-
2050 2050 2050
All developing countries 23 21 8 6 70 38
Sub-Saharan Africa 31 20 31 6 38 74
Near East/North Africa 17 0 22 20 62 80
Latin America and Caribbean 40 40 7 7 53 53
South Asia 6 6 12 2 82 92
East Asia 28 0 -6 15 77 85
World 14 10 9 10 77 80
71these constraints are coupled with fast population growth increasing yields remain a significant concern in many countries,
and inadequate income opportunities, land scarcity can threatening improvements in local food supplies in countries
lead to more poverty and migration, and will remain where they are most needed.
a significant constraint in the quest for achieving food
security for all. The uneven distribution of this land will also Shortfalls in yield growth or greater growth in demand,
contribute to increased trade to meet local demand.7 including bioenergy, will necessarily lead to greater
pressure to maintain and expand land in cultivation. While
Yield potential Alexandratos and Bruinsma acknowledge that there is a
tremendous amount of uncertainty surrounding the yield and
Yield growth has been the mainstay of historic production production estimates as a result of climate change, water
increases needed to meet demand, but crop yield growth rates availability and sustainable practices, the system does not
have slowed considerably over the last several decades raising assess the impact of commodity prices in yield response and
concerns that this trend will continue in the future, even as thus offers some potential for growth under higher prices.
productivity growth increasing relies on gains in this area (Figure
7). In their analysis, Alexandratos and Bruinsma determine that Water resources
80% of future productivity growth will come from growth in
yields (Table 1). Water is another critical resource in agricultural
production, and irrigation has played a strong role in
Developing countries will have more land expansion but contributing to past yield increases. World area equipped
developed countries will actually lose area in cultivation to an for irrigation has doubled since the 1960s, but the potential
extent that cropping intensity growth will not offset area losses for further expansion is limited. While water resources are
so yields will be responsible for the entirety of productivity globally abundant, they are extremely scarce in the Near
growth. Recalling that Alexandratos and Bruinsma construct East and North Africa, South Asia and in northern China.
their estimates in a demand side analysis (they establish what Most of the world’s irrigated agriculture currently occurs in
demand is anticipated to be and then determine the resources developing countries (almost half of this in China and India),
employed to meet that demand), land exits production both where it accounts for some 60 percent of cereal production.
because it goes to competing uses and because growth in A net increase of 20 million hectares is expected by 2050,
yields are sufficient to allow some land to exit production.8 however, investment needs in irrigation to 2050 will need
Other regions, notably sub-Saharan Africa and Latin America, to be much higher to account for depreciation of existing
are expected to see more rapid growth in yields from a very infrastructure.
low base, closing the gap between actual and potential yields,
boosting supplies, assuming of course the presence of supportive
economic and institutional conditions. Local constraints to
6 The loss of land in the developing world while simultaneously there
5 For more details on land availability see chapter 4 of Alexandratos and are gains in land area in the developed world remains a controversial
Bruinsma. Agriculture Toward 2050: The 2012 Revision. conclusion of the report.
3,00
4.*0/(2A6
2,50 Annual growth rates of world cereal production and yields
(over preceding 25-year period)
2,00
(Source: Alexandratos and Bruinsma 2012)
GROWTH RATE
1,50
1,00
0,50
0,00
-0,50
1985 1990 1995 2000 2005 2010
721%&2"%0')27.%($(/*?2"1!$*(2,1(2 '.$#.$*2,1(2$(&2+!/#(,2($:./%$+($,2,%2
,/!).,.%$!'2+!/#(,2%0,'%%#3 "1!$*(-2.$2,1(2,/!)(2$(*%,.!,.%$-
With infrastructure in place, improvements in processing Any shift in the dynamics between demand driven and
technology and high oil prices, biofuels now appear to supply constrained markets or even the exacerbation of
be far more competitive even in the absence of subsidies. regional differences which affects import dependency will
Should current petroleum, or more broadly energy prices, alter the motivations of partners in trade negotiations. While
be a harbinger for the future, the downward pressure on providing an overview of some of the principal shifts in the
agricultural commodity prices could be a matter of the past. conditions of world food markets and subsequent trade
While such linkages could see increased elasticity of demand orientation over the past 50 years, in general, and the last
which, over a range, would show increased sensitivity to decade in particular, further examination of the impact on
prices and thus potentially stabilizing commodity prices, the trade of a shift towards increased energy production (or other
agriculture sector would also inherit the volatility in energy shifts in demand) is warranted.
and petroleum markets as the ‘stabilized’ price range varies
depending on the prevailing prices in the energy sector. The basic question now is how such a possible change in the
basic market environment will affect the trade negotiations in
How elastic is agricultural supply is in the long run relative the future; and, whether and how the shift from a Cochrane-
to traditional commodity demand? With the potential type market environment, towards a Jevons-type market
addition of demand for renewable energy production what are environment could and should be reflected in current and
the prospects for agriculture to deliver additional output to perspective trade negotiations; specifically, whether the
return prices to a downward path? It has been suggested, as agenda negotiated under the DDA should be revisited with
discussed above, that the supply curve may become steeper a view to addressing not only trade distortions that put
and that shifts to the right (growth in area and yields) may be a downward pressure on international prices but also to
more constrained in the future while the size of the energy introducing binding disciplines that help reduce international
market and a potentially highly elastic long run demand to price hikes and excessive price volatility. Questions also arise
produce energy would significantly change the supply and as to whether the there is enough and appropriate policy
demand paradigm, away from Cochran (1958) and towards space in the DDA to ensure that domestic food security
Jevons (1865) where energy markets absorb any ‘excess’ measures (e.g. domestic food subsidy schemes that can
production keeping markets tight and prices elevated. trigger inelastic purchases on international food markets) are
being implemented without causing or exacerbating price
The impact of increased elasticity of demand has also hikes on these markets; these questions will be addressed in
significant implications for agricultural land and input use the next section of this background note.
as well as associated greenhouse gas (GHG) emissions.
On a global scale, the historic inelasticity of demand for
agricultural outputs meant technological advancements ,1(2B%')2$%/+!'C628%'.".(-2.$2!2)(+!$)2
were considered ‘land saving’. Hertel (2012) further explores "%$-,/!.$()2+!/#(,2($:./%$+($,
the issue in the context of technological change and land
use (instead comparing Jevons (op cite) to Borlaug). The
examination shows that regional differences in supply and The policy environment during the negotiations and
demand elasticities coupled with regional improvements in the implementation of the Uruguay Round Agreement on
technology, leads to varying changes in agriculture land area. Agriculture (URAA) was generally characterized by (i) high
Coupled with local land emissions efficiencies, technological and production-coupled domestic support, (ii) high and
improvements may not lead directly to reduced GHG often prohibitively high border protection, and (iii) export
emissions. While much of effort examines technological subsidies necessary to dispose of domestic surpluses onto
improvements in supply, the implications for both land use international markets. Import protection and export subsidies
and GHG emissions from an increase in demand elasticity exerted downward pressure on international prices and made
through the coupling of energy and agricultural markets is them more volatile. Low and volatile prices in turn provided
apparent. With increased demand elasticity, technological disincentives to farmers in developing countries, resulting in
improvements in the agricultural sector, including both lower domestic food availability; in tandem, they provided
improved production efficiencies as well as improved incentives for consumers to shift consumption patterns
processing efficiencies in the conversion of agricultural towards the cheap and subsidized imported foods.
commodities to energy, are less likely to result in ‘land saving’
and are even more problematic for GHG emissions depending These policies generally helped net-food importing countries
on the emissions efficiencies and supply elasticities for land with limited domestic supply capacity, low foreign exchange
around the world (Hertel op. cite). The energy market could availability and large urban populations (amongst them most
simply absorb advances in technology, keeping prices high countries in the Near East North African region); but they
and pulling land into production. undermined the capacity of many countries with untapped
7:food production potentials, notably in sub-Saharan Africa to While these proposals added considerable complexity to
feed their own populations and stifled domestic productivity the existing trade policy framework of the URAA, they did
growth. not change the fundamental policy orientation to address
problems of low international prices and structural surpluses.
The Uruguay Round Agreement on Agriculture (URAA) Essentially all URAA and DDA trade disciples aimed to protect
aimed to address these distortions by proposing and producers, not consumers. This also holds for the need to
implementing a 3-pillar programme that introduced stricter circumscribe subsidies for biofuel production. These subsidies
disciplines on (i) domestic support, (ii) import protection, and affect agricultural markets in a different manner than the
(iii) export competition. It also tried to address, albeit much traditional subsidies afforded to agricultural producers.
less prominently and much less effectively, possible negative Unlike subsidies for food production, biofuel subsidies do not
impacts of rising prices for food consumers. The URAA also result in lower international prices or surpluses that need
provided options to support farmers in developing countries to be disposed of on international markets. Instead, excess
whose livelihoods were undermined for decades by developed production is siphoned off by the energy market and, rather
countries’ trade policy measures. Under the so-called than depressing international prices, these subsidies actually
Marrakesh Decision of the URAA, considerable policy space support them.
was accorded to (“low-income/resource poor”) farmers in
developing countries, particularly in the area of compensatory How little protection was afforded to consumers became
finance, food aid, stockholding, or support to investments increasingly evident when the overall market environment
in agricultural productivity (Art 6.2, AoA). More generally, started to change in the mid-2000s. In 2007/08, crop failures
almost all disciplines of the URAA aimed at limiting, mitigating in the Ukraine and Australia in conjunction with mandated
or coping with the impacts of depressed international prices. demand for growing amounts of biofuel feedstocks triggered
With the exception of the weak disciplines of Art 12 AoA (and the first in a series of three price hikes and revealed that the
GATT 11.1), virtually no URAA measure tried to discipline trade international market environment has shifted from one of low
measures that can induce price increases on international international prices, high food reserves and large structural
markets such as export restrictions, export taxes or import surpluses to one of high and volatile prices, dwindling food
subsidies. reserves and structural deficits.
The negotiations of the Doha Development Agreement Notwithstanding these changes in the market environment,
(DDA) started in the same market environment that had the negotiations continued to focus on disciplines that help
determined the architecture of and the negotiating strategies avert low prices and protect producers. They were effectively
under the URAA. In broad terms, the DDA negotiations put on halt only in 2008 without having reached a consensus
sought to continue, deepen and broaden the URAA efforts to on such trade disciplines; in fact such disciplines had already
circumscribe domestic support, export competition and import lost some of their importance due to the shift in the overall
protection. The negotiations aimed at strengthening the market environment.
sometimes non-binding nature of URAA disciplines (“squeeze
remaining water out of the tariffs”, further reduce/eliminate
export subsidies, and reduce farm support). The negotiating
groups that represented a large number of developing
countries focused their interests on extending privileges that
were accorded to developed countries in the URAA, thus
reducing the real or perceived asymmetries in the existing
URAA disciplines. The draft modalities reflect these efforts
in various areas, notably in an evolution of an increasingly 8 Products categorized by height of starting tariff. Higher bands: steeper
complicated set of proposals to reduce of import protection, cuts. In the March 2003 draft modalities, the formulas in each band use
the Uruguay Round (UR) approach (average cuts subject to minimums).
known as the “Banded approach9” or the “Blended approach10”
or the “Tiered Approach11” with additional exceptions for
“Special Products12”. It also resulted in proposals to afford
them access to special protection options such as the Special 79 Used in the Cancún draft frameworks, the approach “blends” three
formulas. An Uruguay Round approach applies to one category, a Swiss
Safeguard Mechanism (SSM), a flexible tariff scheme that formula to another, and a third is duty-free.
allows developing countries to raise tariffs temporarily to
deal with import surges or price falls. Measures to ensure
food security were also strengthened through less distortive 77 Products categorized by height of starting tariff. Higher tiers (or bands):
steeper cuts. Type of formula and number of tiers? In the August 2004
food aid provisions (Art 10.4) with proposals to ensure that
agreed framework this is still to be negotiated.
food aid remains needs-driven, is fully in grant form, not tied
to commercial exports, and linked to development objectives.
And finally the DDA modalities included the introduction of
71 Products for which developing countries have sought extra flexibility in
tighter export credit provisions with strengthened disciplines market access for food and livelihood security and rural development.
on repayment periods, commodity space (basic foodstuffs)
and interest rates (self-financing).
73,1(2B$(&2$%/+!'C92,/!)(2$(*%,.!,.%$-2 of higher and more volatile prices and (ii) at the same time
enable small producers in developing countries to harness the
!$)24%%)2-("0/.,? benefits of higher prices. With respect to consumer protection,
the research agenda would try to identify practical proposals
to limit the options for, and mitigate the impacts of supply
The shift from a demand constrained towards a supply controls, export restrictions and taxes. On the producer side,
constrained market environment has also shifted emphasis the new research agenda should explore practical proposals
in the food security debate. While the low price environment that ensure that small scale producers have access to better
focused on the need to ensure sustainable food production, infrastructure, can improve access to inputs, protect the
the high price environment brought aspects of food access resource base and manage more effectively their production
and affordability to the fore (Figure 8). As food expenditure risks.
accounts for high shares of total expenditures for the poor
(sometimes in excess of 70%), there were growing concern
that high food prices now become the driving force of hunger "%$"'0-.%$-
and malnutrition. The spikes in undernourishment reported in
2008 and 2010 corroborated these initial concerns.
Several agricultural commodity prices surged in the
Recent analysis of trends in food insecurity (SOFI 2012, See summer of 2012, the third run-up in the last five years, and
figures 2 and 3) suggest that high food prices have stopped agricultural commodity prices remain elevated relative
the trend towards global improvements in undernourishment, to historical trends. It is unclear if the recent price spikes
caused deterioration in the quality of the diet, and forced are a result of transient factors, and the long-run trend of
poor consumers to forego other important necessities such as declining prices will re-establish itself or if there has been a
health care or the education of their children. This shift from fundamental shift from a demand constrained market to
a low price environment towards a high price environment has one constrained by supply. A persistent shift to a supply
resulted in a change in food security policies towards measures constrained market, perhaps one where energy markets
that help protect consumers, notably food safety nets, cash provide a large and elastic source of demand for agricultural
transfer programmes and targeted assistance schemes. output, has important implications for the policy process.
Trade negotiations which emphasize market access for
In the area of trade negotiations, the same shift in policies exporters in the context of low prices may need to be
has not yet taken place. The DDA still focuses on protecting buttressed by discussions of how to address concerns of
producers. Measures to protect consumers have not received import dependent developing countries and those affected by
the attention that the shift to the new market environment export constraints should high and volatile prices persist. The
may warrant. If such a shift in the policy debate evolves implications of a shift in the dynamics of supply and demand
successfully, this could instil a new raison d’être into the in agricultural markets also extends to other policy arenas
negotiations process, help resume negotiations and help including research and development policy as well as resource
conclude the DDA. Preparing such discussions should be management policy and beyond. Under such conditions, a
supported by a shift in the research agenda for trade. A twin twin-track approach to further trade negotiations, one which
track approach could be pursued to (i) ensure that trade policy follows existing priorities and one which reflects the potential
measures help protect consumers from the negative impacts for a more supply constrained market, should be examined.
180 4.*0/(2D6
“old normal” “new normal”?
160 WTO negotiation process and progress
and the FAO Food Price Index
(real 2002-2004=100)
140
120
100
80
60
00
04
08
06
09
03
02
05
07
10
12
8
0
6
4
9
3
5
2
7
01
11
1
199
199
199
199
199
199
199
199
199
199
20
20
20
20
20
20
20
20
20
20
20
20
20
74Hertel, T., 2012. “Implications of Agricultural Productivity
/(4(/($"(- for Global Cropland Use and GHG Emissions: Borlaug vs.
Jevons”, GTAP Working Paper No. 69, Center for Global
Trade Analysis. Purdue University, West Lafayette, IN.
International Food Policy Research Institute. 2007. The
World Food Situation – New Driving
Abbott, P., C. Hurt, W. Tyner. 2008. What’s Driving Food Forces and Required Actions.
Prices? Farm Foundation Issue Report.
Jevons, William Stanley. 1865/1965. In: Flux, A.W. (Ed.), The
Abbott, P., C. Hurt, W. Tyner. 2009. What’s Driving Food CoalQuestion: An Inquiry Concerning the Progress of the
Prices? March 2009 Update. Farm Foundation Issue Report. Nation, and the Probable Exhaustion of Our Coal- mines,
3rd edition 1905. Augustus M. Kelley, New York.
Balcombe, K., and G. Rapsomanikis. 2008. Bayesian
Estimation and Selection of Nonlinear Vector Error Meyers, W., and S. Meyer. 2008. Causes and Implications of
Correction Models: The Case of the Sugar-Ethanol-Oil the Food Price Surge. FAPRI- MU Report 12-08.
Nexus in Brazil. American Journal of Agricultural Economics
90:658 – 668. OECD-FAO. 2010. OECD-FAO Agricultural Outlook
2010-2019. Paris, France. OECD-FAO. 2008. OECD-FAO
Alexandratos, N. and J. Bruinsma. 2012. World agriculture Agricultural Outlook 2008-2017. Paris, France.
towards 2030/2050: the 2012 revision. ESA Working paper
No. 12-03. Rome, FAO. Thompson, W., S. Meyer, and P. Westhoff. 2009. Renewable
Identification Numbers Are the Tracking Instrument and
Cochrane, W. W. (1958). Farm Prices: Myth and Reality. St. Bellwether of US Biofuel Mandates. Eurochoices, 8(3), 43-50.
Paul: University of Minnesota Press.
United Nations. 2011. World Population Prospects: The
De Gorter, H., and D.R. Just., Water in the U.S. Ethanol 2010 Revision.
Tax Credit and Mandate: Implications for Rectangular
Deadweight Costs and the Corn-Oil Price Relationship, Westhoff, P., W. Thompson, J. Kruse, and S. Meyer. 2007.
Applied Economic Perspectives and Policy. Volume 30, Ethanol Transforms Agricultural Markets in the USA.
Number 3, Fall: 397-410. Eurochoices, 6(1), 14-21.
Dewbre, J., C. Giner, W. Thompson, M. von Lampe. 2008. World Bank. 2008. Rising Food Prices: Policy Options and
High food commodity prices: Wwill they stay? Who will pay? World Bank Responses.
Agricultural Economics, 39, 393–403.
World Bank. 2010. World development report 2010:
Economic Research Service (ERS), U.S. Department of Development and climate change. Washington, DC.
Agriculture. 2008. Global Agricultural Supply and Demand:
Factors Contributing to the Recent Increase in Food
Commodity Prices. WRS-0801, Washington, D.C.
European Commission (EC) Directorate–General for
Agriculture and Rural Development, 2008. High prices on
agricultural commodity markets: situation and prospects:
a review of causes of high prices and outlook for world
agricultural markets. Directorate L. Economic analysis,
perspectives and evaluation, L.5 Agricultural trade policy
analysis, Brussels.
Fischer, G., van Velthuizen, H., Shah, M. & Nachtergaele, F.
2002. Global Agro-ecological Assessment for Agriculture
in the 21st Century: Methodology and results. RR-02-002,
IIASA, Laxenburg and FAO, Rome. (http://www.iiasa.ac.at/
Research/LUC/SAEZ/pdf/gaez2002.pdf).
Fischer, G., Hisznyik, E., Prieler, S. & Wiberg, D. 2010.
Scarcity and abundance of land resources: competing land
uses and the shrinking resource base. Thematic Report 2
prepared for SOLAW, FAO. 2011.
75,1(2$(&28.",0/(2%42,1(2!*/."0',0/!'2
,/!)(
)%2?(-,(/)!?E-2
).-".8'.$(-24.,22 Since the Doha Round was launched almost twelve years
ago, international trade in agricultural and food products has
,%)!?E-24!/+2,/!)(32 experienced important changes, likely to alter significantly
and durably the negotiations’ background. This section briefly
reviews the most relevant new trends.
Jean-Christophe Bureau and Sébastien Jean
The increasing importance of developing countries
in agricultural trade
.$,/%)0",.%$5 From 26% in 2000, the share of non-LDC developing
countries (defined based on economic criteria) in world
imports of agricultural products has reached 41%, and it is
In 2001, World Trade Organization (WTO) Members agreed close to 60% for cereals (Figure 1).2 This share increased
to embark in negotiations that would lead to substantial from 34% to 45% in world exports. Even for meat
reductions in agricultural domestic support, substantial and fish products, for which non-LDC developing countries
improvements in market access and the phasing out of accounted for only 16% of world imports in 2000, this share
all forms of export subsidies. They agreed that special and reached 34% in 2011.
differential treatment for developing countries would be an
integral part of all elements of the negotiation. Twelve years This trends means that developing countries’ markets
later, no agreement has yet been found. At the same time cannot be considered peripheral anymore. As for
considerable changes have taken place in the world trading manufactured products, they are now central: they represent
system. The emergence of some developing countries as a significant part of world trade, and an overwhelming share
economic superpowers and political heavyweight, while of its growth.
most developed countries experience a lasting economic
crisis and very low rates of economic growth, led to a new A new characteristic of world markets: higher prices
landscape. The conclusion of a considerable number of
Regional Trade Agreements (RTAs) shows that the thirst In the evolution of trade in agricultural and food products,
for trade liberalization remains widespread but that volumes and prices have not necessarily followed the same
regionalism is now either preferred to multilateralism patterns of changes. For decades, agricultural prices in real
or seen as a more effective way to gain access to growing terms went down, under the combined effects of a high rate
markets. Radical changes have also taken place in agricultural of technical change, considerable government intervention
and food markets, in particular under the pressure of that boosted supply, and periods of “trade wars”, when large
a growing demand and new utilizations of agricultural entities such as the EU and the US competed with export
products. subsidies. While it is still too early to conclude to a reversal
in historical trends, this period seems to have come to an end
In this note, we explore how trade and trade policies have in 2006. Since 2007, the trend in agricultural prices has been
evolved over the last decade and we consider the possible upward, especially for cereals and oilseeds.
implications for the Doha negotiations. We examine the
recent changes in agricultural trade patterns, the nature of A growing population, the change in diets in emerging
trade and the linkages with non-food markets. We review countries, the increasing use of agricultural commodities
the main changes in tariffs, including those under RTAs, in transport fuel, global warming and more frequent water
and in other forms of trade restrictive measures. We also shortages have led to expectations that this change in world
show that the recent changes in domestic support tend to market fundamentals is durable. However, there are large
show a reversal of the trend towards more decoupled forms
of support initiated during the Uruguay Round. We argue
that, in spite of the apparent attractiveness of bilateral
agreements, multilateralism remains the best way to avoid 7 This work benefited from support by ICTSD and is partly based
a fragmentation of world trade, whereby some countries are on research conducted under the FOODSECURE research project, 7th
left behind and all incur undue costs. Multilateralism is also Framework Research program, European Commission, DG RTD. Only
the authors are responsible for any omissions or deficiencies and for the
the shortest way toward balanced trade liberalization and content of the paper.
a rule-based system to deal with trade disputes. We then
point out several areas of importance for a successful Based on the WTO definition of developing countries, this share was
1
multilateral negotiation. almost 50% in 2010 (Table 2).
76You can also read