European IVD Market Statistics Report 2021 - MedTech Europe
←
→
Page content transcription
If your browser does not render page correctly, please read the page content below

European IVD Market Statistics Report 2021
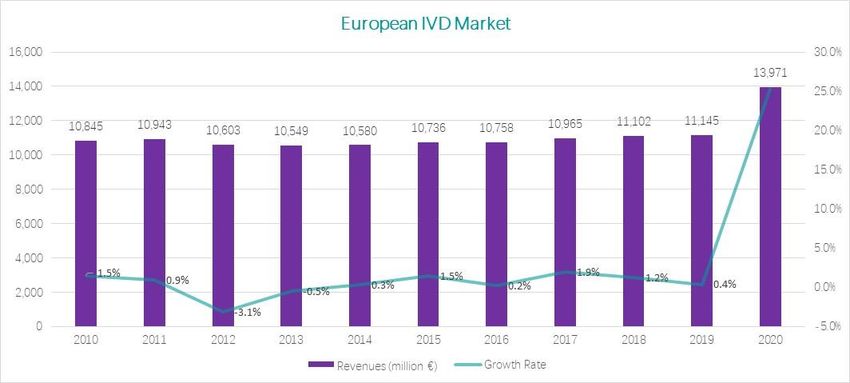
Overview
MedTech Europe is pleased to publish the market estimates of the In vitro diagnostic (IVD) industry in Europe. The
MedTech Europe figures include market size and dynamics information, based on 2020 and 2019 data.
Macroeconomic and healthcare data are also included for the EU27-member states plus the European Free Trade
Association members (EFTA) –Switzerland, Norway and Iceland, and Switzerland, as well as for the United Kingdom
and Turkey.
In vitro diagnostics (IVDs) are an essential part of today’s healthcare. They play a vital role in in the response to COVID-
19. A critical element for combatting the COVID-19 pandemic is to have suitable diagnostic tests available.
Furthermore, IVDs are used to diagnose, monitor, screen and assess predispositions to diseases, thereby contributing
to the available medical information regarding a patient. By allowing earlier and more targeted treatments, IVDs help
to reduce hospital stays and convalescences, resulting in healthier populations, reduced costs and economic growth
in the long run.

Since 2013, the IVD market has been stagnant with slight growth. In 2020, however, due to the COVID-19 pandemic
and the high demands for SARS-Cov-2 testing, the IVD market has experienced an unprecedented increase of + 25,4%.
Overall revenues across EU-27, UK and EFTA reached €13,971 million. When looking beyond the COVID-19 related
diagnostics, there has been significant decline in tests in the other IVD segments such as clinical chemistry,
immunology, microbiology, and haematology across the countries.

The differences in total healthcare expenditure, both in relative terms to GDP and absolute amounts, demonstrate
the wide variation in access to healthcare across the thirty-one countries in this report. Relative to GDP Switzerland is
the leading country at 13.2%, followed by France, Germany and Norway. In absolute amounts the healthcare
expenditure per capita Switzerland remains in first position, followed by Austria, Luxemburg, Iceland, Germany,
Belgium, Spain and France. The IVD per capita expenditure also shows a wide variation from a low of €5.1 in Bulgaria
to €61.1 in Switzerland, which remains also the leading country.

www.medtecheurope.org                                                                                         Page 2 of 12
IVD Market Statistics
Population 2020 GDP 2020 GDP / capita THE 2020 THE / capita THE as % IVD mkt. IVD mkt. IVD mkt. IVD mkt. / IVD mkt /
2020 GDP 2020 2019 growth THE 2020 capita 2020
Countries rate 20-19
1000 Mio € € Mio € € % Mio € Mio € % % €
S o urc e : E uro s t a t S o urc e : F it c h S o lut io ns ( pro v is io na l) S o urc e M e dT e c h E uro pe
Germany 83,167 3,367,560 40,492 428,640 5,154 12.7% 2,745 2,180 25.9% 0.6% 33.0
France 1 67,320 2,302,860 34,208 294,703 4,378 12.8% 2,140 1,623 31.9% 0.7% 31.8
Italy 59,641 1,653,577 27,725 163,426 2,740 9.9% 1,776 1,558 14.0% 1.1% 29.8
Spain 47,333 1,121,948 23,703 115,405 2,438 10.3% 1,514 1,007 50.3% 1.3% 32.0
Netherlands 17,408 800,095 45,962 81,340 4,673 10.2% 365 286 27.6% 0.4% 21.0
Greece 10,719 165,326 15,424 16,216 1,513 9.8% 254 213 19.2% 1.6% 23.7
Portugal 10,296 200,088 19,434 20,325 1,974 10.2% 303 220 37.5% 1.5% 29.4
Belgium 11,522 456,893 39,652 51,130 4,437 11.2% 372 347 7.5% 0.7% 32.3
Sweden 10,328 475,432 46,035 54,557 5,283 11.5% 251 186 35.3% 0.5% 24.3
Austria 8,901 379,321 42,615 46,368 5,209 12.2% 465 288 61.5% 1.0% 52.2
Denmark 5,823 312,517 53,672 33,967 5,833 10.9% 176 161 9.5% 0.5% 30.2
Finland 5,525 236,032 42,718 23,805 4,308 10.1% 130 120 8.2% 0.5% 23.5
Ireland 4,964 372,869 75,108 25,296 5,095 6.8% 149 126 18.3% 0.6% 30.1
Luxembourg 626 64,221 102,572 N/A N/A N/A 21 19 10.5% N/A 33.5
Poland 37,958 523,668 13,796 37,072 977 7.1% 454 377 20.6% 1.2% 12.0
Romania 19,329 218,863 11,323 10,244 530 4.7% 218 198 10.3% 2.1% 11.3
Czech Rep 10,694 215,257 20,129 16,784 1,569 7.8% 215 162 32.9% 1.3% 20.1
Hungary 9,770 136,622 13,985 9,416 964 6.9% 84 79 6.7% 0.9% 8.6
Bulgaria 6,951 61,331 8,823 4,805 691 7.8% 35 32 9.7% 0.7% 5.1
Slovakia 5,458 92,079 16,871 7,003 1,283 7.6% 97 78 25.2% 1.4% 17.8
Croatia 4,058 50,190 12,368 3,831 944 7.6% 67 65 3.5% 1.7% 16.4
Lithuania 2,794 49,507 17,719 3,312 1,185 6.7% 33 29 13.1% 1.0% 11.7
Latvia 1,908 29,511 15,470 2,372 1,243 8.0% 27 24 14.8% 1.2% 14.4
Slovenia 2,096 46,918 22,386 3,961 1,890 8.4% 62 54 16.0% 1.6% 29.8
Estonia 1,329 26,835 20,193 2,137 1,608 8.0% 26 21 21.7% 1.2% 19.7
Cyprus 888 21,548 24,266 N/A N/A N/A 10 10 10.0% N/A 11.8
Malta 515 13,083 25,426 N/A N/A N/A 6 5 10.0% N/A 10.7
EU27 447,320 13,394,150 29,943 N/A N/A N/A 11,995 9,464 26.7% N/A 26.8
Switzerland 8,606 659,731 76,659 87,142 10,126 13.2% 526 462 13.8% 0.6% 61.1
Norway 5,368 318,051 59,254 38,762 7,222 12.2% 166 145 14.1% 0.4% 30.8
Iceland 364 19,025 52,248 N/A N/A N/A 12 11 10.0% N/A 33.2
EFTA 14,338 996,807 69,523 N/A N/A N/A 704 618 13.8% N/A 49.1
UK 2 67,026 2,425,151 36,182 267,745 3,995 11.0% 1,272 1,063 19.7% 0.5% 19.0
TOTAL (EU27, EFTA,UK)
528,683 16,816,108 31,808 N/A N/A N/A 13,971 11,145 25.4% N/A 26.4
Turkey 83,155 626,576 7,535 30,537 367 4.9% 621 471 32% 2.0% 7.5
TOTAL (EU27, EFTA, UK,Turkey)
611,838 17,442,684 28,509 N/A N/A N/A 14,592 11,617 25.6% N/A 23.8
1 France data includes only the Central Laboratory IVD Market.
2 UK data reflects the consolidated sales of the participating companies in GDMS, plus the figures published by NHS England for glucose test strip sales adjusted to
represent the whole of the UK.
3 N/A -data not available in time of publishing.
The applied exchange rates are the 2020 annual average exchange rates published by The European Central Bank. Applying a single
exchange rate to both 2020 and 2019 sales data eliminates possible fluctuations of market size and market growth due to exchange
variations. The impact of these fluctuations is shown in the table below.
During the collection of 2020 year’s figures, the 2019 market size was re-estimated at the same time. That, together with the use
of a single exchange rate, explains why some countries show different revenues compared to the figures presented in last year’s
report for 2019. The growth rate between 2020 and 2019 has been calculated using the re-estimated figures. The 2020 data
regarding population and GDP are the latest available from Eurostat. The figures regarding healthcare expenditure are the
provisional 2020 data from Fitch Solutions.
IVD Market Size in EUR (using actual exchange rates)
Country Currency 2020 Exchange Rate 2019 Exchange IVD mkt. 2020 IVD mkt. 2019 IVD mkt. 2020 IVD mkt. 2019 IVD mkt. growth
Rate rate 20-19
Average Average Mio LC Mio LC Mio € Mio € %
Poland PLN 0.2252 0.2327 2,015 1,678 454 390 16.2%
Romania RON 0.2067 0.2107 1,054 956 218 201 8.2%
Czech Rep CZK 0.03783 0.03896 5,690 4,282 215 167 29.0%
Hungary HUF 0.002849 0.003075 29,106 26,739 83 82 0.9%
EU27 EUR N/A N/A 11,994 9,490 26.4%
UK GBP 1.1248 1.1399 1131 945 1,272 1,077 18.1%
TOTAL (EU27, EFTA,UK) EUR N/A N/A 13,970 11,186 24.9%
Turkey TRL 0.12623 0.15747 4,918 3,735 621 588 5.6%
TOTAL (EU27, EFTA, UK,Turkey) EUR N/A N/A 14,591 11,774 23.9%
www.medtecheurope.org Page 3 of 12Country Specific Data www.medtecheurope.org Page 4 of 12
www.medtecheurope.org Page 5 of 12
SARS-Cov-2 Tests: Volumes 2020
            Country       Total Tests       Tests per
                                         1000 population

                        Source: ECDC; *Our World in Data
United Kingdom*             52,560,000              784
Germany                     35,577,974              428
France                      30,536,530              454
Italy                       26,826,979              450
Turkey*                     24,500,000              295
Spain                       21,486,152              454
Denmark                     10,576,739            1,816
Netherlands                  8,149,414              468
Poland                       7,886,328              208
Belgium                      7,010,457              608
Portugal                     6,058,651              588
Czechia                      4,724,337              442
Sweden                       4,641,125              449
Romania                      4,567,152              236
Austria                      3,747,074              421
Greece                       3,432,711              320
Switzerland*                 3,330,000              387
Norway                       3,051,183              568
Luxembourg                   2,751,987            4,395
Finland                      2,510,908              454
Ireland                      2,472,200              498
Hungary                      2,412,823              247
Lithuania                    1,577,134              564
Slovakia                     1,436,746              263
Bulgaria                     1,093,797              157
Croatia                      1,084,453              267
Cyprus                         939,253            1,058
Latvia                         887,884              465
Slovenia                       732,806              350
Estonia                        550,119              414
Malta                          527,375            1,025
Iceland                        429,819            1,180

www.medtecheurope.org                                      Page 6 of 12
Germany +25.9% IVD MARKET 2,745 mEUR “The German diagnostics market in 2020 recorded sales of EUR 2,745 million. This corresponds to growth of 25.9% compared to the previous year. The laboratory market (reagents and instruments) is growing by 20.8%. The rapid test market is growing by 37.9%. The exceptional market development in the past year is due to the COVID-19 pandemic and the central importance of testing. The test manufacturers delivered what politicians and the market in Germany demanded. The infectious disease diagnostics market segment quadrupled in volume. Initially, growth was determined by nucleic acid-based corona diagnostics. In the fourth quarter, sales of SARS-CoV-2 rapid antigen tests exploded. This development explains the high growth of the overall rapid test market, which is normally dominated by declining sales in blood glucose self- monitoring. Another driver of the dynamic development of infectious disease diagnostics is molecular HPV testing, which has been part of the early detection of cervical carcinoma since January 2020. Infectious disease diagnostics accounted for around 32 percent of the total IVD market in Germany in 2020. In the previous year, the share was 10.3 percent. In contrast, there was a downward trend in all other segments. The sales declines are between two and sixteen percent. Restrictions in public life and a noticeable decline in the use of non-infectious health services are factors to be mentioned.” - VDGH, German IVD industry association France +31.9% IVD MARKET 2,140 mEUR “The Central Laboratory IVD French market (excluding diabetes) is estimated at 2,140 million Euro, with a growth of +31.9% compared to 2019. This huge increase is driven by SARS-CoV-2 IVD products. SIDIV has conducted a survey among its members showing that if SARS-CoV-2 IVD tests are excluded from the market figures, the trend is a diminution of -2,7%.” - SIDIV, French IVD industry association Italy +14.0% IVD MARKET 1,776 mEUR “The growth witnessed in the Italian market can be solely attributed to COVID-19 related diagnostics. Looking at the market data, excluding the COVID-19 diagnostics, Italy recorded an extremely negative figure of - 4.5%. The negative trend recorded in previous years has been greatly worsened because of citizens' difficulties in accessing outpatient services and the reduced activity of healthcare facilities as their focus was mainly on the management of the pandemic. The above mentioned can be illustrated by the following market dynamics in the other IVD segments: Clinical Chemistry (-11.30%); Urine testing (-28.5%); Glucose test strip (-11.20%); Tumor Marker (-12.10%); Auto-immune diseases (-11.60%). What has been described regarding the year 2020, albeit to a lesser extent, is also observed in the first months of 2021. The lower number of specialists visits carried out in recent months is a sign of worsening the state of health of patients suffering from chronic diseases who have not undergone control tests since the begging of the pandemic. “- Confindustria Dispositivi Medici, Italian IVD industry association www.medtecheurope.org Page 7 of 12
Spain +50.3% IVD MARKET 1,514 mEUR
“Due to pandemic situation the routine activity has declined a lot and in consequence the routine test declined steadily
related with low follow up of chronic illnesses and surgical procedures. In the other side all COVID-19 related tests,
considering not only the direct SARS-CoV-2 tests, but also other related with its evaluation, diagnosis and evolution
had a huge increase. Companies manufacturing COVID-19 tests in Spain had been very successful selling their tests
around the world. Molecular test performance has gotten a tremendous support and is expected to remain strong in
the future. Self-test (diabetes) remains declining as previous years but POC mainly due to Covid Rapid tests grew
strongly.
Laboratories have focused their activities to responded to the very high demand of covid related test changing
structures and hiring personnel for the new areas and we have seen few progress in other fields of the laboratory
medicine. There is a concern about future market evolution once the COVID-19 tests arrive to a peak and begin to
decline. Future is uncertain and we expect to recover 100% of routine test, while and there is no certainty about
COVID-19 related tests evolution.
IVD test are riding on the crest of the wave and citizens rely on this technology more than ever. We have to keep the
momentum and seize the opportunity to reinforce the value of diagnostic information.”- FENIN, Spanish IVD industry
association

United Kingdom +19.7% IVD MARKET 1,272 mEUR
“The headline UK IVD market size for 2020 is £1,131m with growth of almost 20% (£186m) over 2019. This exceptional
annual growth is due to heavy investment in testing for Coronavirus plus additional testing required for COVID-19
positive patients in serious condition in hospitals. It is offset only partly by the cessation of elective treatments during
the first national lockdown which started on the 23rd of March, and the slow recovery of normal clinical services
subsequently. Although most of the molecular tests for Coronavirus have been captured in the survey as they are
supplied by participating companies, there is a huge expenditure on Rapid Tests (Lateral Flow Tests, or LFTs) purchased
directly through national government arrangements from non-participant companies which is not all captured in these
figures. One of the largest is reported to have won a contract for at least £2.8billion for supply of LFTs for home testing,
which is not captured in the audit.
The response to the pandemic was late but dramatic and included the establishment of dedicated 'Lighthouse
laboratories' equipped purely for high volume PCR testing for COVID-19. Testing for other conditions and purposes
dropped drastically. The impact on non-Covid revenues ranged from reductions of around 30% for drugs of abuse,
allergy, and anemia, while Chlamydia testing was down over 80%. In contrast, some specific assays such as D-Dimer
and Procalcitonin were greatly increased.” - BIVDA, British IVD industry association

Belgium +7.5% IVD MARKET 372 mEUR
“In 2020, because of COVID-19, there were less hospitalizations and consultations (i.e., in the first wave, 59% less
hospitalizations and 43% less consultations) which resulted in less non-Coronavirus related IVD tests.” – beMedTech,
Belgian IVD industry association.

www.medtecheurope.org                                                                                         Page 8 of 12
Portugal +37.5% IVD MARKET 303 M EUR
“In 2020, the Portuguese IVD market excluding COVID-19 tests decreased by 10.0% as consequence of the lockdown
which led to a reduction in routine medical appointments.
Overall, the total IVD market increased 37.5% driven by COVID-19 tests, namely PCR and PoC-Rapid tests.
COVID-19 testing, despite being financially supported by NHS, has been performed in both segments – private and
public setting. In this area, we also faced a changing competitive scenario, with entry of new competitors and a
reinforcement of some existing ones.” - APIFARMA, Portuguese IVD industry association

Austria +61.5% IVD MARKET 465 mEUR
“The market development in Austria in 2020 with the extremely steep increase vs. 2019 is only due to the pandemic
and the relevant testing (PCR, Antigen- and Antibody testing). The other segments clearly declined between -2% to -
15% (depending on segment) due to fewer patient samples referred to the laboratories, fewer patients in out-patient
hospital wards due to the lockdown restrictions and the clear focus of laboratories on COVID-testing. As a quite high
number of new market players, who do not report their sales figures, entered with SARS-CoV-Testing methods the
estimation of their sales might have a broad bandwidth.“ – AUSTROMED, Austrian IVD industry association

Poland +20.6% IVD MARKET 454 mEUR
“In 2020, the market dynamic of +20.6% in Poland has been driven by COVID-19 tests, offsetting the decline in other
segments. According to official sources, more than seven million SARS-Cov-2 tests have been performed in Poland.
In comparison to 2019, we have observed decrease in the market of several groups of reagents (enzymes -5%,
substrate -39%, electrolytes -8%), which is pointing out to decline or postponement in the medical services for
patients. Further comparison of the market dynamics:

Specific Proteins (-9%)
Allergy (-22%)
Tumour Markers (-11%)
Thyroid Function Hormones (-16%)
Fertility / Pregnancy Hormones / Proteins (-9%)
Individual and Specified Hormones / Proteins +13%
Anemia Related / Vitamin Tests (-7%)
Therapeutic Drug Monitoring (-3%)
Drugs of Abuse / Toxicology +4%
Auto-Immune Diseases (-14%)
Rheumatoid - Inflammatory Diseases Markers (-18%)
Cardiac Markers 7%
Immunohematology (Blood Grouping) 11%

The decline in some of the routine testing for patients that has been observed is worrying in regard to the health of
the patients.” – MedTech Polska, Polish IVD industry association.

www.medtecheurope.org                                                                                   Page 9 of 12
Greece +19.2% IVD MARKET 254 mEUR
“After three consecutive years of GDP growth (2017 +1.3%, 2018 +1.6%, 2019 +1.9%), a recession by 8.2% took place
in 2020, due to the COVID-19 pandemic. In 2020, the total IVD Market grew by 19.2% compared to 2019, mainly driven
by revenues of 50 million euro related to Coronavirus Testing. The Greek IVD Market, excluding Coronavirus Testing,
declined by -4.2%. The pandemic brought about a single digit decrease in all traditional IVD categories (Clinical
Chemistry, Haematology, Immunology excluding Coronavirus Testing, etc.). “– SEIV, Greek IVD industry association.

Slovenia +16.0% IVD MARKET 62 mEUR
“In 2020, the estimated IVD market in Slovenia grew with 16%, due to the COVID-19 situation. The COVID-19 impact
was calculated considering the number of SARS Cov2 tests performed in Slovenia in 2020 and the public tenders open
for PCR instruments and RAT.
The COVID-19 strong measures had significantly slowed down the operationality of the Health Care System. Therefore,
the core lab tests dropped by almost -20%, representing approximately 70% of the total market in 2020 only.
With the arrival of RAT (end of Q3 2020), the POC was growing by 70%. Most of the RAT tests were supplied by
providers from Asia. The RAT had been seen as an exciting business opportunity. Therefore, many new IVD distributors
(most not even in IVD before) have appeared on the market (e.g., in the RAT National tender in December 2020, more
than 40 distributors were competing).
Diabetes care has not been considerable influenced by the COVID-19 measures and reported modest growth of
+2,4%.” – MedTech Slovenija, Slovenian IVD industry association.

Czech Republic +32.9% IVD MARKET 215 mEUR
“The significant market growth observed in 2020 in the Czech Republic has been driven by infectious disease testing
+57.8%, due to the COVID-19 pandemic, as well as related increased revenues in genetic testing +34.7%, services
+28,9% and instruments +3.4%.
Opposite market dynamic occurred in microbiology (-12.2), clinical chemistry (-10.2%), and hematology (-4.7%)
segments.” – CZEDMA, Czech IVD industry association.

Slovakia +25.2% IVD MARKET 97 mEUR
“The country market dynamics +25.2% growth observed in 2020 have been driven by the Coronavirus pandemic and
the SARS-Cov-2 related tests.” – SEDMA, Slovakian IVD industry association.

www.medtecheurope.org                                                                                 Page 10 of 12
Switzerland +13.8% IVD MARKET 526 mEUR
“Excluding Coronavirus related testing, a negative growth (-3.7%) has been observed on the Swiss IVD market in 2020.
The pandemic has negatively impacted the clinical chemistry segment with an annual growth of (-8.6%), as well as
immunochemistry (-2.3%), and haematology / immunohematology (-1.6%) when compared to 2019.” -SVDI, Swiss IVD
industry Association.

Turkey +31.7% IVD MARKET 621 mEUR
“COVID-19 has led to an upsurge in some tests while causing a downward trend in others as COVID-19 related tests
increased while testing for other diseases went down. Depreciation of Turkish Lira (+45%) and high inflation (+20%)
increased the cost pressure on the import-driven industry. Suppliers and distributors could only partially implement
price increases since tender durations are 1-3 years and prices cannot be increased during ongoing contracts.

Payment performance of all state and university hospitals kept worsening in 2020. In the second half of the year, the
Ministry of Finance offered companies to write-off 25% of their receivables from all state and university hospitals (all
invoices between January 1st, 2017 - September 1st, 2020) and receive the rest of the accumulated receivables within
3 months. The offer took the industry by surprise since such a request was made only for university hospitals before
(twice, last time in 2018), which had chronic payment problems in the last 10 years and whose portion comprised only
30% of all accumulated company receivables. The previous rates had also been lower than 25% even though TL had
depreciated 65% in the last three years. Companies’ response to the request had been mixed, but this move not only
resulted in financial loss for the industry but also an erosion of trust for the country.

Opening of city hospitals financed by PPP model have continued. 13 hospitals have become active as of 2020 end,
while the remaining 5 will be activated until the end of 2022. Meanwhile, 4 ISLAB tenders had been concluded for 4
regions covering all Istanbul and the winners had resumed their 3-year operations.” – ARTED, Turkish IVD industry
association.

www.medtecheurope.org                                                                                    Page 11 of 12
DATA GATHERING
The results presented above are based on individual 2020 estimates made for 27 countries, comprising of the EU
countries, EFTA countries, the UK and Turkey:

        • 13 countries are participating in the Global Diagnostic Market Statistics (GDMS, former EDMS) programme:
        Austria, Belgium, Czech Republic, France, Germany, Italy, the Netherlands, Poland, Portugal, Slovakia, Spain,
        Switzerland, and the UK.
        • The National Association Members of MedTech Europe and the MedTech Europe’s Market Research
        Committee have estimated the IVD market in 18 other countries not participating in the GDMS programme:
        Bulgaria, Croatia, Cyprus, Denmark, Estonia, Finland, Greece, Hungary, Iceland, Ireland, Latvia, Lithuania,
        Malta, Norway, Romania, Slovenia, Sweden, and Turkey.

The figures per country are compiled from the Global Diagnostic Market Statistics (GDMS) programme, through which
companies report invoiced sales of reagents, instruments and consumables to an independent auditor, CIP, as based
on the Global IVD Classification (GIVD). This is done in association with the MedTech Europe’s Market Research
Committee and the National Association Members. Although most of the molecular tests for Coronavirus have been
captured in the programmes as they are supplied by participating companies, there are revenues on Rapid Tests
purchased directly through national government arrangements from non-participant companies which might not be
all captured in this report.
More than 85% of the market is covered in major countries by GDMS, ensuring the reliability and objectiveness of the
information provided by MedTech Europe and its members. MedTech Europe encourages all IVD suppliers and
countries to participate in the GDMS programme, which is the largest In vitro diagnostic audit in Europe and the most
accurate source of information for understanding and predicting market trends.

About In Vitro Diagnostics
In vitro diagnostics are non-invasive tests performed on biological samples (for example blood, urine or tissues) to
diagnose or exclude a disease. IVDs provide valuable information about how the body is functioning and its state of
health. They are used for diagnosis, prognosis, risk stratification, screening and therapeutic monitoring of diseases.
IVDs have a broad scope ranging from sophisticated technologies performed in clinical laboratories to simple self-
tests, such as those for pregnancy and glucose monitoring.

About MedTech Europe
MedTech Europe is the European trade association for the medical technology industry including diagnostics, medical
devices and digital health. Our members are national, European and multinational companies as well as a network of
national medical technology associations who research, develop, manufacture, distribute and supply health-related
technologies, services and solutions. MedTech Europe’s mission is to make innovative medical technology available
to more people, while helping healthcare systems move towards a sustainable path. MedTech Europe encourages
policies that help the medical technology industry meet Europe’s growing healthcare needs and expectations. It also
promotes medical technology’s value for Europe focusing on innovation and stakeholder relations, using economic
research and data, communications, industry events and training sessions.
The European in vitro diagnostic industry is driven by research and development. Almost 95% of the industry is
comprised of small and medium size enterprises and approximately 1 billion euros per year is reinvested in R&D.
Developed by MedTech Europe, the Global Diagnostic Market Statistics (GDMS) and Management Information System
(MIS) programmes provide a comprehensive overview of the latest market trends based on the Global IVD Product
Classification (GIVD).

For more information

Teodora Angelova
Senior Manager Market Data
Email: t.angelova@medtecheurope.org
Phone: +32 2 777 02 74

www.medtecheurope.org                                                                                   Page 12 of 12
You can also read