Evaluation of the Liverpool Say No To Drunks Pilot Intervention
←
→
Page content transcription
If your browser does not render page correctly, please read the page content below
Evaluation of the Liverpool Say No
To Drunks Pilot Intervention
Zara Quigg, Karen Hughes, Kat Ford, Anna Hunt, Katie Hardcastle, Ciara McGee

April 2015

CPH, Faculty of Education, Health and Community, Liverpool John Moores University, Henry Cotton Campus, 15-21 Webster Street, Liverpool, L3 2ET
0151 231 4542 | z.a.quigg@ljmu.ac.uk | www.cph.org.uk | ISBN: 978-1-908929-98-3 (web)

Contents

Acknowledgements.................................................................................................................... 1
Summary .................................................................................................................................... 2
1. Introduction ........................................................................................................................... 6
2. Methods ................................................................................................................................. 8
   2.1 Nightlife patron surveys: pre- and post-intervention...................................................... 8
   2.2 Nightlife area observations .............................................................................................. 9
   2.3 Door supervisor and bar staff surveys ............................................................................. 9
   2.4 Exploration of breath test data ...................................................................................... 10
   2.5 Analysis of routine data sources .................................................................................... 11
   2.6 Analyses of the Say No To Drunks bar staff training evaluation forms ......................... 11
   2.7 Data analyses ................................................................................................................. 11
   2.8 Ethics .............................................................................................................................. 12
   2.9 Study limitations ............................................................................................................ 12
3. Findings ................................................................................................................................ 13
   3.1 Nightlife patron survey: pre-intervention ..................................................................... 13
   3.2 Nightlife patron survey: comparison of pre- and post-intervention surveys ................ 19
   3.3 Nightlife patron survey: intervention awareness .......................................................... 22
   3.4 Nightlife area observations ............................................................................................ 23
   3.5 Bar staff surveys ............................................................................................................. 27
   3.6 Door supervisor survey interviews ................................................................................ 29
   3.7 Breath test data ............................................................................................................. 33
   3.8 Analyses of routine data sources ................................................................................... 34
   3.9 Say No To Drunks bar staff training evaluation forms ................................................... 35
4. Discussion and recommendations ....................................................................................... 37
   4.1 Key recommendations ................................................................................................... 41
5. References ........................................................................................................................... 43
6. Appendices ........................................................................................................................... 46
   Appendix 1: The Say No To Drunks pilot intervention ........................................................ 46
   Appendix 2: Nightlife area observations - additional data tables and figures .................... 52

                                                                                                                                              i
Acknowledgements
The study was funded by Liverpool City Council. We would like to thank all venues who took
part in the Say No To Drunks pilot intervention and supported the evaluation process, and
their bar staff and door supervisors for their participation in study surveys. Our thanks also
go to Joe Richards, Adam Caris, Emma Begley, Nicola Millington and Lisa Schölin for their
assistance in conducting field research, and Laura Heeks for producing the report front
cover. Finally, we would like to thank members of the Say No To Drunks pilot intervention
steering group for their support in implementing the evaluation and producing the research
report.

                                                                                            1
Summary
The sale of alcohol to drunk people is illegal in the UK. Despite this, drunkenness is a
common feature of nightlife settings while public awareness of the law and bar server
compliance with it appears to be low (Hughes and Anderson, 2008). A study conducted in
Liverpool found that 84% of alcohol purchase attempts by pseudo-intoxicated actors in pubs,
bars and nightclubs were successful (Hughes et al., 2014). Thus to address the sale of
alcohol to drunks in the city’s nightlife, Liverpool City Council and Merseyside Police
developed and implemented the Say No To Drunks pilot intervention. The intervention
aimed to: increase awareness of legislation preventing sales of alcohol to drunks; support
bar staff compliance with the law; provide a strong deterrence to selling alcohol to drunks;
and promote responsible drinking amongst nightlife users. It included: a social marketing
and public awareness raising campaign; bar staff training; police enforcement; and the
provision of breathalysers to door supervisors to support entry refusal. An evaluation was
undertaken to inform the development of the pilot intervention and provide a baseline for
evaluating future work. A range of methods were used including surveys with nightlife
patrons, door supervisors and bar staff, nightlife area observations, and analyses of
secondary data sources (e.g. police-recorded crime data).
Key findings
Pre-intervention nightlife survey
The majority (95.8%) of nightlife patrons surveyed had consumed alcohol prior to taking
part in the survey (referred to as drinkers).
Two thirds (65.4%) of drinkers reported preloading and 20.0% en route loading.
Preloading was significantly higher in younger people and students.
In total, median expected alcohol use amongst drinkers over the course of the night out
(including alcohol already consumed and expected to be consumed post survey) was
15.7 units. Median alcohol use was significantly higher among males, non-Liverpool
residents and preloaders.
Over one in eight (13.1%) of all participants intended to drink more alcohol after leaving
the city’s nightlife (e.g. at home).
The majority (over 70%) of participants: expected their level of drunkenness to be high
when they left the city’s nightlife that night; reported a high drunkenness rating as their
ideal level of drunkenness; thought that the typical level of drunkenness that people
reach on a night out in the city centre was high; and believed that getting drunk was
socially accepted in Liverpool’s nightlife.
Over six in ten participants agreed that: bar staff in the city centre do not care if people
get drunk on their premises; if someone was drunk and tried to get served alcohol on a
night out in Liverpool they would usually be served; and in the city centre it is easy for
people who are drunk to buy more alcohol.
2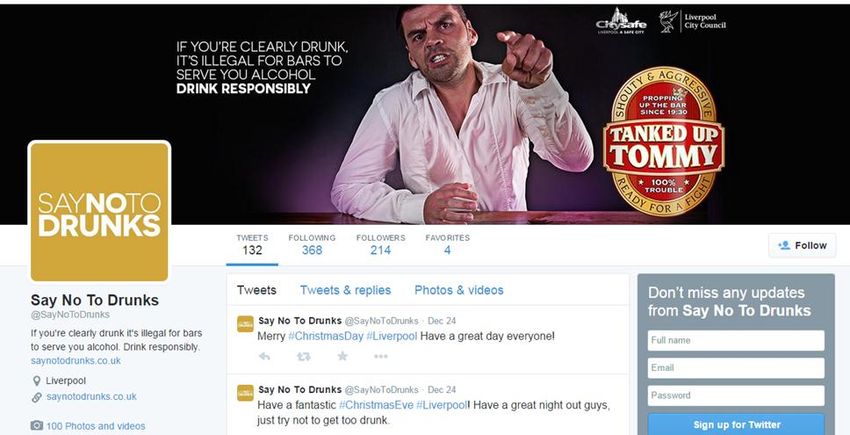
Knowledge of the law was low: just under half (46.9%) of all participants thought that it
was legal for a bar server to sell alcohol to someone who was already drunk and 53.5%
thought that it was legal for a person to buy alcohol for a friend who was already drunk.
Post-intervention nightlife survey
Only 17.2% of post-intervention nightlife survey participants reported being aware of
the Say No to Drunks pilot intervention. However, a number of positive differences
were observed between pre- and post-intervention survey findings1:
The proportion of participants who correctly reported that it is illegal for a bar
server to sell alcohol to someone who is drunk increased significantly (from 45.1%
to 60.2%);
The proportion of participants that reported preloading on the night of the
survey reduced significantly (from 65.4% to 53.9%); and,
The median number of alcohol units consumed whilst preloading reduced from
6.0 units to 5.1 units (although not significantly).
After being shown the intervention posters, half (52.9%) of survey participants agreed
that they demonstrated that people who are drunk in bars will not get served more
alcohol. However, a third or less agreed that the posters: would make them feel safer
on a night out in Liverpool; would make them more likely to come on a night out in
Liverpool; and would make them drink less alcohol before or during a night out in
Liverpool.
Post-intervention bar and door supervisor surveys
Bars staff perceptions of the intervention were positive:
o Over half (56.5%) reported feeling more comfortable refusing alcohol service to a
drunk person since the launch of the intervention;
o Over seven in ten (71.7%) stated they were less likely to serve alcohol to a person
who is drunk since the launch of the intervention;
o Six in ten (60.9%) felt the intervention helped them refuse alcohol service to a
drunk person;
o The majority (93.6%) agreed the intervention was effective in demonstrating that
alcohol will not be served to a drunk person; and,
o Nearly half (47.8%) believed that drunkenness had decreased in their bar since
the launch of the intervention.
One third (34.0%) of bar staff surveyed had participated in the Say No To Drunks
training programme. Compared with those that had not participated, a higher
proportion of trained bar servers stated that: they would never serve a drunk customer;
they felt very confident in refusing service of alcohol to a person who is drunk; and they
knew it was illegal to serve a drunk customer.
Door supervisor knowledge of the intervention focused on the breathalysers:
1
The pre- and post-intervention surveys were cross-sectional and thus involved different populations.
3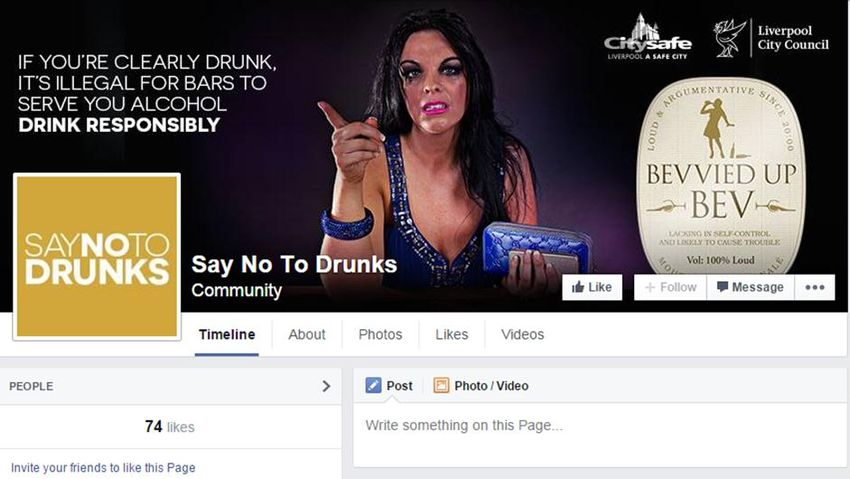
o The majority of those who had used a breathalyser as part of the intervention
reported that they were easy to use.
o Views on the use of the breathalysers as a tool to prevent the service of alcohol to
drunks were mixed.
o Less than half of door supervisors reported that they would like to continue using
the breathalysers post–intervention as a method to support venue entry refusal.
Conclusion
Overall, findings from this study support the need for measures to increase public
awareness of legislation on the sale and provision of alcohol to drunks and to address
excessive alcohol use and social tolerance of drunkenness in Liverpool’s nightlife. The
evaluation suggests some positive impacts from the Say No To Drunks pilot intervention,
including an increase in public knowledge of legislation on sales of alcohol to drunks and
improved bar server confidence in refusing such sales. Although wider impacts were not
observed, it is important that this pilot intervention is recognised as the first step in a
developing body of work to prevent sales of alcohol to drunks and create safer and healthier
nightlife environments in Liverpool. The data collected through this evaluation provides an
important baseline for monitoring changes resulting through future work.
Key recommendations
A culture of drunkenness and alcohol over-service is evident in Liverpool’s night-time
economy. The Say No To Drunks pilot intervention represents an important first step in
addressing this culture and its development and refinement should form a key part of
on-going work to address drunkenness and associated harms in the city.
Although the evaluation identified few changes in attitudes and behaviours towards
drunkenness, such outcomes are hard to identify and typically take time to emerge. Bar
servers appeared to respond positively to the intervention yet methodologies did not
permit robust investigation of changes in bar server practice. Re-testing bar server
propensity to sell alcohol to drunks using actors would provide a more robust indication
of the impact of the intervention and has been used to measure effectiveness
elsewhere.
The Say No To Drunks pilot intervention appears to have had some positive impact on
increasing knowledge of legislation on the sale and provision of alcohol to drunks. Work
to further develop public knowledge of this legislation should be prioritised.
Despite enforcement activity being a key component of the evidence-based
interventions on which Say No To Drunks was developed, this aspect of the programme
was limited. Enforcement activity should be a strong feature of future work to ensure
that there is a realistic expectation of prosecution for illegal alcohol sales among venue
staff and managers.
Training in identifying drunkenness and refusing service of alcohol to drunks should be
maintained as a key feature of bar staff training.
4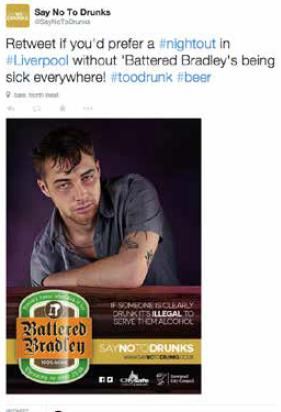
Consideration should be given to intervention materials to ensure they are visible to
users of the NTE and the wider public, and that the messages they provide are clear,
concise and relevant.
The use of the breathalysers as part of the intervention should be reconsidered.
Future media engagement should focus on the core messages from the intervention
and the broader work implemented by partners to address drunkenness in the NTE.
Work to prevent drunkenness and sales of alcohol to drunks should be undertaken as
part of a broader strategic approach that recognises the wider influences on alcohol use.
This should include consideration of policy options around permitted alcohol service
hours and minimum unit pricing that are likely to influence both overall alcohol
consumption and in particular harmful drinking behaviours such as preloading.
Other recommendations
Whilst interventions to tackle the service of alcohol to drunks should focus on all
venues in the city centre, further work should ensure that late night venues in particular
have appropriate systems in place to prevent alcohol sales to drunks and effectively
deal with the management of predominantly drunk customers.
The role of venue promoters in encouraging or preventing drunkenness and related
harms should be further investigated by local partners to ensure they do not promote
drunkenness within the NTE and if possible, work towards supporting the prevention of
drunkenness.
Future interventions aimed at preventing drunkenness in the NTE should target
preloading, particularly amongst younger age groups and students, as well as en route
loading.
5
1. Introduction

Drunkenness is a common feature of nightlife settings in the UK and is associated with a
wide range of health and social harms (Bellis et al., 2010; Hughes et al., 2008; McClatchley
et al., 2014). These harms place large burdens on health, police and other public services
(Anderson et al., 2007; Drummond et al., 2005). Consequently, an extensive range of
policies and interventions have been implemented at local and national levels to reduce the
harms associated with drunkenness in nightlife settings including high profile policing,
changes to licensing laws and environmental measures to improve safety (e.g. late night
transport security, street lighting and closed circuit television camera networks [Bellis and
Hughes, 2011]). Whilst there is some evidence to indicate that such measures can contain
and manage alcohol-related harms, they do little to reduce levels of drunkenness or address
the seemingly acceptable culture of being drunk in UK nightlife (Bellis and Hughes, 2011).

Whilst drunkenness is often the norm in town and city centres at night, the sale of alcohol to
people who are drunk is illegal under UK law and is regulated under Section 141 of the
Licensing Act 2003. However, there are few convictions for serving drunks (HM Government,
2012) and both public awareness of the law and bar server compliance with it appears low
(Hughes and Anderson, 2008). In May 2013, the Centre for Public Health, at Liverpool John
Moores University undertook a study examining the propensity of bar servers in Liverpool to
serve alcohol to drunks, with actors attempting to purchase alcohol while portraying a state
of extreme inebriation. In 84% of purchase attempts (n=61 out of 73 randomly selected
pubs, bars and nightclubs) the actors were sold alcohol, despite bar servers often clearly
recognising them as being intoxicated (Hughes et al., 2014).

Similar studies in other countries have been used to inform the development of strategies to
prevent drunkenness and associated harms in nightlife settings. In Stockholm, Sweden, a
study found that 95% of alcohol purchase attempts by pseudo-drunk actors were successful
(Andreasson et al., 2000). A multi-agency intervention (i.e. the STAD programme) was
implemented that included awareness-raising activity, server training and increased
enforcement of licensing legislation, and this was associated with reductions in both over-
service of alcohol and alcohol-related violence (Wallin et al., 2005). Many of the features of
the Stockholm intervention are already in use in the UK, including multi-agency partnership
working and targeted licensing enforcement, yet the focus on drunkenness and bar server
compliance with laws on sales of alcohol to drunks has to date been missing. However,
prevention activity addressing underage alcohol sales has been successfully implemented
including test purchasing, targeted enforcement and the introduction of schemes such as
Challenge 21/25 to support staff in service refusal (LACORS, 2010; Home Office, 2010;
Willner et al., 2000). Through such work, test purchasing operations across England found
that sales of alcohol to minors reduced from 50% in 2004 to 15% in 2007 (Hughes et al.,
2010).

                                                                                            6
Following presentation of the results and recommendations from the Liverpool study to
multi-agency partners in the city, Liverpool City Council and Merseyside Police developed an
intervention to address sales of alcohol to drunks. The Say No To Drunks pilot intervention
(see Appendix 1) aimed to: increase awareness of legislation preventing sales of alcohol to
drunks among licensees, bar staff and the public; support bar staff compliance with the law;
provide a strong deterrence to selling alcohol to drunks through creating a realistic threat of
prosecution for offenders; and promote responsible drinking amongst nightlife users. The
intervention combined key features from the evidence-based STAD programme in Sweden
and the UK Challenge 21/25 schemes. It also incorporated a breathalyser component based
on a police-led intervention previously implemented in Norwich (Bamfield et al., 2014). Thus,
the Say No To Drunks pilot intervention combined:
A social marketing campaign that provided posters, t-shirts and badges for staff in
licensed premises clearly informing customers that it is illegal for them to serve
alcohol to people who are drunk;
A new bar staff training session focusing on preventing sales of alcohol to drunks;
Increased police enforcement activity in the intervention area;
Wider public awareness raising through media engagement work; and,
The provision of breathalysers to door supervisors to support entry refusal to drunks
and increase public awareness that nightlife patrons will not be permitted entry to
premises if intoxicated.
The Say No To Drunks pilot intervention ran from 17th October to 23rd November in
Liverpool’s Rope Walks nightlife area. The Centre for Public Health at Liverpool John Moores
University was commissioned to evaluate the pilot intervention and provide a baseline for
evaluating future work. The research aimed to:
Explore patterns of alcohol consumption amongst nightlife patrons and their use of
the night-time economy (NTE);
Identify knowledge of legislation on the service of alcohol to drunks amongst
nightlife patrons and bar staff;
Assess the visibility of the intervention, and nightlife user, bar and door supervisor
views on it; and,
Explore the impact of the intervention on: drinking behaviours; expectations and
tolerance of extreme drunkenness in Liverpool’s nightlife; awareness of the law; and
levels of alcohol-related harm occurring within the intervention area.
7
2. Methods

To fulfil the objectives of the study, multiple research methods were used.

2.1 Nightlife patron surveys: pre- and post-intervention
A short anonymous pre- and post-intervention survey was undertaken with patrons using
the Rope Walks nightlife area (intervention area) on Friday and Saturday nights (pre-
intervention survey: 17th and 18th October; post-intervention survey: 21st, 22nd and 28th2
November). The pre-intervention survey aimed to explore: personal drinking behaviours
including preloading; nightlife behaviours, including time entering the nightlife environment,
areas visited and expected to visit, and expected home time; expectations and tolerance of
drunkenness in Liverpool’s nightlife; and knowledge of legislation on service of alcohol to
drunks. To explore the impact of the intervention, the post-intervention survey asked the
same questions as the pre-intervention survey, as well as exploring participant awareness
and perceptions of the intervention, and potential behavioural change as a result of the
intervention. Surveys were designed to be completed by researchers on behalf of
participants in face-to-face interviews.

Trained researchers working in teams of at least two conducted surveys with nightlife
patrons between the hours of 10.00pm and 4.35am. 3 Surveys were conducted
opportunistically, with participants recruited in streets within the Ropewalks nightlife area.
Prior to approaching potential participants, researchers visually assessed their level of
intoxication based on criteria used by the police and in previous research (e.g. unsteadiness
[Perham et al., 2007]). Individuals who appeared highly intoxicated were not approached
due to ethical issues around their ability to provide informed consent, and researcher and
participant safety. Researchers approached eligible participants and introduced themselves
as being part of a research team from LJMU, provided a brief description of the research
and survey, and asked them if they would like to take part. Of 812 individuals approached,
401 refused to participate (49.4% of those approached for the pre-survey and 49.3% of
those approached for the post-survey). All remaining participants were provided with an
information sheet explaining the purpose of the study, what it would involve and assuring
them of confidentiality. The information sheet was also summarised verbally by researchers
to ensure participants fully understood what the study entailed and what they were
consenting to. No individuals declined to participate once the study had been fully explained
to them. Two hundred and twenty two individuals took part in the pre-intervention survey
and 189 in the post-intervention survey. Throughout the explanation of the study and

2
  An extra night of surveying was undertaken for the post-intervention survey. This was due to the impact of
                                                                                                       st  nd
wet weather conditions and a major sporting event on the survey sample size on the weekend of 21 /22
November.
3
  Researchers were available to survey participants up to 6am but no eligible individuals were surveyed after
4.35am due to intoxication levels.

                                                                                                           8
survey completion researchers continued to monitor and assess participant intoxication
levels. Eleven individuals who had started the survey were deemed too intoxicated to
participate. In these circumstances, researchers had been instructed to end the survey at a
convenient point and thank the participant for their time. Thus, 214 pre- and 186 post-
intervention surveys were used in the final analyses.
2.2 Nightlife area observations
On the nights that the nightlife patron surveys were conducted, researchers also undertook
routine observations of the nightlife environment and its users (excluding the additional
night of surveying [28th November] when only nightlife patron surveys were conducted).
Five minute observations were undertaken every hour on the hour between 10pm and 6am
(i.e. nine observations) in two specific locations (Concert Square and St Peters Square). Two
data collection tools were used. Firstly, a nightlife environment observation tool allowed
researchers to systematically record details about the area and nightlife users (including the
number and profile of nightlife users; levels of intoxication; the general atmosphere and
mood; the presence of police; and details of any alcohol-related harms experienced by
nightlife users). The observation tool was completed independently by two researchers at
the end of the five minute observation period. Secondly, a nightlife patron drunkenness tool
measured the flow of people in the area and assessed their levels of intoxication. Here, a
researcher counted every tenth person that walked past them4 (by counting legs to avoid
being attracted to more intoxicated individuals) and visually assessed their levels of
intoxication using three indicators: how steady they were on their feet; whether they were
swaying; and how loud they were talking (Perham et al., 2007). This was conducted during
the full five-minute observation period. A total of 660 nightlife patron drunkenness
assessments were conducted during the observation periods.
2.3 Door supervisor and bar staff surveys
During the final weekend of the Say No To Drunks pilot intervention door supervisors and
bar staff from venues that had implemented the intervention participated in a short
anonymous survey. During the week prior to survey implementation, bar managers/owners
from all Say No To Drunks pilot intervention venues were asked (via the intervention
implementation coordinator [Appendix 1]) if they would permit researchers to approach
door supervisors and bar staff during their working hours to invite them to complete the
survey with a researcher. All bar managers/owners agreed. Thus, between 8pm and 1am
(on 21st/22nd November), researchers conducted surveys with bar staff and door supervisors
opportunistically at participating venues. All bar staff and door supervisors working that
evening were eligible to participate in the survey, yet due to the practicalities of
4
If there were no nightlife patrons walking past the researcher, the researcher counted every tenth person in
the area from their left to right hand side (or vice versa).
9implementing the surveys during busy working hours researchers aimed to survey at least
one door supervisor and one bar server from each venue. Where appropriate, copies of the
surveys were left with venues for staff to complete at their convenience and collected by
researchers later that night or the following day/week.
The door supervisor survey aimed to identify their perceptions and experiences of using the
breathalysers. In total, 34 door staff completed the door supervisor survey, which was
administered in an interview format, with the researcher asking questions and recording
answers on the survey. Around ten door staff refused to participate because: they did not
want to share their views on the intervention; they were not aware of the intervention; or
they had not used the breathalyser during the intervention period. The bar staff survey also
used both open and closed questions that aimed to identify: bar server practice; awareness
of legislation around the service of alcohol to drunks; perceptions and experiences of the
intervention; and details of any training/support that they had received in relation to the
service of alcohol to drunks. Forty seven bar staff completed the survey and four refused to
participate. The bar staff survey was designed to be completed by bar staff anonymously.
2.4 Exploration of breath test data
Door supervisors from all Say No To Drunks venues that had agreed to participate in the
intervention and use the breathalysers were asked to record information (on a data
collection sheet) on each breath test they conducted. This included: the test date; the
approximate age and gender of the person completing the test; how drunk they thought the
person was prior to conducting the test; the breath alcohol concentration (BrAC) test score;
and the outcome resulting from the test score (i.e. if they were allowed into the venue or
turned away). Door staff were also asked to record details (age, gender, perceived level of
drunkenness, date) of those who refused to complete a breath test. All venues initially
agreed to collect information. However, data collection format, consistency and quantity
varied by venue, staff members and the week of the intervention. For example, whilst some
venues completed the paper data collection sheet, door staff from other venues found it
easier to record the information (in ink) directly onto the breath test tube (at their own
request). Within and between venues, door staff recorded information in varying formats
(e.g. age presented as a number and/or an age group). Further, data were not recorded
consistently. To identify how well data were collected, venues were asked to save all used
breath tubes. However, a number of venues had discarded the tubes whilst some door staff
reported that individuals often wanted to keep the tube following completion of the test.
Thus, the precise number of breath tests conducted during the intervention is not known,
nor do we know the proportion of those who were tested for whom data were collected. In
total, venues provided researchers (via the intervention implementation coordinator) with
details of 806 breath tests. Of these, 86.6% had at least one piece of information recorded.
102.5 Analysis of routine data sources
Data from Merseyside Police (police-recorded violent crimes) and the Royal Liverpool
Accident and Emergency department (A&E; assault-related attendances)5 were collected
and analysed to explore the impact of the intervention on alcohol-related harms. Data on
violent crimes (all and those occurring in licensed premises only) recorded on weekend
nights6 in the intervention area7 during the intervention period8, and the five weeks before9,
were analysed and compared to the same time periods from the previous year.10 Similar
analyses were conducted on assault-related A&E attendances, however it is not known if
these assaults occurred within the intervention area. Data on assault-related ambulance
call outs were also obtained and analysed, however numbers were too low to be presented
in this report.
2.6 Analyses of the Say No To Drunks bar staff training evaluation forms
In the four months leading up to the Say No To Drunks pilot intervention, the Alcohol and
Tobacco Unit (ATU) (Liverpool City Council) provided training on refusing alcohol to drunks
to 872 bar staff working in the city centre, including bar staff working at venues involved in
the intervention. Trainees were provided with an evaluation form at the end of the session
that assessed what they had learnt and their views on the training. Overall, 59 trainees from
venues participating in the intervention completed an evaluation form. These forms were
accessed, entered into a database and analysed by LJMU researchers for inclusion in the Say
No To Drunks evaluation.
2.7 Data analyses
All data were entered, cleaned and analysed in SPSS v21. Analyses used descriptive statistics,
chi-squared, analysis of variance, Mann Whitney U and Kruskal Wallis tests. To calculate the
amount of alcohol consumed by nightlife patrons, drinks were coded into standard UK units
using the following conversion: small glass of wine, 1.5 units; standard glass of wine, 2.1
units; large glass of wine, 3.0 units; pint of lager/beer/cider, 2.0 units; bottle of
lager/beer/cider, 1.7 units; can of lager/beer/cider, 2.0 units; bottle of alcopops, 1.5 units; a
single (25ml) shot of spirits, 1.0 unit; and a pitcher of cocktail, 6.0 units11.
5
The closest A&E to the intervention area, based within the city centre.
6
Fridays, Saturdays and Sundays between 6pm and 5.59am.
7
Police beat E112.
8 th rd
For analyses the intervention period used was: 20 October to 23 November 2014. The intervention
th
commenced on 24 October 2014.
9 th th
2014: 15 September to 19 October.
10 th th
2013: pre comparison period - 16 September to 20 October/ during comparison period - 21st October to
th
24 November 2013.
11
See: http://www.nhs.uk/Livewell/alcohol/Pages/alcohol-units.aspx.
112.8 Ethics
Ethical approval for the study was granted by Liverpool John Moores University Research
Ethics Committee.
2.9 Study limitations
There are a number of limitations to this study that should be considered when interpreting
the findings from this evaluation and if conducting similar research. Just under half of all
nightlife patrons approached to participate in the survey refused. During the post-
intervention survey weekend participant recruitment was affected by wet weather
conditions and a large sporting event that took place in the city. Our study relied on self-
reported estimates of alcohol consumption which were not verified. Finally, the type,
method and frequency of breath test data collection varied by venue, door supervisor and
across the intervention period.
123. Findings
3.1 Nightlife patron survey: pre-intervention
Sample characteristics
Two hundred and fourteen nightlife users took part in the pre-intervention survey; 47.2% on
the Friday night and 52.8% on the Saturday night. Half (51.9%) of all surveys were
completed between the hours of 10pm and 11.59pm. Half (50.0%) of participants were male.
Participant ages ranged from 18 to 56 years, with a mean age of 24 years. Just under half
(49.3%) of participants reported that they lived in Liverpool and nearly a third (32.9%) were
students.
Nightlife usage
Nearly a fifth (18.2%) of participants stated that this was their first night out in Liverpool City
Centre, whilst 28.6% reported that they typically go on a night out in Liverpool City Centre at
least once a week, 26.9% one to three times per month and 44.6% once a month or less. On
the night of survey, just under half (48.6%) of participants reported having come into
Liverpool City Centre before 10pm. Over a third (37.6%) reported coming out between the
hours of 10pm and 11.59pm and 11.8% between midnight and 1.59am. Half (49.3%) of
participants stated that they expected to leave the city’s nightlife area between the hours of
2am and 3.59am, whilst 28.4% stated that they expected to go home between 4am and
5.59am. Overall, survey participants expected to be out in the city’s nightlife for an average
of six hours.
Participants were asked which nightlife areas in the city centre they had visited, or intended
to visit. At the time of survey, 14.8% of participants had not visited any pubs, bars or
nightclubs. Of those who had visited at least one venue, two thirds (67.2%) had visited a
venue(s) in one area of the city’s nightlife, 27.6% had been to venues across two areas and
5.2% three areas. The majority (89.1%) had visited a venue in the Ropewalks area
(intervention area), with smaller proportions reporting having visited venues in areas of
Mathew/Victoria Street (21.3%), Albert Dock (14.9%), Hardman Street (6.9%) and other
nightlife areas in the city centre (5.7%). The average number of venues visited at the time of
survey was three (range: one to ten venues).
Alcohol consumption
The majority (95.8%) of participants had consumed alcohol prior to taking part in the survey
(termed drinkers hereafter). A quarter of drinkers had started drinking before 6pm, 57.8%
between 6pm and 9.59pm, and 16.6% between 10pm and 1.59am. The mean time between
the first drink and survey participation was five hours. Two thirds (65.4%) of drinkers
reported having consumed alcohol at home or a friend’s home before coming out on their
13night out (preloading). Younger age groups and students were significantly more likely to report preloading (Table 1). Further, 20.0% reported consuming alcohol prior to entering the city’s nightlife, but after leaving their/a friend’s home (en route loading). Nearly six in ten (59.5%) of those who drank en route to the city’s nightlife reported consuming alcohol at a licensed premise (e.g. local pub), 24.3% on transport (e.g. bus, taxi), 10.8% in the street (e.g. whilst walking into the city’s nightlife) and 5.4% at another location (e.g. at work). The majority (84.9%) of drinkers had consumed alcohol in a pub, bar or nightclub in the city’s nightlife prior to survey participation, with older age groups significantly more likely to report this (p
participation, preloaders expected to drink significantly more alcohol over the course of the
night out than non-preloaders (preload, 21.4; non-preload, 15.4: p
Table 1: Alcohol consumption over the course of the night out, pre-intervention survey

                                                                 Sex                            Age group                         Student             Liverpool resident
            Alcohol consumption:
                                               All     Male     Female       p      18-21     22-29    30+         p       No        Yes      p      No      Yes        p
                                       %      65.4%    63.1%     67.6%     NS       74.7%    65.5%     48.8%
Figure 1: Participants perceptions on their and other nightlife users’ level of drunkenness
Very drunk
100% 10.00
9.00
80% 8.00
Mean drunkenness level
7.00
60%
6.00
%
5.00
40%
4.00
20% 3.00
2.00
0% 1.00
All
All
All
All
Male
Male
Male
Male
Female
Female
Female
Female
Completely
sober
Current level of Expected level of Ideal level of Perceived level of
drunkenness drunkennes when drunkenness drunkenness of
leaving the city's other nightlife
nightlife patrons
Figure 2 shows the median alcohol units consumed by the point of survey among drinkers
reporting low and high scores for each drunkenness statement. There were significant
differences between those who reported high and low drunkenness for: current
drunkenness (high, 15.0 units; low, 8.8: pParticipants were asked how much they agreed or disagreed with a range of statements relating to drunkenness using a five point scale from strongly agree to strongly disagree 13 (Figure 3). The majority (89.6%) of participants agreed (including strongly agree and agree) that getting drunk was socially accepted in Liverpool’s nightlife, with nearly two-thirds (63.0%) also agreeing that bar staff in the city centre do not care if people get drunk on their premises (Liverpool resident, 72.8%; non-Liverpool resident, 53.2%: p
Perceptions of the law around drinking, serving and purchasing alcohol
Just under half (46.9%) of all participants thought that it was legal for a bar server to sell
alcohol to someone who was already drunk, with a similar proportion (45.1%) stating that it
is illegal (8.0% selected do not know). Just over half (53.5%) of participants thought that it
was legal for a person to buy alcohol for a friend who was already drunk, whilst nearly a
third (32.9%) thought that it was illegal and 13.6% did not know. Whilst the majority (79.3%)
of participants thought that it was legal for a person to drink alcohol when they were
already drunk, 16.0% thought it was illegal and 4.7% did not know.

3.2 Nightlife patron survey: comparison of pre- and post-intervention surveys

Sample characteristics                  Table 2: Pre- and post-intervention survey sample
One hundred and eighty six              characteristics
individuals participated in the post-                                     Pre         Post          p
intervention survey compared with                                      n=214         n=186
214 in the pre-intervention survey.     Male                            50.0%        60.3%
3.4%; post, 3.9%: p=0.788) (at the point of survey). Further, there were no significant
differences in the median number of units consumed that were purchased in pubs, bars or
nightclubs or from an off licence or supermarket (at the point of survey) between pre- and
post-intervention survey drinkers (pubs/bars/nightclubs, 6.0 to 7.0 units, p=0.205; off
licence/supermarket, 8.0 to 7.0, p=0.535). Total median expected alcohol consumption over
the course of the full night out did not differ significantly between pre- and post-
intervention survey drinkers (pre, 15.7; post, 18.0: p=0.291).

Table 3: Alcohol consumption over the course of the night out, pre- and post-intervention
survey
Alcohol consumption:                                                        Pre        Post        P
                                                                  %       65.4%       53.9%
Similarly, a higher proportion of post-intervention survey participants agreed (strongly agreed/agreed) that it is easy for people who are drunk to buy more alcohol in pubs/bars/nightclubs in the city centre (pre, 73.0%; post, 79.4%: p=0.352). However, the distribution of responses to the question on whether participants would be more or less likely (or no change) to go to a bar if they knew it would not serve alcohol to someone who was drunk varied between surveys (p
3.3 Nightlife patron survey: intervention awareness
Near the end of the post-intervention survey participants were informed about the Say No
To Drunks pilot intervention and asked if they were aware of it; 14.0% (n=26) reported that
they were aware of the intervention. Of these, 23.1% (n=6) reported having heard about it
on the radio; 23.1% (n=6) had seen a poster; 15% (n=4) had heard about it via Facebook;
7.7% (n=2) had read about it in a newspaper or magazine article; whilst 3.8% (n=1) had seen
a bar staff Say No To Drunks badge or t-shirt. Over three in ten (30.8%; n=8) reported
knowing about the intervention via other means, primarily through seeing the breathalysers
being used by door supervisors in participating venues. Participants were then shown the
intervention posters to confirm whether or not they had seen them, and that the
intervention they had reported being aware of was in fact Say No To Drunks. At this stage, a
further six participants reported having seen the intervention posters. Thus, overall 17.2% of
post-intervention survey participants were aware of the campaign.

All post-intervention survey participants were then asked how much they agreed or
disagreed with a range of statements about the posters (Figure 6). Over half (52.9%) of all
post-intervention survey participants agreed (strongly agreed/agreed) that the materials
demonstrated that people who are drunk in bars will not get served more alcohol; a third
(36.9%) disagreed (strongly disagreed/disagreed), whilst 10.2% selected neither
agree/disagree. Much smaller proportions agreed with the remaining statements. A third
(34.8%) agreed that the intervention makes them feel safer whilst on a night out in
Liverpool City Centre. A quarter (24.6%) agreed that the intervention would make them
more likely to come on a night out in Liverpool City Centre. Just over a fifth agreed that the
intervention would make them drink less alcohol before a night out in Liverpool City Centre
(22.7%) or whilst in bars on a night out in Liverpool City Centre (22.7%).

Figure 6: Post-intervention survey participant perceptions of the Say No To Drunks pilot
intervention
                                               Strongly agree          Agree        Neither   Disagree        Strongly disagree

Would make me more likely to come on a night out in
                                                          1.1 23.5                    30.5                  41.7         3.2
             Liverpool City Centre

  Makes me feel safer on a night out in Liverpool City
                                                          1.1      33.7                16.6            40.1             8.6
                       Centre

 Would make me drink less alcohol whilst in bars on a
                                                          .5    22.2         13.0               53.0                  11.4
         night out in Liverpool City Centre

Would make me drink less alcohol before coming on a
                                                    1.1 21.6                   20.0                  48.1               9.2
  night out in Liverpool City Centre (e.g. at home)

 Demonstrates that people who are drunk in bars will
                                                     4.8                     48.1             10.2           30.5       6.4
           not get served more alcohol

                                                         0%            20%            40%      60%            80%        100%

                                                                                                                               22
3.4 Nightlife area observations In two set locations in the Ropewalks nightlife area, researchers undertook routine observations of the environment and its users. Five minute observations were undertaken every hour on the hour between 10pm and 6am. Two data collection tools were used; a nightlife environment observation tool and a nightlife patron drunkenness tool. The observations aimed to provide a basic indication of whether the Say No To Drunks pilot intervention had any impact on the number or type of nightlife patrons visiting the area, or the levels of intoxication and unruly behaviours seen on the street. Number and type of nightlife patrons in the area In total, 72 observations were completed across the two locations; 36 in the pre- intervention period and 36 in the post-intervention period. There were no nightlife patrons present in three observations. Where they were present, the estimated number of nightlife patrons present in the observation area at any one time ranged from one to 350 (mean 98.6; Figure 7). The mean number of nightlife users was significantly higher on Saturdays than Fridays (Fridays, 55.9; Saturdays 137.7: p
nightlife users were estimated to be in groups of males, 29.0% in mixed groups, 15.4% in
groups of females, 8.3% in couples and 4.7% were alone. Compared with the pre-
intervention observations, a significantly higher proportion of nightlife users in the post-
intervention observations were estimated to be in mixed groups (pre, 24.9%; post, 32.7%:
p
observation (p
Environment
The environment of the area under observation and the behaviour of nightlife patrons
within the area were assessed using a series of rating scales (from 0 to 9) measuring: noise
levels; rowdiness; behavioural expectations; nightlife patron mood; and the overall
atmosphere. On all scales, higher values represented more ‘problematic’ levels (see Table 4).
Both the pre- and post-intervention observations showed a similar trend in mean scores
(Figure 10 and 11). Thus, from the first observation at 10pm the mean score for each scale
increased, peaking at 3am. From which point the mean scores for each scale reduced rapidly.
There was a significant difference in all scale ratings by hour of observation (p
Figure 11: Mean ratings on environment and nightlife patron behaviour scales by hour of
observation, post-intervention weekend only, Concert Square and St Peters Square
combined
               7.0      Global rating of rowdyness                   Overall noise level

               6.0      Overall decorum / behavioral expectations    General mood
                        Overall atmosphere
               5.0
  Mean score

               4.0

               3.0

               2.0

               1.0

               0.0
                     10pm      11pm     12am         1am     2am     3am        4am        5am   6am

Table 4: Description of nightlife environment observational tool measurements

Label                       Scale                                    Scale range
Intoxication                Intoxication level of people in the      0 no sign of intoxication → 9
                            area (at any one time)                   everyone is drunk
Noise                       Overall noise level of the area          0 very quiet/easy to talk → 9
                                                                     hurts ears/cannot talk
Rowdiness                   Global rating of rowdiness in the area   0 none/very rare → 9 out of
                                                                     control
Permissiveness Overall decorum / behavioural                         0 no offensive/abusive
               expectations (i.e. tolerance of                       behaviour → 9 anything goes
               abusive behaviour)
Mood           General mood of nightlife patrons                     0 all pleasant → 9 all hostile
Atmosphere     Overall atmosphere in the streets                     0 very safe/comfortable → 9
                                                                     very unsafe/threatening

3.5 Bar staff surveys
Sample characteristics
Forty seven bar staff completed the survey of which 59.6% were male. Participant ages
ranged from 18 to 40 years, with a mean age of 24 years. The number of shifts worked in
the past month ranged from five to 25, with a mean number of 15 shifts worked.

Alcohol service and drunkenness
Participants were asked two questions relating to the service of alcohol to drunk people.
Eight out of ten (80.9%) participants stated they would never serve alcohol to a drunk

                                                                                                       27
person and felt very confident (83.0%) in refusing the service of alcohol to a drunk person.
Participants were also asked who they thought was responsible for preventing drunkenness
and related problems within the bar. Overall, participants felt that bar staff (95.7%), door
supervisors (85.1%), managers (70.2%), customers (31.9%) and the police (25.5%) were
responsible for preventing drunkenness and related problems within the bar.
The Say No To Drunks pilot intervention
Participants were asked whether they recalled seeing or hearing about the Say No to Drunks
pilot intervention. Questionnaire data revealed that the majority of participants had seen
the t-shirts (72.3%) and posters (68.1%), over half (57.4%) recalled seeing the
stickers/badges and a quarter (25.5%) had seen the cup/mug (Appendix 1). Moreover, one
third (34.0%) of participants reported seeing information about the intervention in a
newspaper article, and a fifth (21.3%) hearing about the intervention during a radio
advert/discussion.
Participants were asked if they had referred to any materials from the intervention whilst
serving alcohol to customers during the intervention period. Over a third (36.2%) of
participants reported that they had. Of these, 86.7% specifically recalled the intervention
materials they had referred to (e.g. badges, t-shirts and posters).
Participants were asked whether they knew it was illegal to serve alcohol to a drunk person
prior to the Say No to Drunks pilot intervention being implemented. The majority (87.2%)
stated that they had. However over half (56.5%) of participants reported feeling more
comfortable in refusing the service of alcohol to a drunk person since the intervention was
implemented, with 71.7% also stating that they were now less likely to serve alcohol to a
person who is drunk (Figure 12). Moreover, 60.9% of participants felt that the intervention
helped them refuse the service of alcohol to a drunk person, with the majority (93.6%)
agreeing that the intervention was effective in demonstrating that alcohol will not be served
to a drunk person. Nearly half (47.8%) of all respondents agreed that the level of
drunkenness had decreased in their bar since the launch of the Say No to Drunks pilot
intervention.
Alcohol server training
Participants were asked if they had participated in the Say No To Drunks bar staff training
programme run by the Alcohol and Tobacco Unit. One third (34.0%) of participants reported
receiving the training, with the majority (62.5%) having completed the training within the
last three months. A higher proportion of those who had received the training stated that:
they would never serve a drunk customer (trained, 87.5%; not trained, 77.4%; p=0.533);
they felt very confident in refusing service of alcohol to a person who is drunk (trained,
93.8%; not trained, 77.4%; p=0.337); and they knew it was illegal to serve a drunk customer
(trained, 93.8%; not trained, 83.9%; p=0.336).
28Participants were also asked if they had received any other training around the service of
alcohol to drunks. The majority (78.3%) said they had, with 60.7% of those participants
having had the training within the last three months. Six in ten (60.0%) participants reported
that they had received training/advice/information from their managers/supervisors on the
service of alcohol to drunks as part of the Say No to Drunks pilot intervention. Of these,
most (85.7%) recalled some aspects of the staff training and information provided by their
managers/supervisors surrounding the service of alcohol to drunks (e.g. regular team
meetings and training).
Figure 12: Bar staff views on the impact of the Say No To Drunks pilot intervention
Agree Disagree Neither
Since the campaign, the level of drunkenness
47.8 15.2 37
amongst customers in this venue has decreased
The campaign is effective in demonstrating that
people who are drunk in bars will not get served 93.6 4.3 2.1
more alcohol
The campaign has helped me refuse service of
60.9 10.9 28.3
alcohol to drunk people
Since the campaign, I am less likely to serve alcohol
71.7 6.5 21.7
to a drunk person
Since the campaign, l feel more comfortable
56.5 10.9 32.6
refusing service of alcohol to a drunk person
0% 20% 40% 60% 80% 100%
%
3.6 Door supervisor survey interviews
A total of 34 door supervisor surveys were completed across 19 venues that were taking
part in the intervention. Over three quarters (79.4%) of participants had worked as a door
supervisor for three or more years. On average, in the past five weeks door supervisors had
worked at the venue where they were being surveyed on four Fridays and four Saturdays.
Nearly three in ten (29.4%) door supervisors also worked at another venue in the city centre.
Door supervisors were asked what they knew about the Say No to Drunks intervention. The
majority (76.5%) were aware of the intervention; whilst just under a quarter (23.5%) were
not. Further, of those who were aware of the intervention, the key theme that emerged was
the use of the breathalysers. Nearly two-thirds (65.4%; n=17) mentioned using breathalysers,
29with two linking the breathalysers to reducing violence in drunk customers, six discussing
how they can be used as a tool to refuse entry into a venue and three mentioning using the
0.7 breath alcohol concentration (BrAC) cut off as a means to identify drunk people. Eight
door supervisors discussed the intervention as a method of reducing violent incidents and
behaviours linked to alcohol consumption, and seven mentioned refusing customer entry to
venues if they were too intoxicated.
Almost three quarters (73.5%) of door supervisors who completed the survey had used the
breathalyser machines during the intervention. Of these, all (100%) thought the
breathalysers were easy to use and the majority (71.4%) thought they were a useful tool.
However these finding are somewhat expected given that at some venues those who
completed the survey were those who had the most experience of using the breathalysers
through choice (i.e. they liked using the tool) and circumstance (i.e. they were the door
supervisor tasked with conducting the breath tests). Of those who thought they were a
useful tool, most thought it helped prove potential customers were too intoxicated and was
a good back-up for refusing someone entry to a venue. Door supervisors who did not think
the breathalyser was a useful tool tended to believe that their own judgement was good
enough and that they would refuse the same people anyway. One door supervisor
mentioned that nightlife patrons may perceive the breathalyser as a game of “who can get
the highest score” and not take it seriously. Even amongst those who thought the
breathalysers were a useful tool, practical, technical and ideological issues were still noted
by many door supervisors.
Participants were asked what parts of the pilot intervention they thought worked
particularly well, what parts did not work well and if they were aware of any barriers to its
implementation. Given that the majority of door supervisors who were aware of the pilot
programme viewed it as the breathalyser element only, the breathalysers were the main
area of discussion and were viewed both positively and negatively. Ideologically door
supervisors had opposing views on the use of the breathalysers. Thus from one perspective
the breathalysers were welcomed, with door supervisors reporting that they acted as a
deterrent, discouraging drunk people from trying to access the venue. Further, they were
useful in refusing overly intoxicated customers entry in to a venue and reduced levels of
conflict at the venue entrance. Raising awareness around alcohol unit levels and safety was
noted as a positive aspect of the breathalysers. On the other hand, the use of the
breathalyser was seen as limited in its ability to add value to the role of a door supervisor,
with door supervisors reporting that they do not, and nor should other door supervisors,
need a tool to identify drunkenness, and if they do they are not skilled enough to be
working as a door supervisor. It was also felt that they got in the way of being able to do the
job properly and in some circumstances they made the job more difficult (see below). These
door supervisors tended to have worked in the industry for many years and appeared to feel
able to identify drunkenness and manage drunken behaviour and door entry effectively.
30Where they had used the breathalyser during the intervention, most often they reported
having done so reluctantly.
A number of practical and technical issues with using the breathalysers were highlighted.
The length of time that it took to use the breathalyser and record the results (as part of the
evaluation) was noted as a barrier to their use. This was particularly so during busy periods
when they had to deal with large volumes of customers or when conducting a test with
someone who was in a large group. Further issues were encountered in these circumstances
due to interference with the test procedure from other group members. Thus, some door
supervisors noted that they would be less likely to use the machine during busy periods or
with someone in a large group. Further, many door supervisors stated that they were not
clear about the procedure of using the breathalysers and whether they had to take a zero
tolerance approach to refusing entry to those with a BrAC score above 0.7 or if it was at
their discretion. Indeed feedback from door supervisors showed that each venue had a
different approach to implementing the breath tests. Whilst some conducted tests with
those who were clearly drunk (and when practical to do so), others conducted tests at
random, testing customers whether they appeared to be drunk or not (a couple of door
supervisors noted that it was a good way to engage with female customers). A number of
door supervisors noted that they had to conduct a set number of tests per night and that
this would sometimes mean testing customers unnecessarily (i.e. they did not appear drunk).
Finally, many door supervisors queried the reliability of the breath test machines, noting
that the battery life was too short and they felt that they did not always work properly (e.g.
gave the wrong reading).
A number of other barriers to the implementation of the breathalyser element of the pilot
intervention were raised. For example, some door supervisors stated that they had received
conflicting views from bar owners/managers with regards to how they manage venue entry.
Thus, whilst they were told to ensure they refuse entry to drunks, they were also reminded
that they needed to ensure the venue was full. One door supervisor noted that he would
not refuse a drunk person if that person was with a large group of friends who appeared to
be sober, if the bar was empty, as the loss of business would outweigh the potential
problems that one person may cause. This was reflected at another late night venue, where
the door supervisor stated that the majority of people that came to the venue were drunk,
so if they knocked every drunk person back the venue would be empty. A perceived lack of
awareness about Say No To Drunks amongst the public was also noted as a barrier to
implementing the breath tests. For example, it was reported that some customers did not
take the breathalysers seriously. Equally however, door supervisors also mentioned that
some customers avoided venues they knew were using the breathalysers and went
elsewhere (i.e. a non-participating venue) and that this was a barrier to implementation.
31You can also read