Extended Stay America Investor Presentation - June 10, 2020
←
→
Page content transcription
If your browser does not render page correctly, please read the page content below
Extended Stay America
Investor Presentation

June 10, 2020

disclosure
This presentation contains forward-looking statements within the meaning of the federal securities laws. These statements include, but are not limited to,
statements related to our expectations regarding our business performance, business strategies, financial results, liquidity and capital resources, capital
expenditures, capital returns, distribution policy, plans, goals, beliefs, business trends and future events, as well as the COVID-19 pandemic, its effects on the
foregoing, government action taken in response to the pandemic and action that we have or plan to take in response to the pandemic and other non-historical
statements, including statements relating to industry RevPAR trends. Forward looking statements involve known and unknown risks, uncertainties and other factors
that may cause Extended Stay America, Inc.’s (“ESA”) and ESH Hospitality, Inc.’s (“ESH REIT,” and together with ESA, the “Company”) actual results or
performance to differ from those projected in the forward-looking statements, possibly materially. For a description of factors that may cause the Company’s actual
results or performance to differ from projected results or performance implied by forward-looking statements, please review the information under the headings
“Cautionary Note Regarding Forward-Looking Statements” and “Risk Factors” included in the Company’s combined annual report on Form 10-K filed with the
Securities and Exchange Commission (“SEC”) on February 26, 2020 and other documents of the Company on file with or furnished to the SEC, including our
combined quarterly report on Form 10-Q to be filed with the SEC on May 6, 2020. Any forward-looking statements made in this presentation are qualified by these
cautionary statements, and there can be no assurance that the actual results or developments anticipated by the Company will be realized or, even if substantially
realized, will have the expected consequences to, or effects on, the Company, its business or operations. Except as required by law, the Company undertakes no
obligation to update publicly or revise any forward-looking statement, whether as a result of new information, future developments or otherwise. We caution you that
actual results may differ materially from what is expressed, implied or forecasted by the Company’s forward-looking statements.

This presentation includes certain non-GAAP financial measures, including Hotel Operating Profit, Hotel Operating Margin, EBITDA, Adjusted EBITDA, Funds from
Operations (“FFO”), Adjusted Funds From Operations (“Adjusted FFO”), Adjusted FFO per diluted Paired Share, Paired Share Income, Adjusted Paired Share
Income and Adjusted Paired Share Income per diluted Paired Share. These non-GAAP financial measures should be considered only as supplemental to, and not
as superior to, financial measures prepared in accordance with U.S. GAAP. Please refer to the Appendix of this presentation for a reconciliation of these non-GAAP
financial measures to the most directly comparable financial measures prepared in accordance with U.S. GAAP, and to the Company’s combined annual report on
Form 10-K filed with the SEC on February 26, 2020 for definitions of these non-GAAP measures.

This presentation includes certain operating metrics presented on a comparable system-wide basis. The term “Comparable system-wide” refers to hotels operated
under the Extended Stay America brand, including those owned, franchised or managed by the Company, for the full three months ended March 31, 2020 and
2019. For franchised or managed hotels, ESA earns certain fees based on a percentage of hotel revenues. The Company’s presentation of the Non-GAAP
Financial Measures does not replace the presentation of the Company’s consolidated financial results prepared in accordance with U.S. GAAP.

INDUSTRY INFORMATION
The information in this presentation regarding the lodging industry and the extended stay segment of the lodging industry, including trends and our position and the
position of our competitors, is based on a variety of outside sources and our good faith estimates, which have been derived from management’s knowledge and
experience in the areas in which our business operates. We have not verified the accuracy or completeness of the information or any assumptions underlying the
information. While such information is believed to be reliable for the purposes used herein, no representations are made as to the accuracy or completeness
thereof and we take no responsibility for such information. We caution you not to place undue weight on the industry and market information included in this
presentation.
Unless otherwise indicated or the context requires, the term “industry” refers to the lodging industry and the terms “segment” or “market” refer to the extended stay
segment of the lodging industry.
WHO WE
 ARE

Extended Stay America overview
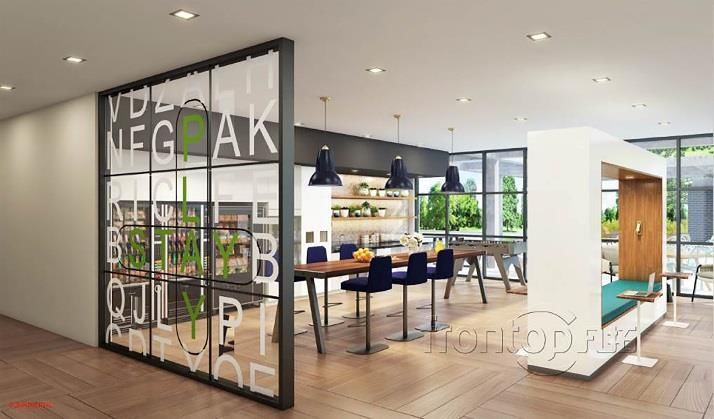
Extended Stay America hotel features
fully equipped kitchens
free grab-and-go breakfast
free in-room wi-fi
on-site laundry facilities
pet-friendly rooms available
our guests typically stay a week or longer
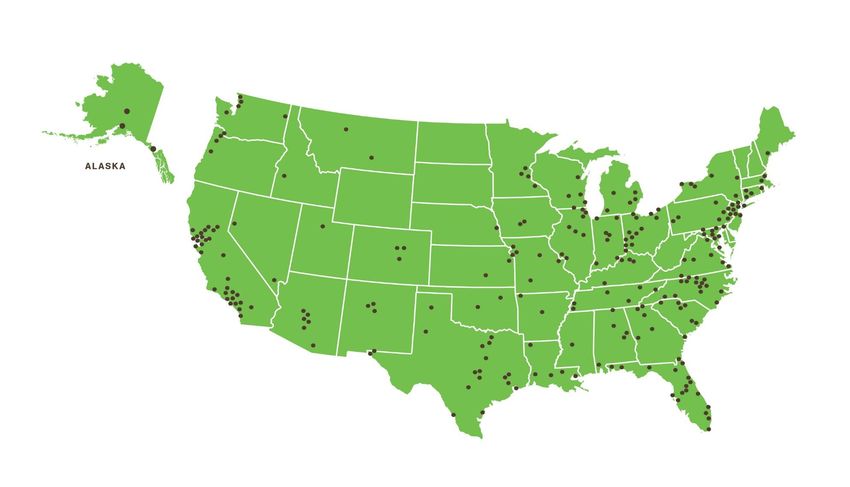
634 hotels nationwide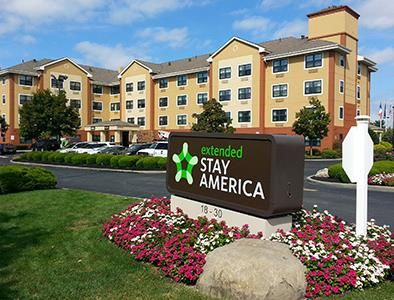
why customers choose ESA
                   Extended Stay America’s customers are typically working on projects or are in transition:
                   corporate clients, small business travelers and those on personal stays

                    primary reason why people choose ESA                        our customers

                              other            price/value                               personal
                                                                                                          business

                              kitchen          location

                                                                                 revenue mix by length of stay1
                    ESA demographics
                                                                                       medium term
                    gender         52% male, 48% female                                 (7-29 nts)        short term
                                                                                                           (1-6 nts)
                    HHI            ~$75,000
                                   84% of guests use the kitchen during their                long term
                    kitchen                                                                 (30 or more
                                   stay
                                                                                                nts)

1   For the twelve months ended December 31, 2019
our national scale and great locations

                                                                                             Brand                           Parent

                                                                           70,000

                     41,117                             TownePlace Suites

                    38,332                            Candlewood Suites

            9,737                                          Hawthorn Suites

    4,636                                                   MainStay Suites

 2,745                                             Other, approximately                                                          various

                             1 Mid-Priced extended stay hotels defined as a hotel brand with a $55 to $105 Average Daily Rate
                              with a kitchen in the guest room; # of rooms as of latest SEC filings for each corporation as of
                             12/31/2018 or 9/30/2019. Other estimated based on The Highland Group Q4 2018 report. North
                             American room count only.
national scale and great locations

our guests’ self sufficiency and long stays

                                                   Operating
               TTM rev mix1   Avg. nightly rate1
                                                   margin 1,2
                                                                           52%
 1-4 nights       32%               $75             48%

 5-29 nights      26%               $73             55%
                                                                        Extended                     34%
 30+ nights       42%               $59             52%                   Stay                      overall
                                                                        America3                   industry4

                                                                         hotel operating margin

Long Length      +        Limited          =        High
  of Stay                 Service                  Margins

                                                                1 Based on 2019 results for ESA
                                                                2  Allocates fixed expenses evenly to all occupied rooms. See
                                                                   Appendix for Hotel Operating Margin reconciliation.
                                                                3 Source: 2019 results for ESA
                                                                4 Source: STR 2019 HOST Study; industry margins adjusted to

                                                                   exclude franchise and management fees
COVID-19
$   Pandemic
     Update
               %
Improving trends with strong outperformance versus
           industry and chainscales.….

1Total industry RevPAR numbers per STR, Inc. (“STR”), a CoStar Group Company. Neither STR nor Highland endorse the Company, nor any other
Company, and the data provided by each such company should not be viewed as investment advice or as a recommendation to take a particular course of
action.
….as well as compared to other mid-priced extended
stay hotels & competitive set
Significant RevPAR index gains made since COVID-19 have continued into June
Significant RevPAR outperformance vs other mid-priced extended stay hotels year to date,
highlighting the strong STAY model versus the larger transient brand families
1Mid-pricedextended stay RevPAR per The Highland Group, Inc. (“Highland”). May data not yet available for mid-priced extended stay. Neither STR nor
Highland endorse the Company, nor any other Company, and the data provided by each such company should not be viewed as investment advice or as a
recommendation to take a particular course of action.
See Appendix for RevPAR Index definition and disclosure.Profile well positioned in COVID-19 environment
Majority of STAY’s guests are driving to hotels; ~75% of locations are suburban
Extended stay guests have proven more resilient – STAY’s guests average length
of stay is ~30 nights vs ~2 nights for overall industry
Focus on long term construction projects, medical workers and residential-like business
Full kitchen and refrigerator in room assist guests worried about COVID-19
exposure while traveling or with limited dining out options
Very limited urban, group and in-bound international exposure
Occupancy rebounding since early April – over 75% for the w/e 6/6/20
More hotels with 90% or higher occupancy than below 60% occupancy system-wide1
No hotels were closed due to COVID-19
Low break-even occupancy
Hotels are in midscale and economy chainscale, which has significantly
outperformed the broader lodging industry
1 as of June 10, 2020Actions taken in response to COVID-19
• Provided additional cleaning in our hotels, with a focus on high touch areas.
• Purchased and supplied PPE for our associates for their safety.
• Reduced interactions between our guests and our associates including temporarily
suspending our grab n’ go breakfast and switching to every other week housekeeping
from weekly housekeeping.
• Launched STAY Confident program to focus on health, safety and comfort for guests
• Increased effort and focus to attract guests staying for a month or longer at a time, which
has proven significantly more resilient to date than the broader lodging industry.
• Reduced payroll hours due to lower occupancy and longer length of stay guests at a
number of our properties.
• Total capital expenditure reduction of approximately $50 million for 2020, including a
reduction in non-guest facing capital expenditure, as well as renovations and new hotel
construction capital expenditures.
• Drew full $400 million in revolver capacity. $725 million in cash on hand at end of Q1.
• Utilizing the CARES act to reduce our 2020 tax liability and other measures.
• Suspended Paired Share repurchases and have reduced quarterly distribution.Strong balance sheet
» long dated maturities – weighted average maturity of 5.9 years1
» Over 70% of STAY debt is fixed
» low cost of debt – weighted average cost of debt 4.4%1
» mix of covenant light term loan B and unsecured notes;
ESA revolver covenant waived through Q2 2021
» Over $700 million in cash on balance sheet1
maturity amount/ interest
debt capitalization1
date millions rate
Term Loan B 2026 $628 L + 2002 Current Credit Ratings
Senior Senior
Corporate Outlook
ESH REIT revolver ($350m) 2024 $350 L + 200 Secured Unsecured
S&P BB- BB+ BB- Negative
ESA revolver ($50m) 2024 $50 L + 225 Moody's Ba3 Ba2 Ba3 Negative
total secured debt $1,028
senior unsecured notes 2025 $1,300 5.25%
senior unsecured notes 2027 $750 4.625%
preferred stock3 2020 $7 8.00%
total unsecured debt $2,057
total company debt $3,085
1Asof 3/31/2020
2$150m swapped to fixed LIBOR of 1.175% as of 3/31/20
3Mandatorily redeemable in November 2020.Four Pillars Of Value Creation
Pillar I: Improve Property Operations
» re-dedicating the Company to execution and to the basics of
  our high margin extended stay operating model
» launching QA function nation-wide in 2020
» Re-align property level compensation and upgrade field talent
  to improve executive and provide a strong, consistent
  experience to our guests
» testing certain modifications to our labor model to ensure we
  more consistently provide a favorable guest experience
» commercial engine to be focused on delivering more
  extended stay guests to our properties that are a good match
  for our product and operating model
» Revamp ESA website and call-center to focus on core ESA
  extended stay guests
» Reduce reliance on OTAs
Pillar II: Asset Light Franchise Unit Growth Plan

     » building a pipeline1
        •   pipeline of 73 hotels, including 59 franchise
            hotels, or ~14% of existing supply1

     » converting hotels to ESA brand
        » 7 hotels conversions since 2018, including 4
          franchise conversions

     » expect to wind down on-balance
       sheet development in the next 12-18
       months
        » Strong early performance of new hotel
          openings and acceptance among franchise
          community means we do not need to do proof
          of concepts going forward

                                                            1As of 3/31/2020; Actual pace and size of development, franchising, land acquisition,
                                                            hotel pipeline, and re-franchising activity may differ materially from indicated.
Pillar III: Maximize the value of ESH REIT
»559 hotels across 41 states
»plans to aggressively curate certain
hotels for better and higher use
»reviewing the entire portfolio for
opportunities to create shareholder
value
»plan to outline potential value creation
upside at an analyst day 2020
Actual pace and size of development, franchising, land acquisition, hotel pipeline, and
re-franchising activity may differ materially from indicated.Pillar IV: Capital Returns to Shareholders
»Commitment to return most excess free cash flow to shareholders
through a strong dividend and share repurchases
»Will continue to maintain a long dated, conservative balance sheet
»Capital returns during pandemic to be lower than historical, but will
remain a high prior medium and longer term
capital returns to paired
shareholders1 (in millions)
$340
$301
$247
$221
$135
$108
2014 2015 2016 2017 2018 2019
1 Includes regular dividends, a special dividend and Paired Share repurchasesrecent developments
» Q1 RevPAR declined 5.8% compared to 19% for the industry1
» April and May 2020 RevPAR declined ~35% and 28% respectively
compared to same periods in 2019, significantly better than industry,
chainscale and competitive set1
» RevPAR has rebounded from $31 in early April to over $42 in early June
» Q1 Adjusted EBITDA of $97.7 million
» pipeline of more than 70 ESA hotels2
» More than 75% of ESA’s pipeline is franchise hotels
» 4 ESA hotels opened or converted so far in 2020
» recently extended debt maturities at attractive rates with a weighted
average maturity rate of 5.9 years2
» No significant maturities until September 2024 and WACD of 4.4%2
» Over $700 million in cash on our balance sheet2
» analyst day planned in 2020
» Outline 3 year vision and financials for ESA
1 Data from the Company, public peer filings, STR and The Highland Group
2 As of 3/31/2020APPENDIX
experienced hospitality & consumer management team
               Executives                                   Experience                      Previous Firms
 Bruce Haase                                  • CEO since November 2019. Board
 Chief Executive Officer                        member of ESH Hospitality since 2018.
                                              • Former CEO of Woodsprings Hotels, Inc.
                                                2014-2016
                                              • Various executive leadership roles at
                                                Choice Hotels, Inc. over 12 years, most
                                                recently as EVP Global Brands, Marketing
                                                & Operations

 Brian Nicholson                              • CFO since May 2018
 Chief Financial Officer                      • Former CFO from 2016 to 2018 for The
                                                Fresh Market
                                              • Previous Financial Leadership roles at
                                                Extended Stay America, The Fresh Market
                                                and Driven Brands from 2004-2016, most
                                                recently CFO with Driven Brands

 Kelly Poling                                 • Chief Commercial Officer since January
 Chief Commercial Officer                       2020
                                              • Over 30 years of leadership experience in
                                                lodging, most recently as CEO of

 Randy Fox                                    • EVP, Hotel Operations since November
 Executive Vice President, Hotel Operations     2019. Formerly COO of InTown Suites and
                                                Uptown Suites. EVP Operations at
                                                Woodspring Hotels from 2012 to 2016.
                                                Randy spent 12 years in Operations at
                                                Red Roof Inn, most recently as SVP
                                                Operations from 2007-2012.
expected economics of new build STAY hotel
strong economics for new builds
assumed stabilized economics2
build cost
construction costs $70 to $75k per key1 # rooms ~124
land costs $1.0 to $2.0 million per site occupancy 75%
ADR $65 - $85
hotel P&L2
RevPAR $49 - $64
hotel revenue $2.2 million to $2.9 million
hotel expenses $0.9 million to $1.0 million
property EBITDA $1.3 million to $1.9 million
FFE reserve @ 3%-4% $0.1 million
net operating income $1.2 million to $1.8 million
1 Excluding soft cost items
2 Expected average for a new ESA company owned hotel in year 2tax efficient corporate structure
100% public ~42%
shareholders
and sponsors ESH REIT Entities
corporation entities
debt
Extended Stay ~58%
secured revolver
America, Inc.
secured term loan B
ESH Hospitality,
secured revolver
Inc. (REIT)
unsecured senior notes
trademark/ management operating
franchise company company lessees
property leases
property owning
entities
A Paired Share entitles its holder to participate in 100% of the common
equity and earnings of both Extended Stay America, Inc. and ESH
Hospitality, Inc.paired share structure
delivers superior free cash flow conversion
illustrative unlevered free cash flow less taxes C-Corp paired share structure
revenue $100 $100
paired share
EBITDA / % Margin $50 / 50% $50 / 50% structure results in
~15% greater free
EBIT1 / % Margin $40 / 40% $40 / 40% cash flow
tax / % tax rate2 ($13) / 25% ($8) / 16.5%
Capex / % of revenue ($6) / 6% ($6) / 6%
unlevered FCF less taxes $31 $36
unlevered FCF less taxes as % of EBITDA 63% 72%
1 Assumes depreciation and amortization expense equal to 10% of revenues
2 For Paired Share Structure, assumes 100% of REIT taxable income is distributed, of which
57% flows to the C-Corp and the C-Corp pays a 25%% tax rateRevPAR index
RevPAR Index is stated as a percentage and calculated by comparing RevPAR for comparable
system-wide hotels to the aggregate RevPAR of a group of competing hotels generally in the
same market. As such, the RevPAR Index is only a measure of RevPAR relative to certain
competing hotels and not a measure of our absolute RevPAR or profitability. We subscribe to
STR, Inc. ("STR"), an independent third-party service, which collects and compiles the data used
to calculate RevPAR Index. We select the competing hotels included in the RevPAR Index
calculation subject to STR's guidelines. The competing hotels included in STR guidelines will
generally include certain hotels that are not considered part of the extended stay lodging
segment of the hospitality industry and, instead, fall within the category of short-term stay
hotels. STR does not endorse the Company, or any other company, and STR data should not be
viewed as investment advice or as a recommendation to take a particular course of action.You can also read