FinTech Alternatives to Short-Term Small-Dollar Credit: Helping Low-Income Working Families Escape the High-Cost Lending Trap
←
→
Page content transcription
If your browser does not render page correctly, please read the page content below
FinTech Alternatives to Short-Term Small-
Dollar Credit: Helping Low-Income Working
Families Escape the High-Cost Lending Trap
                                                                           Todd H. Baker
                                                                                          May 2017

M-RCBG Associate Working Paper Series | No. 75

The views expressed in the M-RCBG Associate Working Paper Series are those of the author(s) and do
   not necessarily reflect those of the Mossavar-Rahmani Center for Business & Government or of
Harvard University. The papers in this series have not undergone formal review and approval; they are
presented to elicit feedback and to encourage debate on important public policy challenges. Copyright
              belongs to the author(s). Papers may be downloaded for personal use only.

                                                        Mossavar-Rahmani Center for Business & Government
                                            Weil Hall | Harvard Kennedy School | www.hks.harvard.edu/mrcbg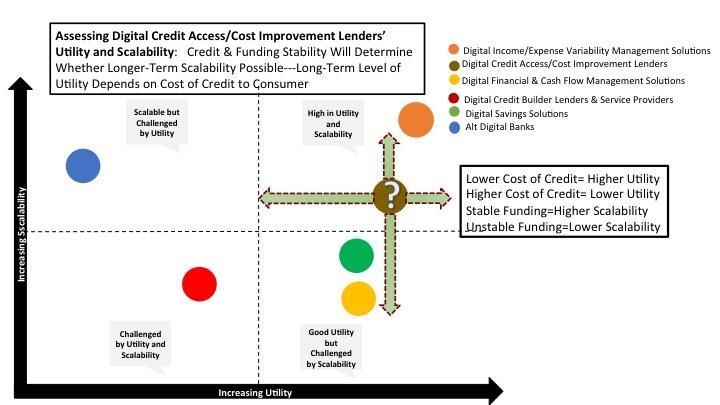
FinTech Alternatives to Short-Term Small-Dollar Credit--
Helping Low-Income Working Families Escape the High-Cost
Lending Trap

Todd H. Baker

May 2017
2
Abstract
The focus of this paper is the most promising alternative to the current short-term, small-
dollar credit (“STSDC”) system serving low-income working families --the rapidly growing U.S.
financial technology software –or “FinTech”--industry.
The paper begins by reviewing previous research on the underlying causes of demand for
STSDC--payday loans, auto title loans, bank overdraft protection and similar financial
products--by low-income working families. The author discusses evidence that rising levels of
monthly income volatility are creating a new set of liquidity management problems for
families, and documents the adverse impact that reliance on STSDC for liquidity support has
on working families, their communities, their employers and the economy as a whole.
The paper then describes regulatory interventions in this area and concludes that, despite
considerable effort and some local success, none have materially curbed the expansion—or
the adverse effects-- of STSDC products nationally. The author discusses why banks are not
likely to play a significant role in the STSDC market and argues that, in the anti-regulatory
political environment following the 2016 election, private sector FinTech alternatives now
offer the best opportunity to help low-income working Americans manage their day-to-day
finances without resorting to STSDC.
The next section of the paper is an assessment of the potential for FinTech companies and
products to provide a superior alternative to the current STSDC system. Using a variety of
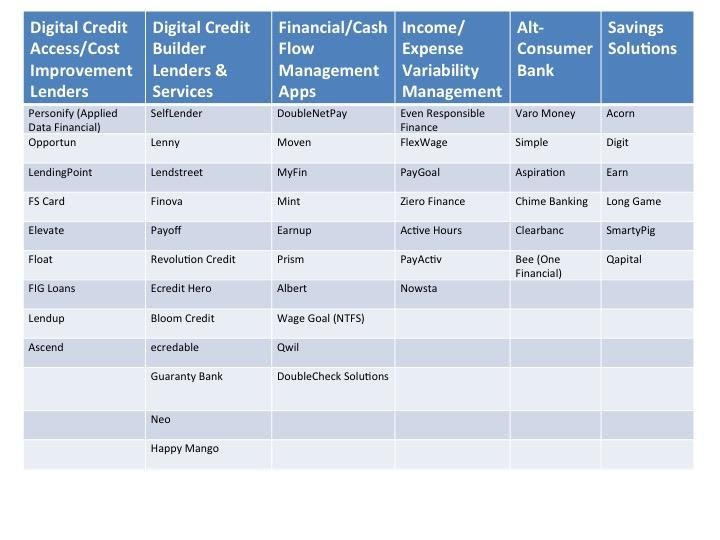
methods, the author identified relevant FinTech companies and classified them into six
distinct categories. Then author contacted 50 identified companies and conducted interviews
with senior management of 30 of these companies (several others were included in the study
without interviews based on the prior knowledge of the author.) Based on these interviews
and additional research, the author assessed individual FinTech companies and the identified
categories of companies for “Utility” (defined as the ability of the products offered by a
company to either provide a superior substitute for current STSDC products or an effective
mechanism for consumers to avoid the use of credit products) and “Scalability” (defined as
the potential for a company’s business model to support rapid penetration of the low-income
working family market to serve a significant portion of low-income working families.) Using
the assessments, the author distilled a detailed set of key observations about the strengths,
weaknesses and challenges facing each of the FinTech categories, including the likely
evolution of these categories over time.
The assessments show that FinTech companies in all of the categories, with one possibly
temporary exception, are today providing products that have greater Utility than STSDC for
low-income working families, and thus represent a meaningful improvement over the current
STSDC system. One category—Digital Income/Expense Variability Management Solutions---
was assessed as both the most Scalable and the highest Utility category measured in the
2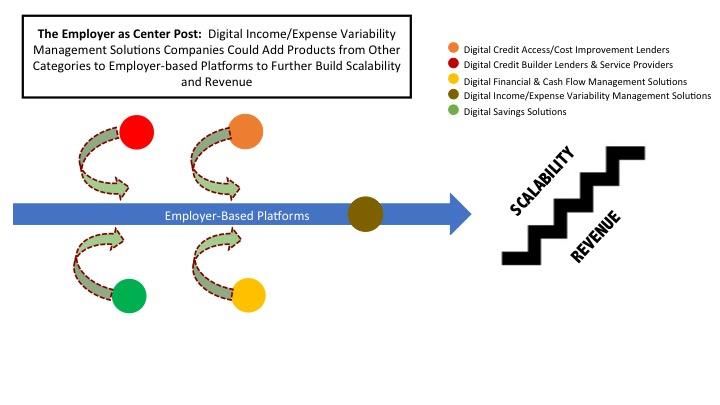
3
study. A second category--Digital Credit Access/Cost Improvement Lenders—was also
assessed positively in terms of both Utility and Scalability and should be able to provide
significant amounts of alternative credit to low-income working families, subject to a number
of important caveats. The other four categories of companies all had strengths in either
Utility or Scalability, but would need to evolve further before becoming significant
alternatives to STSDC for low-income working families.
The paper concludes that private sector adoption of a set of FinTech-centered alternatives to
STSDC has the potential to shift a significant fraction of low-income working families away
from reliance on the current STSDC system over time and to materially improve their financial
resiliency and health, without the need for government financial support or new laws or
regulations. The paper further argues that the employer channel is the best vehicle for
disseminating FinTech products to low-income working families because of its potential to
reach very large numbers of workers quickly with effective—and sometimes subsidized--
liquidity and financial management solutions which also provide financial benefits to
employers through reduced employee financial stress, improved employee engagement and
satisfaction, lower turnover and lower absenteeism.
Based upon the author’s calculations, the use of FinTech products from the studied
categories, alone or in combination, would be sufficient to manage a $700 to $980 maximum
monthly negative variance (combining below average income and above average expense) in
consumer income/expense, an amount sufficient in most instances to eliminate the need for
a low-income working family to use STSDC. The author’s calculations further show that if
these FinTech products were to become widely available, they would be able to address the
Utility needs of a minimum of 4.7 million and a maximum of 15.6 million full-time workers in
low-income working families. Collectively, the author believes that these FinTech products
could benefit virtually all of the 10.4 million low-income working families and, indirectly, the
47 million individual members of those families, by reducing or eliminating reliance on STSDC.
The paper proposes a number of concrete steps that private sector and government
employers, employee benefit providers, FinTech companies, other financial companies and
non-profits can take to accelerate the adoption of superior FinTech alternatives to STSDC by
low-income working Americans:
Employers (private and public) should adopt and subsidize employee financial health
benefit plans that include the highest Utility products from FinTech companies.
Employee benefits intermediaries should support adoption of financial health benefit
plans.
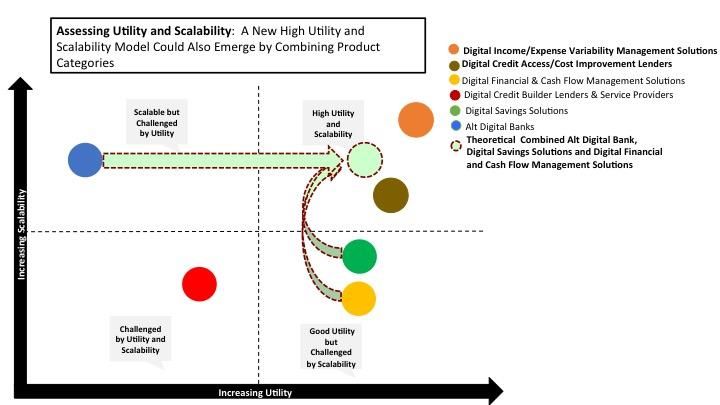
FinTech companies should broaden their offerings to incorporate the product
capabilities of other FinTech companies into their own product offering for low-
income working Americans.
3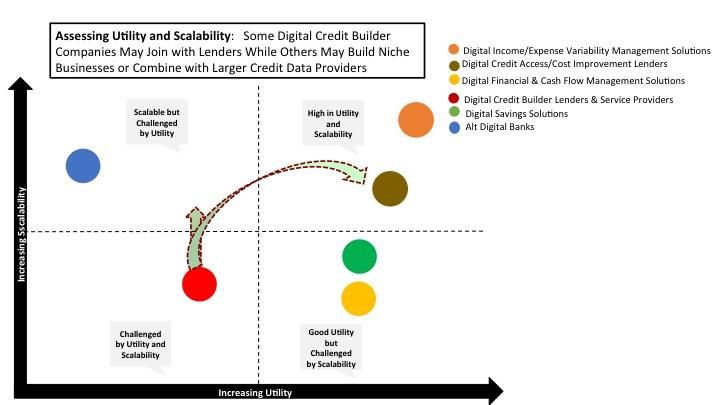
4
Non FinTech financial companies should adopt FinTech products to help improve their
own customers’ financial health.
FinTechs and financial sector should resolve data governance Issues
The non-profit sector should advocate for FinTech benefits and data governance and
consider subsidizing test cases.
The paper also sets forth public sector legislative/regulatory actions that could help
accelerate adoption of FinTech alternatives to STSDC:
o Congress should make employer contributions/subsidization with respect to
Employee Financial Health Benefit Plans tax deductible.
o State regulators should work collaboratively to reduce the burden of 50-state
licensing and compliance on FinTech companies.
o Federal and state banking regulators, with assistance from Congress as
necessary, should make insured banking charters (national and state) available
to FinTech companies with business models involving innovative digital deposit
taking and other digital banking/lending activities that are (i) consistent with
the purposes of banks generally but are (ii) inconsistent with the community
banking format of locally-based customers and physical distribution coupled
with a traditional mix of bank balance sheet and revenue components.
o Regulatory and statutory uncertainty about permitted uses of “alternative
data” should be resolved to avoid unnecessarily restricting the provision of
high Utility FinTech products to low-income working families.
4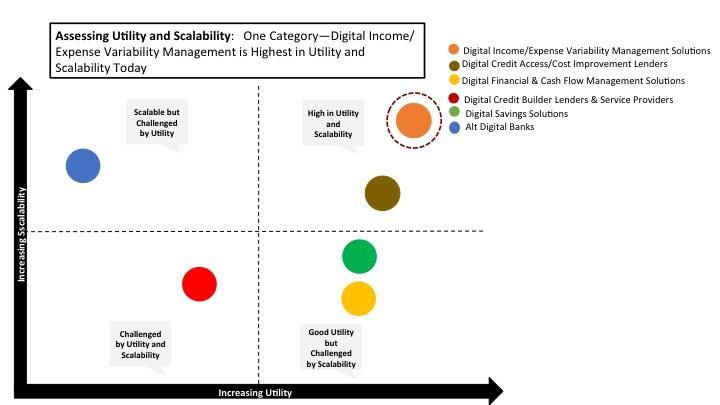
5

Introduction.

“Every poor person must be allowed a fair chance to improve his/her economic condition. This
can be easily done by ensuring his/her right to credit.”

–Mohammed Yunus

“Most small-dollar loan borrowers can afford to put no more than 5 percent of their paycheck
toward a loan payment and still be able to cover basic expenses…In the 35 states that allow
lump-sum payday loans, repayment of these loans requires approximately one third of an
average borrower’s paycheck.”

---Pew Charitable Trusts

“Families who lose their home to foreclosure not only forfeit their existing equity, they also lose
the opportunity to build savings, since they may be locked out of affordable credit for many
years. Students who get loans to finance poor quality education programs find themselves with
weak job prospects and heavy debt—debt that usually cannot be discharged in bankruptcy but
can be garnished from Social Security benefits. Likewise, in most states creditors of auto and
installment loans can seize property and garnish wages for up to 10 years when a borrower
defaults on a high-cost loan that was never affordable. Over time, the damage to individuals
becomes a community problem as significant spillover effects deplete the wealth of entire
neighborhoods and communities.”

—Center for Responsible Lending

“Ultimately, consumers have already rendered their verdict: they believe they benefit from the
option of payday loans. So instead of restricting or eliminating payday lending markets through
regulation, policymakers should seek to open them up to competition by repealing payday
lending bans and regulations. The goal should be to maximize consumer choice and minimize
the cost of short-term loan transactions. This will benefit economic growth generally and short-
term borrowers in particular.”

---Reason.org

The day-to-day financial lives of low-income working Americans have become more and more
precarious as income inequality has grown in the United States. Over the last 30 years, an
increasing proportion of income has gone to the top end of the income distribution, and

                                                                                                      5
6
particularly in the top 1-5%, while the lower end has fallen badly behind.1 In a profound shift
from the pattern of the post-World War II period, the benefits of productivity growth were not
shared with labor in the form of wage increases. Stagnant real wages,2 the loss of many higher
paying manufacturing and clerical jobs to technology and foreign competition,3 the decline of
unions,4 and real estate price inflation in urban areas5 are just a few of the many reasons that
have made it challenging for many low-income working people to “make ends meet” on a
consistent basis.
Battered by economic forces over which they have little control, many lower-income Americans
live on the edge. For the lowest quintile of the U.S. income distribution in 2014, housing
absorbed 41% percent (50% for renters) of spending and the next 30% was split between food
1Average family income, by group, 1947–2010 (2011 dollars) EPI.org [nd] Available at:
http://stateofworkingamerica.org/chart/swa-income-table-2-1-average-family-income/
Individual wealth has become even more concentrated, with 77.2% of total wealth
concentrated in the top 10% and 22% of total wealth concentrated in the top 0.1% as of 2012.
Saez, E. and Zucman, G. Wealth Inequality in the United States Since 1913: Evidence from
Capitalized Income Tax Data. National Bureau of Economic Research. 2014. P. 22. Available
from: http://gabriel-zucman.eu/files/SaezZucman2014.pdf
2 Employed Full Time: Median usual weekly real earnings: Wage and salary workers: 16 years
and over. FRED® Economic Data: Federal Reserve Board of St. Louis Economic Research. 2016.
Available at: https://fred.stlouisfed.org/series/LES1252881600Q
There are useful critiques of the data techniques used in standard analysis of wage levels which
suggest that real wages may have increased more than suggested and that consumption in the
lower end of the income distribution has increased at a higher rate than real wages. See
Sacerdote, Bruce. Fifty Years of Growth in American Consumption, Income and Wages. National
Bureau of Economic Research, 2017 http://www.nber.org/papers/w23292.pdf
3 Cocco, Federica, Most US Manufacturing Jobs Lost to Technology, Not Trade, Financial
Times, December 2, 2016 https://www.ft.com/content/dec677c0-b7e6-11e6-ba85-
95d1533d9a62
4 Dunn, M. and Walker, J., Union Membership In The United States. U.S. Bureau of Labor
Statistics: Spotlight on Labor Statistics. P. 2. 2016.Available at:
https://www.bls.gov/spotlight/2016/union-membership-in-the-united-states/pdf/union-
membership-in-the-united-states.pdf
5Florida, Richard. “The Incredible Rise of Urban Real Estate.” The Atlantic: Citylab. 2016.
Available at: http://www.citylab.com/housing/2016/02/rise-of-urban-real-estate/470748/
67
and transportation, with healthcare around 7% and clothing adding another 2%, leaving only a
small margin for personal insurance, pensions, education, discretionary expenses and
emergency expenses such as car repairs, unexpected healthcare costs, etc.6 Fully 36% of
households in the lowest income quintile and 29% of households in the second quintile in 2011
said that they had trouble paying the rent, buying food, paying for child care or otherwise
making ends meet at least once in the last year.7 When the balance between income and
expenses is so tight, even the smallest change in monthly income or expenses can trigger a
crisis.
And crises are becoming the norm for low-income working families. As we highlight below, a
newly recognized factor--the rising volatility in Americans’ monthly incomes due to irregular
work schedules, bonus plans and temporary bouts of unemployment--is triggering
unprecedented financial management problems for people who already living on the edge.
Today’s low-income working families experience more than a 10% increase or decrease in
income in half the months of the year8 along with large (25%+/-) variances in monthly
expenses.9 This level of volatility makes the task of managing family finances becomes nearly
impossible without external liquidity assistance. Those working families who fail to find a way
to fill the liquidity gap when income and expenses gyrate can find themselves excluded from
access to housing, jobs, bank accounts, critical utilities and participation in the credit economy.
One of the consequences of flat real incomes, increased income volatility and regular expense
volatility at the lower-end of the income distribution is severe personal financial stress.
6 Schanzenbach, D.W., Nunn, R., Bauer, L. et. al. Where Does All the Money Go: Shifts in
Household Spending Over the Past 30 Years. The Hamilton Project. [Brookings Institute] [nd]
[table 1] Available at: https://www.brookings.edu/wp-
content/uploads/2016/08/where_does_all_the_money_go.pdf
7 Siebens, Julie. Extended Measures of Well-Being: Living Conditions in the United States: 2011.
US Census Bureau: Household Economic Studies. 2013. [figure 4] Available at:
https://www.census.gov/prod/2013pubs/p70-136.pdf
8Consumer and Community Development Research Section of the Federal Reserve Board’s
Division of Consumer and Community Affairs. Report on the Economic Well-Being of U.S.
Households in 2015. Board of Governors of the Federal Reserve. 2016. P. 18. Available at:
https://www.federalreserve.gov/2015-report-economic-well-being-us-households-201605.pdf
9 Farrell, D. and Greig, F. Weathering Volatility: Big Data on the Financial Ups and Downs of U.S.
Individuals. JPMorgan Chase Institute. 2015. p. 3. Available at:
https://www.jpmorganchase.com/corporate/institute/document/54918-jpmc-institute-report-
2015-aw5.pdf
78
Research demonstrates that financial stress does real damage by shortening lives, worsening
health10 and impairing decision-making—especially financial decision-making—among stressed
people.11 And financial stress is not just a problem for individuals and families-- it affects
employers’ bottom line too, as distracted and anxious employees have higher rates of turnover,
absenteeism and generally perform worse on the job.12
The financial services industry has responded to the financial insecurity of low-income families
by creating new forms of high-cost, short-term, small-dollar credit (“STSDC”) products that
provide quick and easy liquidity injections for cash-strapped borrowers. These products, which
include payday loans, auto title loans, bank overdraft protection and the like—have become a
“de facto” liquidity support system for families dealing with the consequences of income
disparity and volatility. They are easily accessible to consumers in lower-income neighborhoods
lacking many other types of financial services. As we discuss in more detail below, these STSDC
product (which are with one major exception provided by non-bank lenders) are expensive,
poorly designed and demonstrably damaging to the lives of many of the consumers who use
them. While these products clearly satisfy urgent short-term consumer needs, the negative
10
”How financial stress can harm your health.” Foxnews.com. 2/4/15. Available at:
http://www.foxnews.com/health/2015/02/04/how-financial-stress-can-harm-your-health.html
11 Maron, Dina Fine. “Poor Choices: Financial Worries Can Impair One’s Ability to Make Sound
Decisions.” Scientific American. 8/29/13. Available at:
https://www.scientificamerican.com/article/poor-choices-financial/
Ariely, Dan. “Poverty makes financial decisions harder. Behavioral economics can help.” PBS
Newshour. 1/20/16. Available at: http://www.pbs.org/newshour/making-sense/poverty-makes-
financial-decisions-harder-behavioral-economics-can-help/
Thompson, Derek. “Your Brain on Poverty: Why Poor People Seem to Make Bad Decisions.” The
Atlantic. 11/22/13. Available at: https://www.theatlantic.com/business/archive/2013/11/your-
brain-on-poverty-why-poor-people-seem-to-make-bad-decisions/281780/
12Robertson, Linda. Moving the Needle: Raising Your Employees Financial Well-being to Lower
their Financial Stress. 34th Annual ISCEBS Employees Benefit Symposium. [nd] Available at:
https://www.ifebp.org/pdf/MediaSiteAssets/Symposium%20HO/15_Symp/14B_Moving_the_N
eedle_Raising_Your_Employees_Financial_Wellbeing_to_Lower_Their_Financial_Stress.pdf#se
arch=financial%20stress
Brune, Katherine W. Single Employer Case Study: Suntrust Bank. International Foundation of
Employment Benefit Plans. [nd] Available at:
https://www.ifebp.org/pdf/MediaSiteAssets/NEBD/Brune_NEBD16.pdf#search=financial%20str
ess
89
individual, social and economic costs of this type of high-cost liquidity support are well-
documented. There is little or no reason to believe that regular use of STSDC supports long-
term positive change in the lives of financially stressed consumers or leads to sustainable
economic growth.13
The growth in STSDC usage and the severe recession that followed the 2008 financial crisis
brought increasing government and regulatory attention to the negative effects of STSDC on
low-income families.14 This resulted in attempts by state and federal authorities to regulate
some STSDC practices, culminating in the STSDC regulations proposed by the U.S. Consumer
Financial Protection Bureau (CFPB) in 2016. Whatever one’s view of the wisdom or efficacy of
13The reasons for the emergence of these new types of STSDC products are complex and
beyond the scope of this paper. However, it is worth noting at least one of the key reasons—
the rise of automated credit scoring, which replaced older underwriting methods used to lend
to low-income consumers with a numerical score reflecting historical credit usage and payment
history. Credit scoring allowed significantly higher levels of credit risk differentiation among
borrowers, which in turn led to a much greater range of risk-based interest rates that could be
charged for loans. Credit scores also left many potential borrowers—those with poor or no
credit scores--unable to borrow from traditional banks and finance companies. STSDC
products, which do not require a credit score, were a natural outgrowth of this development.
14 During that period the U.S. federal government also sought to address underlying economic
pressures on low-income families through the Affordable Care Act, increased Medicaid
eligibility, Increased low-income tax credits, extended unemployment benefits and minimum
wage and overtime reform. Goldfarb, Zachary A., “Obama to raise minimum wage for
government contract workers.” The Washington Post. 1/28/14. Available at:
https://www.washingtonpost.com/politics/obama-to-raise-minimum-wage-for-government-
contract-workers/2014/01/27/f7994b34-87cd-11e3-916e-
e01534b1e132_story.html?utm_term=.b7cf1fa39a31
Holan, Angie Drobnic. “A credit for workers cuts taxes for middle class.” Politifact. 9/18/08.
Available at: http://www.politifact.com/truth-o-meter/statements/2008/sep/18/barack-
obama/a-credit-for-workers-cuts-taxes-for-middle-class/
Onink, Troy. “You Can Get $10,000 Per Child In College Tax Credits, Thanks To The Fiscal Cliff
Deal.” Forbes.com. 1/16/13. Available at:
https://www.forbes.com/sites/troyonink/2013/01/16/american-opportunity-tax-credit-pay-
for-college-and-pay-less-tax/#1a2395eb1a23
Dovere, Edward-Isaac and Levine, Marianne. “Obama overtime rule could raise wages for 5
million.” Politico. 6/29/15. Available at:
http://www.politico.com/story/2015/06/obama-overtime-rule-wage-raise-119566
910
these regulatory efforts, they reflected a political/societal view that the STSDC system was
doing harm to many users and needed to be changed.
That political/societal view has now changed. The 2016 U.S. election marked the almost certain
end of additional efforts to address the negative impacts of STSDC on low-income working
families for the foreseeable future, at least at the federal level. The hostility of the current U.S.
administration and Congress to the idea of consumer financial regulation generally and to the
CFPB’s regulatory efforts in particular15 has made the prospect of consumer-focused regulatory
change before 2021 highly unlikely.16
This means that market-based, private-sector alternatives now offer the best opportunity to
help low-income working Americans manage their day-to-day finances without resorting to
STSDC. Even if government leaders someday decide to deal with the economic issues
underlying STSDC use, or again attempt to moderate the negative effects of STSDC through
regulation, the existence of better private sector alternatives should make their jobs easier.
The focus of this paper is the most promising source of private sector alternatives to the
current STSDC system--the rapidly growing U.S. financial technology software (“FinTech”)
industry.17 We believe that innovative FinTech products have enormous potential to alter the
15Section 733 of the proposed Financial Choice Act of 2017, championed by House Financial
Services Committee Chairman Jeb Hensarling, contains a provision removing the CFPB’s
“rulemaking, enforcement or other authority with regard to payday loans, vehicle title loans or
other similar loans.”
16 Marte, Jonnelle. “There is a fierce tug of war over the future of the CFPB.”
Washingtonpost.com: Get There. 1/27/17]. Available at:
https://www.washingtonpost.com/news/get-there/wp/2017/01/27/there-is-a-fierce-tug-of-
war-over-the-future-of-this-federal-consumer-watchdog/?utm_term=.bf838f59414f
17 FinTech generally refers to technology-driven replacements for traditional financial services
products and services. These range from “blockchain” solutions for bank and asset manager
back offices to digital small business lending and a large variety of digital consumer financial
products. FinTech providers seek to offer consumers and businesses faster, less expensive,
easier to use and more satisfying ways to access needed financial services. Investment in
FinTech globally has been growing at a hectic pace, reaching $5.3 billion in the first quarter of
2016 alone, a 67 percent increase over the same period of the prior year.
https://newsroom.accenture.com/news/global-fintech-investment-growth-continues-in-2016-
driven-by-europe-and-asia-accenture-study-finds.htm. PWC estimates that cumulative
investment could exceed $150 billion in the next three years. PwC. Blurred lines: How FinTech
is shaping Financial Services. 2016. Available at:
http://www.pwc.com/gx/en/advisory-services/FinTech/pwc-fintech-global-report.pdf
1011
STSDC landscape and provide better alternatives for consumers. FinTech companies are
already designing market-based financial products to better address the short-term liquidity
needs of low-income working Americans and products for the larger consumer market that can
be adapted to the needs of low-income working people. Most FinTech innovation today is
created by “start-up” companies funded by venture capital investors, although banks and other
incumbent financial services providers are increasingly using their own resources to deliver
FinTech capabilities for their customers.18 While many of the FinTech companies we have
studied are small today, we believe that some have the potential to achieve meaningful scale.
In the pages that follow, we will seek to examine in more the causes of STSDC demand and the
shape of the current STSDC market, then evaluate emerging FinTech alternatives and assess
their potential to reduce or eliminate reliance on STSDC by low-income working families.
We conclude that vigorous adoption of a set of FinTech-centered alternatives to STSDC by
consumers and employers could shift low-income working families away from reliance on
STSDC over time and materially improve their financial resiliency and health, without the need
for government financial support or new laws or regulations. We believe that the FinTech
products we studied would be sufficient to manage a typical low-income working family’s real
monthly liquidity need and could eliminate need for use of STSDC by most or all of the 10.4
million low-income working families and their 47 million individual members.
We further conclude that the employer channel is the best vehicle for dissemination of FinTech
products for low-income working families because of its potential to reach very large numbers
of workers quickly with effective—and sometimes subsidized-- liquidity and financial
management solutions which also provide high value to employers through reduced employee
financial stress. It is our view that if employers included FinTech alternatives to STSDC in
employee benefit plans, they would not only help their employees manage their personal lives,
they would also reap substantial bottom-line benefits from improved employee engagement
and satisfaction, lower turnover and lower absenteeism.
We finish the paper by proposing a number of concrete steps that private sector and
government employers, FinTech and other financial companies, non-profits and government
can take to accelerate the adoption of these superior FinTech alternatives by low-income
working Americans.
For purposes of this study we focused on the needs and concerns one specific demographic
group--low-income Americans who are working in full or part-time jobs, or are participating
actively in so-called “gig economy” work through companies like Uber. This demographic is a
18The Pulse of Fintech – Q3 2016: Global Analysis of Fintech Venture Funding.
KPMG/CBInsights. 11/16/16. p. 29. Available at:
https://home.kpmg.com/xx/en/home/insights/2016/03/the-pulse-of-fintech-q1-2016.html
1112
heavy user of the short-term small-dollar credit products that are the focus of our work. We
are using the definition from the Working Poor Families Project’s 2013 paper entitled “Low
Income Working Families: the Growing Economic Gap”,19 which defines low-income working
families as those earning less than twice the federal poverty line. 20 In 2011, the low-
income threshold for a family of four with two children was $45,622 (it is slightly higher
today). The number of low-income working families in the United States totaled 10.4 million
and the total number of people in low-income working families totaled 47.5 million in 2011,
including 23.5 million children. In 2011, low-income working families made up 32% of all
American working families and 71% of those low-income families were classified as “working.”
In the study, families are classified as “working” if they are significantly attached to the labor
force (generally, those working at least 39 weeks during the previous year). Most of these
families have bank accounts. Many low-income families include more than one adult who is
19 Roberts, B, Povich, D. and Mather, M. Low-Income working Families: The Growing Economic
Gap. The Working Poor Families Project. 2012-2013. p. 9. Available at:
http://www.workingpoorfamilies.org/wp-content/uploads/2013/01/Winter-2012_2013-WPFP-
Data-Brief.pdf
20 Ibid. “The poverty line is adjusted annually for inflation and takes into account the number of
people in a family: The larger the family size, the higher the poverty line. In 2010, the poverty
line for a nonfarm family of four (two adults, two children) was $22,213. A four-person family
earning even one more dollar than $22,213 in 2010 was not officially poor, even though its
“extra” income hardly lifted it out of dire economic straits. Poverty experts have calculated a
no-frills budget that enables a family to meet its basic needs in food, clothing, shelter, and so
forth; this budget is about twice the poverty line. Families with incomes between the poverty
line and twice the poverty line (or twice poverty) are barely making ends meet, but they are not
considered officially poor. When we talk here about the poverty level, then, keep in mind that
we are talking only about official poverty and that there are many families and individuals living
in near poverty who have trouble meeting their basic needs, especially when they face
unusually high medical expenses, motor vehicle expenses, or the like. For this reason, many
analysts think families need incomes twice as high as the federal poverty level just to get by
(Wright, Chau, & Aratani, 2011).Wright, V. R., Chau, M., & Aratani, Y. (2011). Who are America’s
poor children? The official story. New York, NY: National Center for Children in Poverty. They
thus use twice-poverty data (i.e., family incomes below twice the poverty line) to provide a
more accurate understanding of how many Americans face serious financial difficulties, even if
they are not living in official poverty.” https://saylordotorg.github.io/text_social-problems-
continuity-and-change/s05-01-the-measurement-and-extent-of-.html
We note that all income-based poverty definitions are affected by the difference between
“spending poverty” and “income poverty.” Morduch, Jonathan and Schneider, Rachel. The
Financial Diaries—How American Families Cope in a World of Uncertainty. Princeton University
Press. 2017. PP. 163-165.
1213
responsible for meeting the household’s financial needs. In 2011, “about one-fourth of adults in
low-income working families were employed in just eight occupations, as cashiers, cooks,
health aids, janitors, maids, retail salespersons, waiters and waitresses, or drivers. Some of
these occupations— especially those involving health care—are among the fastest-growing
occupations in the country. Cashiers make up the single-largest occupational group, with nearly
a million people in low-income working families in 2011.“21
The Rise of Income Volatility
It has long been recognized that monthly expenses are particularly volatile for low-income
families, due not only to “emergencies” like car repairs and hospital payments but also to
regularly occurring but unanticipated monthly increases in multiple expense categories.22 In a
2015 study of bank customers by the JP Morgan Institute (JPMI), the average participant in the
bottom two income quintiles of the study experienced an expense increase of about 27% or
decrease of 25% in 6 out of 12 months of the year.23 Expense volatility of this magnitude would
be enormously challenging to manage at any income level.24
Other recent studies have shown that income volatility among low-income working families—
long presumed to be low-- is equally significant and in many ways more challenging to deal
with.25 The same JPMI study showed the average participant in the bottom two income
quintiles of the survey population experienced an income increase of between 11 and 14%,
respectively, or an income decrease of between 9% and 11% in half the months of the year.26
21 Ibid.
22 Morduch, Jonathan and Schneider, Rachel. “Mismatch: How Income and Expense Volatility
Are Undermining Households.” Stanford Social Innovation Review. 1/12/16. Available at:
https://ssir.org/articles/entry/mismatch_how_income_and_expense_volatility_are_undermini
ng_households
23 Farrell, D. and Greig, F. Weathering Volatility. p. 3.
24 Farrell, D. and Greig, F. Coping with Costs: Big Data on Expense Volatility and Medical
Payment.s JPMorgan Chase Institute. 2017. Available at:
https://www.jpmorganchase.com/corporate/institute/report-coping-with-costs.htm
25 Aspen Institute. Income Volatility: a Primer. Aspen Institute’s Financial Security Program:
Expanding Prosperity Impact Collaborative (EPIC). 2016. Available at:
https://www.aspeninstitute.org/publications/income-volatility-a-primer/
26 Farrell, D. and Greig, F. Weathering Volatility. p. 3.
1314
Even median income individuals in the study experienced fluctuations of nearly $500 in
monthly labor income across months.27
The leading cause for income variability cited by those surveyed by the Federal Reserve Board
was an irregular work schedule, followed by being paid through bonuses or commissions,
temporary unemployment, and seasonality of work. An irregular work schedule is cited almost
as much as all the other reasons combined28. Among the many reasons that low-income
working families are facing irregular hours are the increasing use of employee scheduling
software by employers,29 employer preference for part-time employees (who do not get
benefits) and the rise of the “gig economy” of independent contractors with no fixed work
schedules. The rising use of periodic performance bonus plans for hourly workers, which are
inherently unpredictable, has added another new element to income variability.30
The 2015 JPMI study also demonstrated that monthly and annual income and expense changes
did not move in tandem; there was only a slightly positive correlation between changes in
income and changes in expense on an annual basis regardless of income level. The study found
an even weaker positive relationship between month-to-month changes in income and month-
to-month changes in consumption, with a slope of 0.06 that does not explain even 1% of the
variance.31
JPMI’s study also indicated that consumers in the first two income quintiles would require
$1,600 and $2,800 in liquid savings to handle normal monthly income and expense fluctuations,
but had less than half of that amount available in transaction accounts at any given time.
This finding is consistent with other data that shows a general lack of savings or other sources
of cash to help with liquidity challenges. More than half of American households earning less
27 Ibid.
28 Consumer and Community Development Research Section of the Federal Reserve Board’s
Division of Consumer and Community Affairs. Report on the Economic Well-Being of U.S.
Households in 2015. p. 18.
29This software allows employers to fit work schedules to demand far more aggressively than in
the past and can produce significant variance in paycheck amounts. Mitchell, David S. Stable
and Predictable Scheduling as Antidote to Income Volatility. Aspen Institute’s Financial Security
Program: Expanding Prosperity Impact Collaborative (EPIC). 2017. p. 3. Available at:
https://assets.aspeninstitute.org/content/uploads/2017/02/Predictable-Schedling.pdf
30 Aspen Institute. Income Volatility: a Primer. p. 6.
31 Farrell, D. and Greig, F. Weathering Volatility. p. 8.
1415
than $40,000 annually are not saving anything from their income.32 Only 34% of American
households earning less than $40,000 could pay a $400 emergency expense with cash or a
credit card repaid within a month.33 Fully 45% of the working-age population has no retirement
savings account 34, and of those that do, 23% report dipping into their retirement accounts or
borrowing from the account to cover short-term needs despite the risk of punitive tax
treatment of early withdrawals.35 Only 21% of Americans in the lowest quartile have a
retirement account of any kind. 36And only 39% of the population has 3 months of expenses
saved to protect from the impact of job loss or short-term disability.37
For purposes of our study of FinTech alternatives to STSDC and for ease of comparison we will
simplify JP Morgan’s data and assume that the maximum amount of additional liquid financial
capacity that a low-income working family would need in order to fully deal with monthly
negative fluctuations in income and expenses is the range between $700 and $980. We
estimated the estimated maximum monthly amount of additional liquidity required by low-
income working families by using the JPMI 2015 analysis of the liquid assets needed to survive
the maximum concurrent monthly income and expense shock for the bottom two income
quintiles after deducting existing deposits ($1,000-$1,400.) We adjusted this amount downward
by 30% to take into account single month voluntary capacity of families to increase income or
32 Consumer and Community Development Research Section of the Federal Reserve Board’s
Division of Consumer and Community Affairs. Report on the Economic Well-Being of U.S.
Households in 2015. p. 25.
33 Ibid. p. 23.
34Rhee, Nari and Boive, Illana, The Continuing Retirement Savings Crisis, National Institute on
Retirement Security, March 2015, p.8
http://www.nirsonline.org/storage/nirs/documents/RSC%202015/final_rsc_2015.pdf
35 Lin, JT, Bumcrot, C., Ulicny, T, et. al. Financial Capability in the United States: 2016. FINRA
Investor Education Foundation. 2016. Available at: National Financial Capability Study
36Rhee, Nari and Boive, Illana, The Continuing Retirement Savings Crisis, National Institute on
Retirement Security, March 2015, p.10
http://www.nirsonline.org/storage/nirs/documents/RSC%202015/final_rsc_2015.pdf
37Consumer and Community Development Research Section of the Federal Reserve Board’s
Division of Consumer and Community Affairs. Report on the Economic Well-Being of U.S.
Households in 2014. Board of Governors of the Federal Reserve. 2014. pp. 2-3. Available at:
https://www.federalreserve.gov/econresdata/2014-economic-well-being-of-us-households-in-
2013-executive-summary.htm
1516
reduce or defer expenses.38 We created our range based on two family after-tax income levels--
$24,000 with a zero percent effective tax rate and $48,000 with a 20% effective tax rate.
Use of STSDC
In response to these liquidity pressures, many Americans—principally lower-income individuals-
-have turned to providers of various types of STSDC to help them handle variations in expenses
and income, pay bills and avoid the consequences of rent and utilities nonpayment. 39 These
easy to access but enormously expensive products have become essential financial
management tools for many lower-income working families.40
STSDC can be defined in various ways, but for purposes of this paper we will define it as
general-purpose credit (i.e., not tied to the purchase of a product such as a car or furniture)
with an original term of 9 months or less and in an amount of $2,000 or less. That definition
covers credit products that are generally referred to as payday lending, bank overdraft
protection, auto title lending, deposit advance and pawn loans and excludes products such as
longer-term subprime installment loans, subprime auto purchase loans, “rent-to-own”
contracts, point of sale finance, secured credit cards, as well as purchase money mortgages,
home equity loans and contracts for deed secured by residential real estate. While many of
these other credit products serve a similar customer base, they are distinct from STSDC in that
they are in most cases not useful, or used, by consumers to deal with the types of “day to day”
cash flow problems of the types described in this paper.41
38This assumption is generally consistent with research results showing average reductions of
between 11% and 17% of total monthly spending in reduced income months. Morduch, J., and
Schneider, R. The Financial Diaries.
39 Levy, R. and Sledge, J. A Complex Portrait: An Examination of Small-Dollar Credit Consumers.
Center for Financial Services Innovation. 2012. p. 6. Available at:
https://s3.amazonaws.com/cfsi-innovation-files/wp-content/uploads/2017/01/31163518/A-
Complex-Portrait-An-Examination-of-Small-Dollar-Credit-Consumers.pdf
40Pew Safe Small-Dollar Loans Research Project. Payday Lending in America: Who Borrows,
Where They Borrow, and Why. The Pew Charitable Trusts. 2012. pp. 14-18. Available at:
http://www.pewtrusts.org/~/media/legacy/uploadedfiles/pcs_assets/2012/pewpaydaylendingr
eportpdf.pdf
41There is a very strongly held view among some experts in this area that longer-term
installment lending is always the best alternative to STSDC. This view is based in part on the
idea that short-term loans with lump sum repayments, typical of STSDC are inherently
unaffordable and that borrowing on a longer-term basis with graduated and more affordable
terms is always better. The arguments for this view seem compelling. The typical payday loan
can take more than one-third of a borrower’s next paycheck and auto-title loans and deposit
1617
Perhaps the most important aspect of STSDC products is that they do not require the user to
have a good (or any) credit score. Thus, individuals with damaged credit from prior defaults or
individuals with little or no prior credit history (young people new to the work force and recent
immigrants, for example) can access these products.
A brief taxonomy of STSDC products follows below. Interested readers can access more detail
about these products through the sources cited in the footnotes.
Payday Lending. A payday loan is a fee-based cash advance, typically two weeks in term, repaid
in a single lump sum by post-dated check or ACH authorization out of the customer’s next
paycheck, or “rolled over” for an additional fee until a subsequent paycheck. These are also
sometimes also referred to as cash advance loans, check advance loans, post-dated check
loans, or deferred deposit loans.
Emerged in the 1990s42
20,000 payday loan storefronts, many online websites
$38 billion lent annually (counting renewals as new loans) to 19 million payday
loan customers43 who pay $9 billion per year in payday loan fees44
advance loans an even higher percentage, while long-term loans have much smaller monthly
payments. In addition, many STSDC products contain a so-called “leveraged” repayment
mechanism (e.g., an automatic draw on a bank account) which coerces the borrower into
rolling over the entire amount of the original loan and incurring additional fees. The Pew
Charitable Trusts, comment letter on CFPB’s Notice of Proposed Rulemaking for Payday, Vehicle
Title, and Certain High-Cost Installment Loans, Oct. 7, 2016,
https://www.regulations.gov/document?D=CFPB-2016-0025-142716.
However, the value of longer-term installment loans as a device to handle day-to-day liquidity
crises is, in the author’s view, limited when the frequency of household income/expense
volatility episodes that are the Key Precipitating Factors for STSDC Use (as defined later in this
paper) is so high—occuring in half the months of the year in the JPMI data cited elsewhere. It
appears impractical for consumers to finance these types of recurring short-term needs with
repeated long-term financing.
42“The Cash Advance Loans Industry – Overview.” Cashadvanceonline.net. [nd] Available at:
http://www.cashadvanceonline.net/cash-advance-loans-industry/
“A Short History of Payday Lending Law.” The Pew Trusts. 2012. Available at:
http://www.pewtrusts.org/en/research-and-analysis/analysis/2012/07/a-short-history-of-
payday-lending-law
1718
Payday borrowers typically spend over $520 in fees to repeatedly borrow $375
over several months45
“A typical two-week payday loan with a $15 per $100 fee equates to an annual
percentage rate (APR) of almost 400%”46
Loss rate of approximately 60% for established payday loan businesses47
Deposit Advance Products. An advance paid directly into a bank account and repaid in a lump
sum from the customer’s next direct deposit.
Linked to bank account
150% to 450% APR
$343 median daily balance48
Volumes are low as fewer banks are offering product due to regulatory
pressures49
43 About the Payday Advance Industry. Community Financial Services Association of America.
[nd] Available at:
http://cfsaa.com/about-the-payday-advance-industry.aspx
44 Other independent estimates of payday loan users are lower—The Pew Charitable Trusts a
estimate, based on actual unique borrowers in a year (i.e., not counting rollovers or repeated
borrowings) is closer to 12 million.
“Payday Loan Facts and the CFPB’s Impact” The Pew Trusts. 2016. Available at:
http://www.pewtrusts.org/en/research-and-analysis/fact-sheets/2016/01/payday-loan-facts-
and-the-cfpbs-impact
45 Ibid.
46 “What is a payday loan?” Consumer Financial Protection Bureau. [nd] Available at:
https://www.consumerfinance.gov/askcfpb/1567/what-payday-loan.html
47Flanner, Mark, and Samolyk, Katherine. “Scale Economies and Payday Loan Stores.”
Proceedings of the Federal Reserve Bank of Chicago’s 43rd Annual Conference on Bank Structure
and Competitiveness. (May 2017) pp.233-259. The high level of charge-offs is often masked by
industry-provided statistics that show low levels of defaults (e.g., 5%) on individual payday
loans. But when default rates are considered cumulatively for multi-loan rollovers the losses
can be ten times that rate.
48 Payday Loans and Deposit Advance Products: A White Paper of Initial Data Findings.
Consumer Financial Protection Bureau. 2013. p. 27. Available at:
http://files.consumerfinance.gov/f/201304_cfpb_payday-dap-whitepaper.pdf
1819
Bank Overdraft/Non-Sufficient Funds Protection (“bank overdraft protection”). A bank charges
a fee (typically $35 per occurrence) to cover each incident of non-sufficient funds on each item
(check, debit, ACH) drawn against a checking account. Most banks provide this service to
checking customers, but customers must “opt-in” to gain coverage for non-recurring debit card
transactions and ATM withdrawals.50
Bank overdraft protection fees make up over 2/3 total bank deposit account
fees, averaging $250 per year for customers using service
Forty-Two percent of customers incur over $300 per year in fees51
Eight percent of bank customers incur nearly 75 percent of all bank overdraft
protection fees52
70% of heavy overdrafters are employed and the average heavy overdrafter paid
nearly a full week’s worth of annual household income in bank overdraft
protection fees in the past year, and most people who expended a week of pay
made less than $25,000 annually53
Ten percent of millennials overdraft more than 10 times a year54
49 Douglas, Danielle, “Wells Fargo, U.S. Bank to end deposit advance loans, citing tougher
regulation. Washington Post. January 17, 2014. Available at:
https://www.washingtonpost.com/business/economy/wells-fargo-us-bank-to-end-payday-
loans-citing-tougher-regulation/2014/01/17/b65f0512-7f82-11e3-93c1-
0e888170b723_story.html?utm_term=.fef88e1c88f5
50Bank overdraft protection has traditionally not been considered a “loan” under the Truth in
Lending Act, 15 USC 1601 et seq. (TILA) and its implementing Federal Reserve Regulation Z, 12
CFR Part 226
51 Consumer Banking Project. Heavy Overdrafters: A Financial Profile. The Pew Charitable
Trusts. 2016. Available at:
http://www.pewtrusts.org/en/research-and-analysis/fact-sheets/2016/04/heavy-overdrafters
52 Bakker, T, Kelly, N., Leary, J. et. al. Data Point: Checking Account Overdraft. Consumer
Financial Protection Bureau. 2014. p. 5. Available at:
http://files.consumerfinance.gov/f/201407_cfpb_report_data-point_overdrafts.pdf
53 Consumer Banking Project. Heavy Overdrafters: A Financial Profile.
54Sullivan, Bob. “1 in 10 Millennials Overdraft More Than 10 Times a Year.” Credit.com.
1/22/15. Available at:
http://blog.credit.com/2015/01/1-in-10-millennials-overdraft-more-than-10-times-a-year-
106673/
1920
Banks with over $1 billion in assets charged customers $11.16 billion in bank
overdraft protection fees in 2015, accounting for 8.0% of profits. Small banks
also offer these products so the banking industry total is considerably larger.55
Total fees typically make up 2% or more of total bank revenue.56
Bank practices frequently maximize incidence of fees in the daily settlement
process by reordering transactions from large to small (thereby triggering an
initial overdraft with one of the larger checks and adding additional fees from
the smaller checks rather than paying most of the small checks before the
overdraft occurs), by charging individual fees for each overdraft and by charging
the same fee for all overdrafts regardless of size.
Put in lending terms, if a bank customer “borrows” $24 through an overdraft for
three days and pays an overdraft fee of $34, the theoretical APR on the “loan”
would be 17,000%.
Auto Title Loans. A small loan secured by the title to a car, truck, or motorcycle that the
borrower already owns. The lender holds the legal title to the vehicle in exchange for a loan
amount. If the loan is repaid, the title is returned to the borrower. If it is not repaid, the vehicle
may be repossessed and sold.57
55How a Set of Small Banks Compares on Overdraft: An analysis of programs, fees, and terms at
45 financial institutions. The Pew Charitable Trusts. 2016. p. 6. Available at:
http://www.pewtrusts.org/~/media/assets/2016/12/sm_overdraft_report_f.pdf
The Wall Street Journal has cited a much higher total industry figure: “So-called overdraft fees
totaled $33.3 billion in 2016, up about 2.5% from 2015 and by 5.4% from 2011, according to
Moebs Services Inc., an economic-research firm.” Andriotis, AnnaMaria and Rudegeair, Peter.
“Bank Overdraft Fee Revenue Bounces Back ” The Wall Street Journal. 3/16/17. Available at:
https://www.wsj.com/articles/bank-overdraft-fee-revenue-bounces-back-1489656603
56Andriotis and Rudegeair. “Banks Feel Pinch From Declining Overdraft Fees” The Wall Street
Journal. 6/16/15. Available at:
https://www.wsj.com/articles/banks-feel-pinch-from-declining-overdraft-fees-1434493786
57 Small-dollar Loans Project. Auto Title Loans: Market practices and borrowers’ experiences.
The Pew Charitable Trusts. 2015. pp. 3-4. Available at:
http://www.pewtrusts.org/~/media/assets/2015/03/autotitleloansreport.pdf;
2021
8,000 auto title loan storefronts, many websites
$1,000 average loan size
Single payment or short installment term
$3 billion in fees annually for $2+billion in auto title loans extended to more than
2 million customers
Typical APR of 300%
Pawn Loans. Small loans collateralized by personal items such as jewelry, watches, cameras
etc.58
$6 billion in revenues annually
10,000 pawn stores
$150 average pawn loan size, 1-4-month term, 20-25% per month, 15% default
rate
7.4% of population has used pawn loans
Not surprisingly, as lower quintile incomes have stagnated and income and expense volatility
have grown, the business of providing STSDC has become enormous and, by all accounts,
profitable, attracting many new entrants over the years.59
Why Do Consumers use STSDC?
According to research by the Center for Financial Services Innovation (CFSI), consumers use
STSDC principally to manage recurring expenses such as utility bills, rent, and food, which can
Consumer Financial Protection Bureau. CFPB Finds One-in-Five Auto Title Loan Borrowers Have
Vehicle Seized for Failing to Repay Debt. 2016. Available at:
https://www.consumerfinance.gov/about-us/newsroom/cfpb-finds-one-five-auto-title-loan-
borrowers-have-vehicle-seized-failing-repay-debt/
58 National Pawnbrokers Association. Pawn Industry Statistics. [2016.] Available at:
https://assets.nationalpawnbrokers.org/2016/05/PawnFacts.pdf
National Pawnbrokers Association. “Pawnbrokers Report Trends & Steady Industry Growth.”
Pawn Shops Today. [2015.] Available at: Available
at:https://www.pawnshopstoday.com/trends/
59 First Cash Express, a publicly traded STSDC company, has a market capitalization of around
$2.5 billion and an ROTCE of around 25% as of the date of this paper. See:
http://ir.firstcash.com/sec-filings
2122
be thought of as day-to-day household obligations.60 Approximately 42% of users of STDC
borrowed to pay utility bills, and 41% borrowed for general living expenses such as food and
clothing.61
CFSI’s research also confirmed prior findings showing that STSDC borrowers are generally less
educated, have lower incomes, and tend to live in larger households in the southern U.S. Many
users also report financial difficulties and indicate lack access to more traditional forms of
credit.62
The CFSI survey also revealed that most STSDC consumers (66%) had no personal savings to
look to as a source of cash flow assistance. Of those with savings, 45% still needed to use STSDC
after using all their savings and the other 55% (19% of all STSDC users) used some of their
savings or did not use their savings at all.63
CFSI’s research offers insights into the top reasons for the consumer’s funds shortage that
precipitated STSDC use. The top four reasons are noted below (respondents could give more
than one answer):
1. Timing Mismatch. Bill or payment due before paycheck arrived (38%)
2. Unexpected Expense. Unexpected expense (medical, car breakdown) (30%)
3. Unexpected Income Drop. Unexpected drop in income (lost job, hours cut, benefits cut)
(28%)
4. Negative Cash Flow. General living expenses consistently more than income (33%)
60 CFSI’s study differentiated between what it described as “STC” or short-term credit and
“VSTC” or very-short term credit. VSTC, as defined, is probably the closest analogue to the
definition of STSDC used in our study (although it excludes auto title lending because some auto
title loans have longer terms), but we have for purposes of this discussion treated both STC and
VSTC as equivalents to STSDC unless the context requires otherwise.
61 Levy, R. and Sledge, J. p. 12.
For a slightly different take, see: McKernan, S.M., Ratcliffe, C., and Quackenbush, C. Small
Dollar Credit: Consumer Needs and Challenges. Urban Institute. 2014. Available at:
http://www.urban.org/sites/default/files/publication/33716/413278-Small-Dollar-Credit-
Consumer-Needs-and-Industry-Challenges.PDF
62 Levy, R. and Sledge, J. p. 6.
63 Ibid.
22You can also read