Furniture & Fixture - An Overview - February 2020 - PACRA
←
→
Page content transcription
If your browser does not render page correctly, please read the page content below
Furniture & Fixture – An Overview

                             February 2020
Industry Dynamics
  Largely unstructured with numerous small to medium sized players.
  Regulatory structure supports local manufacturers.
  Lack of local raw material due to depleted forest cover.
  Increase in use of alternative materials such as plastic, chipboard and
  metal etc.
  Growing presence of online furniture stores.
  Largely labor intensive although some players have shifted towards
  automation
  Industry divided into Residential and Institutional customer segments
  Increasing demand from both individual and institutional customers
  Growing influence of E-commerce on the industry
Value Chain
   Design             Production         Logistics           Marketing          Services

                                                                    Logistics &
                                                                    Distribution
                                                                    • Retail Sale
                                   Production                       • Direct Sale ( Contractual )
                                   • Procurement of Raw             • Wholesale
                                     Materials
 Design                            • Grading, Seasoning,
 • Household/ Residential            Cutting, framing,
                                     assembly, metal shop,
 • Institutional Furniture           Upholstery, polishing
 • Product Design
 • Technical Specification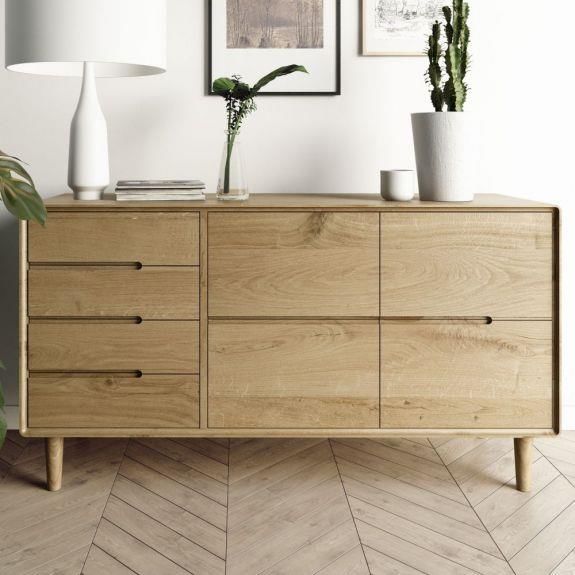
Production Process | Wooden
         Furniture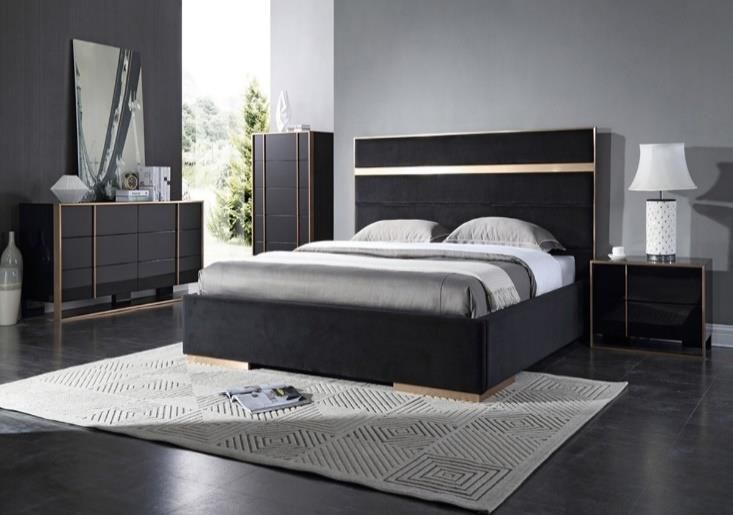
Segments
Residential                    Institutional
  Influenced by changes in       The government makes up a
  fashion and latest trends      significant portion of this
  Demand from individuals is     segment
  boosted by increase in         Demand from the
  disposable incomes and         government depends on
  changing lifestyle             annual budgets
                                 Other institutional
                                 customers include schools,
                                 hospitals and businesses
                                 Demand depends on overall
                                 business activity and
                                 economic growth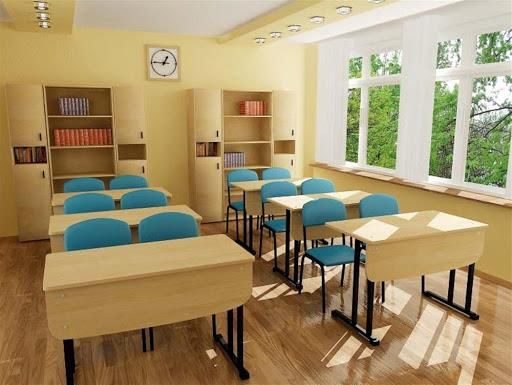
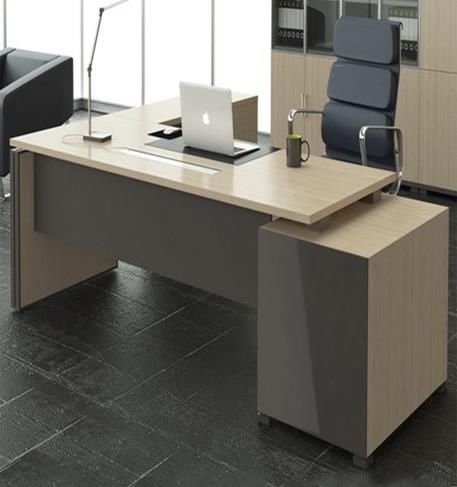
Types of Furniture
Residential                  Institutional

  Kitchen, Bedroom, Living     Office, Hotels, Hospitals
  Room and Dining Room         and Schools
  Beds, tables, chairs,        Desks, work stations,
  sofas, wardrobes, doors      chairs, cabinets, hospital
  etc.                         beds, doors etc.
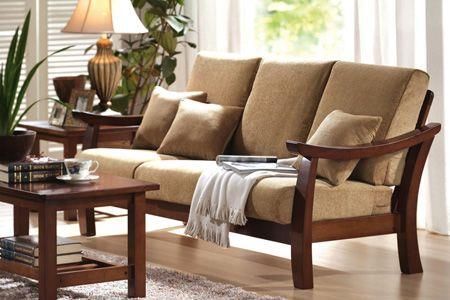
Material Used

Wood                Metal               Others

       Sheesham,
       Teak,                Stainless
       Rosewood,            Steel,
                                                 Plastic,
       Walnut,              Aluminum,
                                                 Cane
       Oak,                 Wrought
       Plywood,             Iron
       Keekar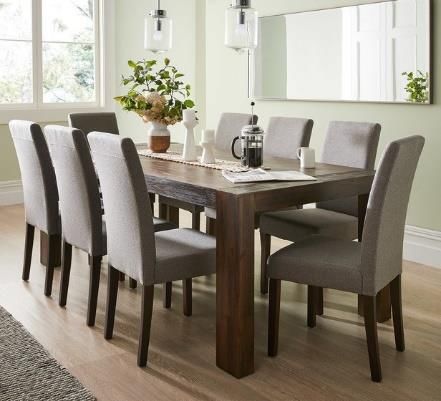
Global Dynamics
                  Exports                2012              2013             2014              2015              2016        2017     2018

           Total (mln USD)
                                        78,650           83,088            85,304            81,513            79,378       82,973   89,122

           CAGR
                                                            6%                4%                1%               0%          1%       2%

Source: Trade Map
HS Code: 9403 Furniture and parts thereof, n.e.s. (excluding seats and medical, surgical, dental or veterinary furniture)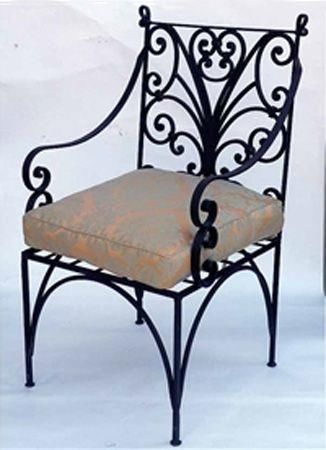
Industry | Fundamentals & Growth Drivers Furniture Industry Growth depends on: Population Growth Urbanization Increase in Disposable Income Economic growth rate & Business activity Budget allocation by government Key Statistics Pakistan is the fifth most populated country in the world with an estimated population of ~212 million The average population growth rate is ~2.4 % Population in the Urban Sector has grown at an average of ~1% Per Capita Income has grown by ~6.3% in FY17/18 Approximately ~2.7% of household income is spent on furnishing, household equipment and house maintenance. Source: Economic survey 2018-2019, Household Integrated Economic Survey (HIES) 2015 - 16
Industry Players

Some large players also offer online shopping facility through their websites.
E-commerce websites such as apnafurniture.pk, furniturehub.pk and
woodaction.com also offer competition to traditional furniture outlets.
Pakistan
The Country’s furniture exports stood at ~USD 4mln in CY18.
Declining trend in furniture exports due to inconsistent quality and lack of local raw material.
Highest level of exports to USA and UAE (~19% average)
USA is largest importer of furniture from Pakistan observed to have an increasing share in
exports jumping from ~10% in 2010 to ~27% in 2018.
Pakistan also exports to countries such as UK, China, Canada & Afghanistan.
Source: Trade Map
HS Code: 9403 Furniture and parts thereof, n.e.s. (excluding seats and medical, surgical, dental or veterinary furniture)Pakistan
Total Furniture imports have registered a CAGR of ~10%
~46% of Imports are from China
Pakistan also imports from countries such as Italy, Turkey and Germany
Imports from USA have seen an overall declining trend with a market share of ~14% in 2010 to
~1% in 2018
Source: Trade Map
HS Code: 9403 Furniture and parts thereof, n.e.s. (excluding seats and medical, surgical, dental or veterinary furniture)Pakistan’s Imports of Key Raw Materials
Wood sawn or
2014 2015 2016 2017 2018 Fiberboard of wood 2014 2015 2016 2017 2018
chipped etc
(HS Code: 4411)
(HS Code: 4407) -- '000 USD -- -- '000 USD --
United States of America 22,376 19,047 21,201 25,933 24,525 Malaysia 23,982 27,739 29,178 23,372 20,523
Germany 10,633 8,948 10,051 12,554 17,544 Sri Lanka 8,477 8,672 8,954 9,042 7,143
Canada 13,263 17,510 16,760 18,337 16,133 China 2,632 5,099 8,173 9,675 7,143
Austria 5,844 3,673 4,295 5,300 7,300 Thailand 2,848 4,492 6,355 5,937 5,561
Malaysia 5,120 5,978 6,739 5,884 5,941 Turkey 161 121 447 687 764
Rest of the World 18,466 18,386 23,230 25,246 33,371 Rest of the World 2,151 2,554 2,011 1,027 716
Total 75,702 73,542 82,276 93,254 104,814 Total 40,251 48,677 55,118 49,740 41,850
Plywood, veneered Sheets for veneering 2014 2015 2016 2017 2018
panel & laminated 2014 2015 2016 2017 2018
(HS Code: 4408)
wood -- '000 USD --
(HS Code: 4412) China 2,774 3,024 3,442 3,239 3,742
-- '000 USD --
China 2,891 5,511 6,913 8,812 6,390 United States of America 79 41 44 37 91
Russia - - - 38 125 Spain - 9 - - 81
Malaysia 185 132 100 144 55
United Arab Emirates 54 44 6 60 81
Turkey - - 2 14 50
Vietnam - - 15 11 38
Austria - - - 48 52
Rest of the World 210 291 486 456 157 Rest of the World 103 154 245 6,091 157
Total 3,286 5,934 7,516 9,475 6,815 Total 3,010 3,272 3,737 9,475 4,204
Boards of wood 2014 2015 2016 2017 2018
(HS Code: 4410)
-- '000 USD --
China 44 234 65 240 461
Thailand 935 166 1,050 423 337
Estonia 109 71 253 200 263
Malaysia 269 523 671 447 260
Germany 18 57 118 75 113
Rest of the World 95 173 215 323 114
Total 1,470 1,224 2,372 1,708 1,548
Total Raw 2014 2015 2016 2017 2018
Material Imports
(000 USD) 144,092 155,624 178,811 195,225 185,937
Source: Trade MapRegulatory Structure
Customs Tariff
2019 2018 2017
Description HS Code
Duty Duty Duty
Wood sawn or chipped lengthwise, sliced or peeled, whether or not planned,
sanded or end- jointed, of a thickness exceeding 6 mm 4407 3% 3% 3%
Sheets for veneering (including those obtained by slicing laminated wood), for
plywood or for similar laminated wood and other wood, sawn lengthwise, sliced
4408 11% 11% 16%
or peeled, whether or not planed, sanded, spliced or end- jointed, of a
thickness not exceeding 6 mm
Particle board, oriented strand board (OSB) and similar board (for example,
wafer board) of wood or other ligneous materials, whether or not agglomerated 4410 16% 16% 16%
with resins or other organic binding substances.
Fiberboard of wood or other ligneous materials, whether or not bonded with
resins or other organic substances 4411 11% - 16% 16% 16%
Plywood, veneered panels and similar laminated wood. 4412 20% 20% 20%
Paints and varnishes (including enamels and lacquers) based on synthetic
polymers or chemically modified natural polymers, dispersed or dissolved in a 3208 11%/20% 11%/20% 11%/20%
non- aqueous medium; solutions as defined in Note 4 to this Chapter
Other furniture and parts thereof 9403 45% 35% 20%
Seats (other than those of heading 94.02), whether or not convertible into
9401 3% - 35% 3% - 35% 3% - 35%
beds, and parts thereof
Sales Tax : 17%
The duty on imported furniture has been increased from 35% to 45% in October
2018
Sources: Pakistan Customs Tariff 2016-17; 2017-18 & 2018-19Opportunities Increasing population in urban areas leading to higher demand Growing disposable income of population Increasing E-commerce in the industry, providing opportunity to tap new customers and markets Regulatory duty structure provides support to local manufacturers Frequent changes in trends and fashion resulting in higher demand Higher automation to achieve consistent quality and efficiency gains
Threats
 Lack of local raw material due to depleted forest cover
 Inconsistent quality and lack of international quality certifications,
 making exports difficult
 Large proportion of unorganized sector in the industry, resulting in
 competitive disadvantage for organized sector
 High level of competition from unorganized players
 Slower economic growth hinders demand in both individual and
 institutional segments
 Restraint in expenditure by the government due to fiscal pressures
 Higher interest rates result in subdued demand from institutional
 clients on discretionary expenditures on refurbishments
Bibliography
1.      Trade Map https://www.trademap.org
2.      Pakistan Economic Survey 2018 – 19
3.      Household Integrated Economic Survey (HIES) 2015 – 16
4.      Pakistan Customs Tariff 2016-17; 2017-18 & 2018-19

     Analysts                                        Ateeb Riaz                                       Insia Raza
                                                     Supervising Senior                               Associate Analyst
                                                     +92 42 3586 9504                                 +92 42 3586 9504
                                                     Ateeb.riaz@pacra.com                             Insia.raza@pacra.com

                                                           DISCLAIMER
PACRA has used due care in preparation of this document. Our information has been obtained from sources we consider to be reliable but its accuracy or
completeness is not guaranteed. The information in this document may be copied or otherwise reproduced, in whole or in part, provided the source is duly
acknowledged. The presentation should not be relied upon as professional advice.
You can also read