FY 2021 BUDGET PRESENTATION to GREEN MOUNTAIN CARE BOARD

                    AUGUST 28, 2020
←
→
Page content transcription
If your browser does not render page correctly, please read the page content below

FY 2021 BUDGET PRESENTATION to GREEN MOUNTAIN CARE BOARD
AUGUST 28, 2020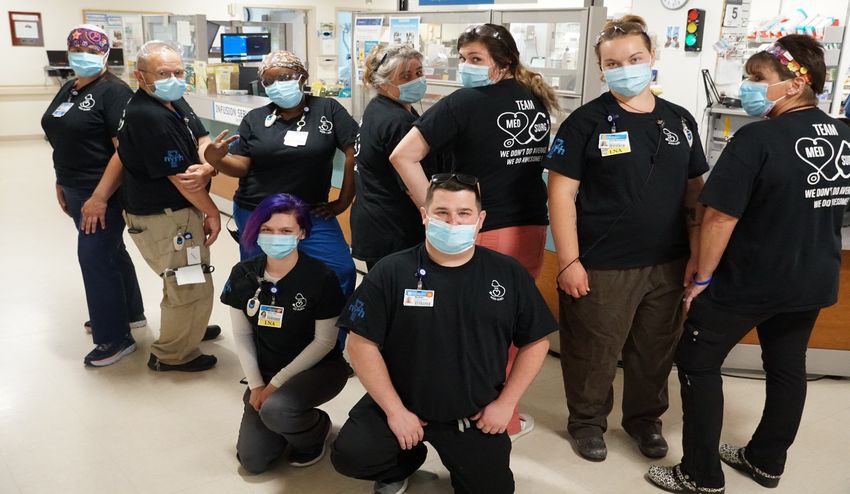
GMCB PRESENTATION FORMAT

                           2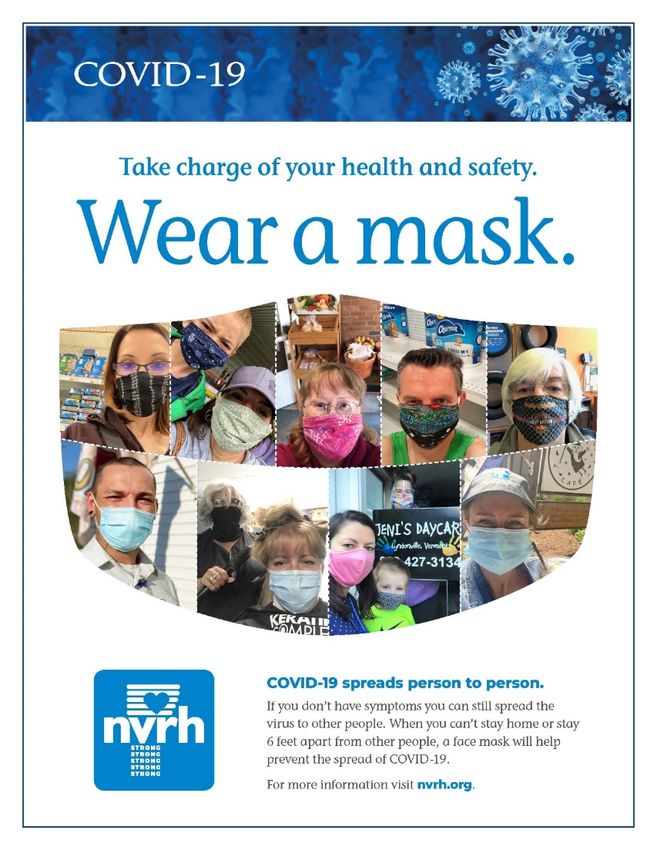
INTRODUCTIONS/OVERVIEW/VISION
NVRH Senior Leadership Team
     •   Shawn Burroughs, MBA - Shawn has been CIO since October 2017
     •   Betty Ann Gwatkin, MBA, SHRM-SCP - Betty Ann has been CHRO since April 1999
     •   Bob Hersey, MBA, FHFMA - Bob has been CFO since September 1999
     •   Laura Newell, MSHCA – Laura has been VP of Medical Practices Since January 2018
     •   Michael Rousse, MD – Dr. Rousse has been CMO Since February 2019. Dr. Rousse had been the VP of
         Medical Affairs since 2015
     •   Laural Ruggles, MPH, MBA – Laural has been VP of Community Health Improvement and Marketing since
         2002 and held various leadership positions at NVRH since 1995
     •   Julie Schneckenburger, MS, RN, CNOR – Julie has been CNO since July 2019. Julie had been our Director of
         Peri-Operative services since September 2013
     •   Colleen Sinon, RN, CPHRM – Colleen has been VP Quality Management Programs since 2005 and held
         various leadership positions at NVRH since 1996
     •   Shawn Tester, MSOL – Shawn has been CEO since November 2018
Overview
     •   Return to Profitability; $1,944,700 Operating Margin; 2% of Operating Revenue
     •   Assume No Pandemic-Related Interruption of Service Delivery
     •   Requesting 3.9% Charge Increase
     •   Covid-19 Pandemic Aftermath Will Continue to Affect Operations And Expenses
     •   Continued Focus on Reducing Avoidable Emergency Department Visits
Hospital Vision – To Be A Leader in Improving the Health of Our Community

                                                                                                              3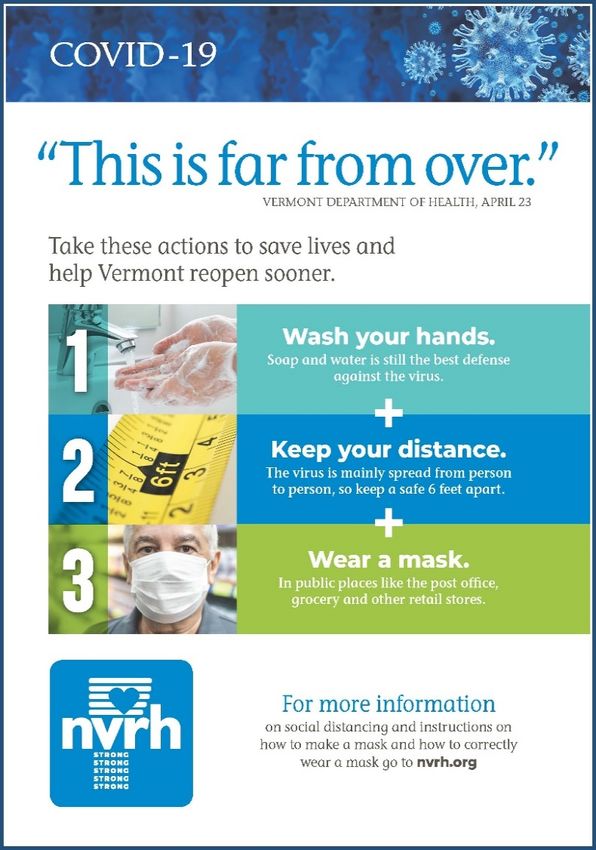
INTRODUCTORY REMARKS FROM OUR CEO

                               4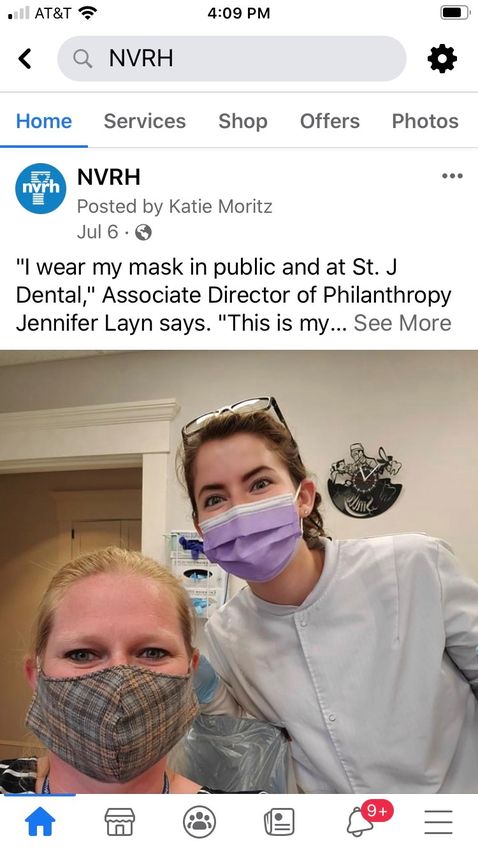
NVRH is a COMMUNITY LEADER DURING COVID-19
NVRH keeps the whole community connected around food, housing, physical
and mental health, and financial stability. NVRH is truly an anchor institution.
John Sayles, CEO, Vermont Foodbank

Having worked in many hospital systems over the years I continue to
experience a different kind of hospital system when we think of NVRH and it
is one of the greatest gifts in this gem of a region called the Northeast
Kingdom.
Meg Burmeister, Executive Director, NEK Council on Aging

NVRH helped lead the way in identifying housing options for homeless
populations that may need to be in isolation or quarantine. NVRH continues
to be a leader on the CSE Response Team and helps promote mask wearing.
Justin Barton-Caplin, Vermont Department of Health District Office Director

I truly believe the generosity of NVRH and your willingness to offer a helping
hand during the crisis allowed us to safely continue providing vital
transportation services to our community’s most vulnerable population.
Nick D'Agostino, Executive Director, RURAL COMMUNITY TRANSPORTATION, INC      .

                                                                                  5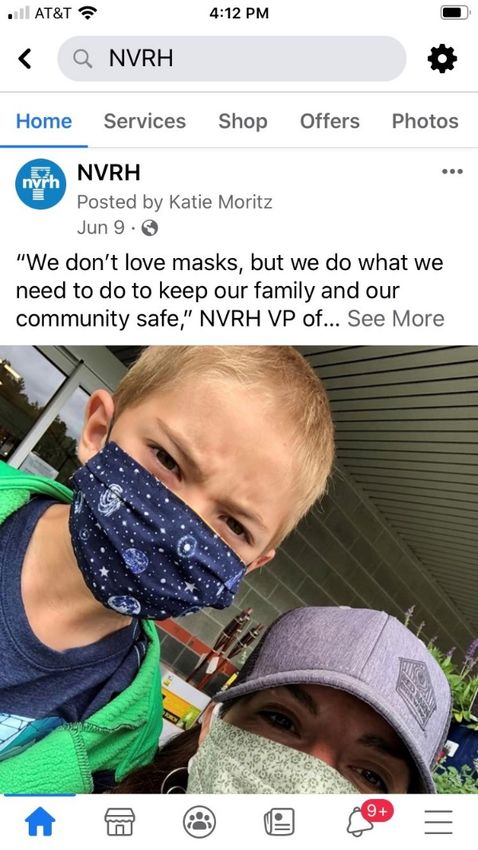
AND A STRONG COMMUNITY PARTNER                                                             NVRH been a fantastic overall partner to the
                                                                                           Vermont Foodbank in serving our neighbors –
NVRH has been amazing partner in making testing available in the                           coming through big time around Vermonters
region… partnering with VDH and allowed us to offer our Pop Up COVID                       Feeding Vermonters advocacy, getting Vermont-
Testing in the tent—thereby making a safer testing environment for our                     grown produce to people who could otherwise
staff and clients given the summer heat. Justin Barton-Caplin, Vermont Department          afford it. John Sayles, CEO, Vermont Foodbank
of Health District Office Director

                                             The Northeast Council on Aging
                                             would like to express our sincere
                                             thanks for the hospitals support
                                             during the COVID-19 pandemic
                                             and to be honest long before that
                                             time. The commitment to support
                                             community needs is continuously
                                             demonstrated and the last few
                                             months were no exception. Meg
                                             Burmeister, Executive Director, NEK Council
                                             on Aging

                                     NVRH reached out to me at the end of March to offer guidance and support to
                                     protect our drivers and clients. The offer was greatly appreciated because at the
                                     beginning of the pandemic, just as was the case with many organizations, RCT
                                     was unable to obtain PPE and sanitizing materials. Nick D'Agostino, Executive Director,
                                     RURAL COMMUNITY TRANSPORTATION, INC.

                                                                                                                               6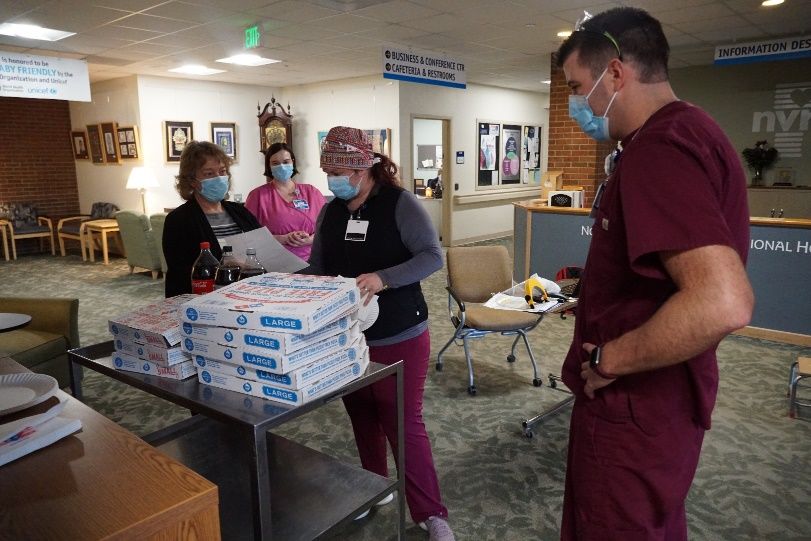
TAKING THE
  LEAD IN
COMMUNITY
MESSAGING

             7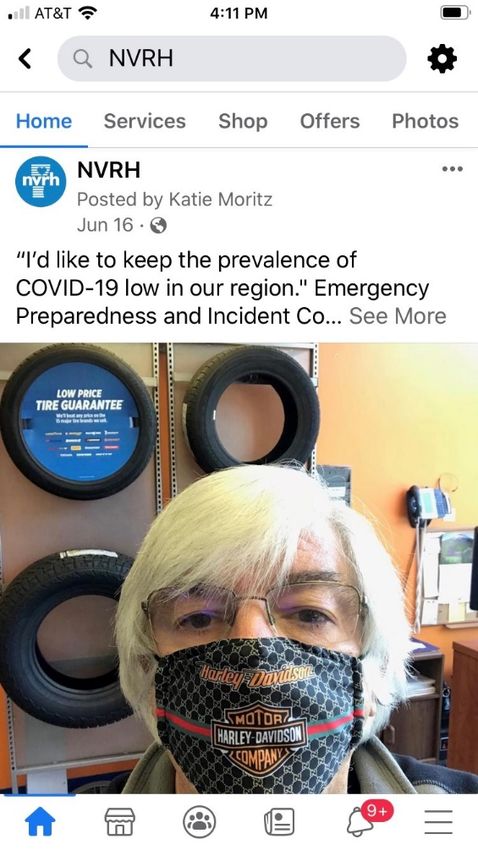
SOCIAL MEDIA WEAR A MASK CAMPAIGN

                                    8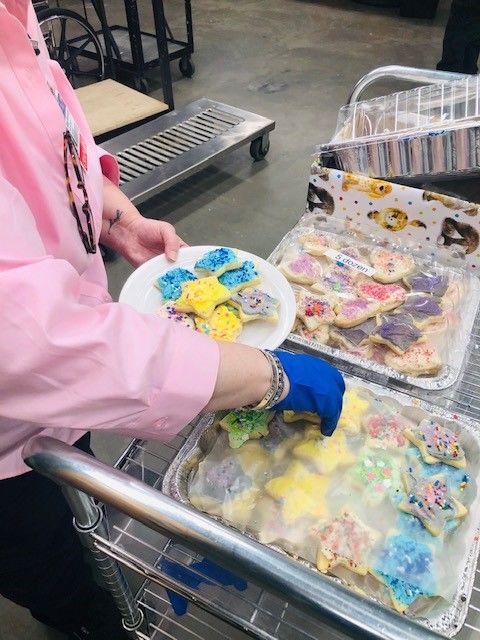
OVERWHELMING SUPPORT FROM OUR COMMUNITY

                                   9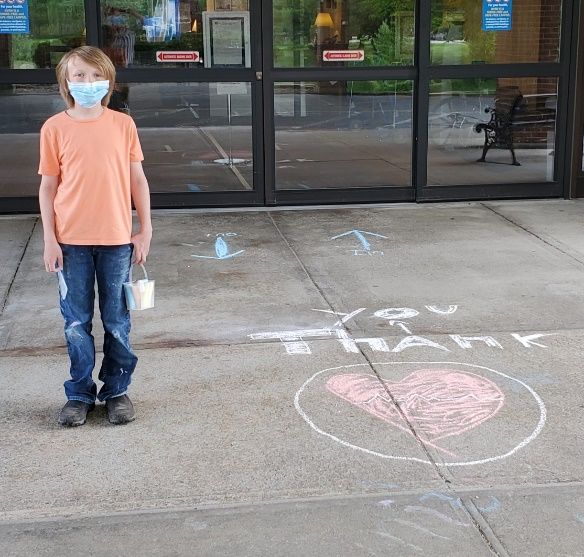
INCOME STATEMENT
                                                                      2019 A
                     INCOME STATEMENT                                               2020 B         2020 PROJ         2021 B

Revenues
Gross Patient Care Revenue                                           $177,779,611   $182,848,500   $159,987,600      $193,629,600
                             Disproportionate Share Payments             $959,185       $987,745       $994,685          $919,700
                    Graduate Medical Education (UVMMC only)                    $0             $0             $0                $0
                                                     Bad Debt         -$3,270,152    -$3,544,000    -$3,106,900       -$3,773,400
                                                     Free Care        -$3,141,595    -$3,365,750    -$2,494,300       -$3,014,000
                                     Deductions from Revenue         -$87,642,307   -$94,232,751   -$83,204,685     -$105,035,600
Net Patient Care Revenue                                              $84,684,742    $82,693,744    $72,176,400       $82,726,300
Fixed Prospective Payments, Reserves & Other
                                   Fixed Prospective Payments                  $0     $4,560,100     $6,663,200       $7,799,000
                                                      Reserves                                               $0
                                       Other Reform Payments                                                 $0
Fixed Prospective Payments, Reserves & Other                                   $0     $4,560,100     $6,663,200       $7,799,000
Total NPR & FPP                                                       $84,684,742    $87,253,844    $78,839,600      $90,525,300

                   COVID-19 Stimulus and Other Grant Funding                                         $7,192,000         $597,400
                                                            Other      $4,132,135     $4,668,400     $3,835,535       $4,310,000
Other Operating Revenue                                                $4,132,135     $4,668,400    $11,027,535       $4,907,400
Total Operating Revenue                                               $88,816,877    $91,922,244    $89,867,135      $95,432,700
Expenses
              Salaries, Fringe Benefits, Physician Fees, Contracts    $50,023,124    $56,616,953    $60,208,944      $62,771,420
                             Medical/Surgical Drugs and Supplies               $0             $0             $0               $0
                                         Health Care Provider Tax      $4,683,787     $5,065,000     $4,936,000       $4,700,000
                                       Depreciation/Amortization       $3,307,697     $3,965,000     $3,959,800       $3,110,000
                                  Interest - Short and Long Term        $247,716       $212,000       $233,700         $200,700

    Other Operating Expenses (includes ACO Participation Fees)        $28,927,360    $24,449,941    $21,713,191      $22,705,880
Operating Expense                                                     $87,189,684    $90,308,894    $91,051,635      $93,488,000

Net Operating Income                                                   $1,627,193     $1,613,350    -$1,184,500       $1,944,700

Non Operating Revenue                                                    -$37,567            $0                $0             $0

Excess (Deficit) of Rev over Exp                                       $1,589,626     $1,613,350    -$1,184,500       $1,944,700

                                                                                                                                    10
NPR/FPP & SUMMARY OF BUDGET REQUEST
INCOME STATEMENT 2019 A 2020 B 2020 PROJ 2021 B
Revenues
Gross Patient Care Revenue $177,779,611 $182,848,500 $159,987,600 $193,629,600
Disproportionate Share Payments $959,185 $987,745 $994,685 $919,700
Graduate Medical Education (UVMMC only) $0 $0 $0 $0
Bad Debt -$3,270,152 -$3,544,000 -$3,106,900 -$3,773,400
Free Care -$3,141,595 -$3,365,750 -$2,494,300 -$3,014,000
Deductions from Revenue -$87,642,307 -$94,232,751 -$83,204,685 -$105,035,600
Net Patient Care Revenue $84,684,742 $82,693,744 $72,176,400 $82,726,300
Fixed Prospective Payments, Reserves & Other
Fixed Prospective Payments $0 $4,560,100 $6,663,200 $7,799,000
Reserves $0
Other Reform Payments $0
Fixed Prospective Payments, Reserves & Other $0 $4,560,100 $6,663,200 $7,799,000
Total NPR & FPP $84,684,742 $87,253,844 $78,839,600 $90,525,300
• FY2020B TO FY2021B GROWTH = 3.7%
• 2.9% EXCLUDING NPR FOR HIGH COST INFUSION DRUG
• SOME NPR GROWTH FROM EXPANDING EXPRESS CARE AND # OF PCPS
• 3.9% CHARGE INCREASE
• 1.1% FOR ONGOING COVID-19 RELATED EXPENSE INCREASES NOT
COVERED BY GRANTS
• AFTER REVENUE AND EXPENSES SCRUTINIZED CAREFULLY 3.9%
REQUIRED TO ACHIEVE TARGETED OPERATING MARGIN
• PARTICIPATION IN OCV MEDICAID RISK PROGRAM
• $600,000 RESERVE FOR RISK SETTLEMENT
11CHANGE IN CHARGE REQUEST
Change in charge is the average change in price for services provided. Standard Request COVID-19
FY2018 FY2019 FY2020 FY2021
Approved % Change in Charge 3.2% 3.0% 3.0% n/a n/a
Commercial Approved % Change in Charge n/a n/a
Submitted % Change in Charge 4.3% 4.0% 3.5% 2.8% 1.1%
Commercial Submitted % Change in Charge
Hospital Inpatient Change in Gross Charges 2.8% 1.1%
Hospital Outpatient Change in Gross Charges 2.8% 1.1%
Professional Services Change in Gross Charges 0.0% 0.0%
Primary Care Change in Gross Charges 0.0% 0.0%
Specialty Care Change in Gross Charges 0.0% 0.0%
Skilled Nursing Facility Change in Gross Charge 0.0% 0.0%
Other (please specify)
Other (please specify)
Net Patient Revenue Change Due to Charge Request Dollar Value Value of 1% Charge Dollar Value Value of 1% Charge
Commercial $ 1,057,900 $ 377,700 $ 415,100 $ 377,700
Medicaid $ - $ - $ - $ -
Medicare $ - $ - $ - $ -
Total Change Due to Charge Request $ 1,057,900 $ - $ 415,100 $ -
12TRENDED CHARGE INCREASE %
0.05
0.045
0.04
0.035
0.03
0.025
0.02
0.015
0.01
0.005
0
FY 2017 FY 2018 FY 2019 FY 2020 FY 2021
Approved Rate Increase Requested Increase
13NPR/FPP REVENUE ASSUMPTIONS
• VOLUMES RETURN TO PRE-COVID LEVEL (MOSTLY)
• SMALL % STILL HESISTANT TO RETURN TO HOSPITAL
• TELEHEALTH VISITS WILL CONTINUE FOR SOME PATIENTS
• NO “PENT UP DEMAND” CATCHUP ASSUMED
• APPROVAL RECEIVED FOR 3.9% CHARGE INCREASE
• NO CHANGE TO COMMERCIAL PAYER DISCOUNTS
• NO CHANGE TO MEDICARE CAH PAYMENT RULES
• NO CHANGE IN MEDICAID FFS REIMBURSEMENT RATES
• NVRH WILL PARTICIPATE IN OCV MEDICAID RISK
• SLIGHT DECREASE IN UNCOMPENSATED CARE %
• $676K NPR GROWTH FY20B TO FY21B FOR ONE DRUG
14NPR/FPP TREND FY20B TO FY21B
FY 2020 Budget To FY 2020 Projected NPR/ FPP
FY2020B TO FY 2020P
• $7.2 MILLION NPR PANDEMIC “HIT”; 8.2% OF NPR
FY 2020 Approved Budget 87,253,800
• CAH STATUS PREVENTED LOSS FROM BEING GREATER
Covid Related Volume Decline (7,167,400)
• NO OPHTHALMOLOGY SERVICES FOR MOST OF YEAR
Other Utilization Changes (Incl. Ophthal) (1,687,400)
• NO AUDIOLOGIST FOR ENTIRE FISCAL YEAR
Acuity Increase (Infusion Therapy) 201,000
• LESS FAVORABLE PAYER MIX (incl. commercial shift)
Change Medicaid FFS & FPP Estimate (314,000)
• INFUSION DRUG $676,000 NPR ANNUAL IMPACT
Change in Bad Debts/Free Care 1,308,600
• UNCOMPENSATED CARE LOWER THAN EXPECTED
Shift in Payer Mix (755,000)
FY2020 Projected 78,839,600 FY2020P TO FY 2021P
• RATE INCREASE YIELDS $377,700 PER 1%
FY 2020 Projected To FY 2021 Budget • INCREMENTAL NPR FOR NEW INFUSION DRUG
NPR Change from Rate Increase 1,473,000 • MOST OF PRE-COVID VOLUME RETURNS
Acuity (Infusion Therapy) 475,000 • OTHER UTILIZATION CHANGES
• RETURN OF OPHTHALMOLOGIST
Pre-Covid Volume Recaptured 6,489,400
• RETURN OF AUDIOLOGIST
Other Utilization Changes (Incl. Ophthal) 3,248,300 • EXPANSION OF EXPRESS CARE SERVICE
• ADDITIONAL PRIMARY CARE PROVIDERS
FY 21 Budget 90,525,300
15OTHER OPERATING REVENUE
FY 2020 Budget To FY 2020 Projected OOR
FY2020 & FY2021 COVID-19 OOR
• FEDERAL STIMULUS =$6.4 million (received in FY20)
FY 2020 Approved Budget 4,668,400
• MEDICAID RETENTION = $.8 million (received in FY20)
Other Changes/Corrections (432,900)
• APPLYING FOR ADDITIONAL GRANTS FOR PANDEMIC
Covid Impact on 340B/Reference Lab (400,000) RELATED REVENUE AND EXPENSE CHANGES
• HHS PROVIDER RELIEF FUND GUIDELINES TO BE RELEASED
Stimulus Support 6,412,000 AUGUST 1TH
• ESTIMATING CONSERVATIVELY TO AVOID DUPLICATION
Medicaid Retainer Program 780,000
• ASSUME NVRH WILL RECEIVE an ADDITIONAL $579,400
FY2020 Projected 11,027,500
OTHER
FY 2020 Projected To FY 2021 Budget • FY2020B TO FY2020P
• LOWER PROVIDER PRACTICE NEGATIVELY
Back out FY20 Covid Support (7,192,900)
AFFECTED 340B AND REFERENCE LAB VOLUME
Add FY 21 Stimulus Support 597,400 • FY 2020 REFERENCE LAB BUDGET ERROR
Increase in 340B/Reference Lab 475,400 • FY2020P TO FY2021B
FY 21 Budget 4,907,400 • 340B AND REFERENCE LAB BACK TO “NORMAL”
• NO OTHER CHANGES ANTICIPATED
16EXPENSES TREND FY20B TO FY21B
FY 2020 Budget To FY 2020 Projected
Operating
Expenses
FY20B to FY20P
FY 2020 Approved Budget 90,308,900 • COVID EXPENSES FOR LAB TESTS, ENTERANCE
Covid Related Volume Decline (480,300) SCREENERS AND TESTING FACILITY STAFF
Expenses Added due to Covid 722,000
Other Utilization Changes (Incl. Ophthal) (200,000) • EARLY RETIREMENT TAKEN BY 22 EMPLOYEES
Acuity Increase (Infusion Therapy) 201,000 • NEED FOR TRAVERLERS CONTINUES DESPITE OUR
Other Expense Increases (incl travelers) 150,000 RECRUITMENT EFFORTS
Cost of Early Retirement Program 350,000
FY2020 Projected 91,051,600
FY 2020 Projected To FY 2021 Budget FY20P to FY21B
Acuity (Infusion Therapy) 475,000
Pre-Covid Volume Recaptured 480,300 • PANDEMIC RELATED EXPENSES WILL CONTINUE
Other Utilization Changes (Incl. Ophthal) 200,000 AFTER STATE OF EMERGENCY ENDS
Incremental Covid Related Expense Change 415,000
• SAVINGS ARE FROM 10 FTE REDUCTION,
Identified Cost Savings (625,000) MAXIMIZING 340B and SUPPLY CHAIN
Salary and General Inflation Increases 1,700,000 OPPORTUNITIES
Programmatic Change in Hospitalist Services 106,000
Increase in Traveler Expense 285,000 • MRI COSTS ARE CONSISTENT w/CON APPROVAL
MRI Lease and Service 250,000 • LOWER DEPRECIATION DUE TO CAPITAL SPENDING
Depreciation Expense Decrease (850,000) CUTS
FY 21 Budget 93,488,000
17FY20B TO FY21B EXPENSE SUMMARY
FY 2020 Approved Budget Expenses 90,308,900
Acuity Increase (Infusion Therapy) 676,000
Covid Related Expenses 1,137,000
Salary Increases 1,000,000
Inflationary Increases 700,000
Traveler Expenses 435,000
MRI Lease and Service 250,000
Programatic Change Hospitalist Service 106,000
Cost Savings (625,000)
Depreciation Expense Decrease (850,000)
Early Retirement Program Cost 350,000
FY 2021 BUDGET EXPENSES 93,488,000
18TRENDED OPERATING MARGIN
2,500,000 2.5%
2,000,000 2.0%
1,500,000 1.5%
1,000,000 1.0%
500,000 0.5%
- 0.0%
FY 2017 FY 2018 FY 2019 FY 2020 B FY 2020 P FY 2021
(500,000) -0.5%
(1,000,000) -1.0%
(1,500,000) -1.5%
Operating Margin Operating % Margin
19OPERATING MARGIN COMMENTS
• FY17-FY21 AVERAGE OPERATING MARGIN 1.2%
• ABLE TO WITHSTAND FY2O OPERATING LOSS &
MAINTAIN FINANCIAL HEALTH
• APPROVAL OF PRIOR YEAR BUDGETS AT OR NEAR
REQUESTED LEVELS IS A MAJOR FACTOR
• 2% MARGIN ANNUALLY IS MINIMUM NEEDED TO
SUPPORT FUTURE ED AND OTHER CAPITAL
PROJECTS
20BALANCE SHEET
2019 A
BALANCE SHEET 2020 B 2020 PROJ 2021 B
Cash & Investments $5,802,955 $8,607,300 $20,061,158 $7,867,007
Net Patient Accounts Receivable $9,251,739 $9,050,000 $7,635,000 $9,500,000
ACO Risk Reserve/Settlement Receivable $0 $0
Other Current Assets $4,096,242 $1,500,000 $3,861,758 $3,850,000
Current Assets $19,150,936 $19,157,300 $31,557,916 $21,217,007
Board Designated Assets $18,880,553 $18,424,000 $19,572,233 $19,572,233
Net, Property, Plant And Equipment $23,016,182 $26,252,600 $22,057,685 $22,852,685
Other Long-Term Assets $7,622,392 $7,426,600 $6,671,910 $6,326,406
Assets $68,670,063 $71,260,500 $79,859,744 $69,968,331
Accounts Payable $2,633,148 $4,200,000 $3,515,116 $2,604,116
Salaries, Wages And Payroll Taxes Payable $5,757,701 $5,500,000 $6,155,000 $7,175,000
ACO Risk Reserve/Settlement Payable $0 $0 $1,137,500 $1,737,500
COVID-19 Funding Short-Term Liabilities $11,666,113 $0
Other Current Liabilities $2,801,354 $4,844,700 $1,558,355 $1,608,355
Current Liabilities $11,192,203 $14,544,700 $24,032,084 $13,124,971
Long Term Liabilities $10,385,290 $11,832,000 $14,658,045 $13,728,045
Other Noncurrent Liabilities $4,737,451 $0
COVID-19 Funding Long-Term Liabilities $0 $0
Fund Balance $42,355,119 $44,883,800 $41,170,615 $43,115,315
Liabilities and Equities $68,670,063 $71,260,500 $79,860,744 $69,968,331
Balance Sheet Metrics
Days Cash on Hand 107.4 114.3 114.0 112.0
Days Cash on Hand-COVID-19 50.0 0.0
Debt Service Coverage Ratio 5.1 6.0 2.7 4.7
Long Term Debt to Capitalization 0.2 0.2 0.2 0.2
Days Payable 48.7 61.5 40.0 39.0
Days Receivable 39.9 39.9 33.0 38.0
21BALANCE SHEET COMMENTS
• REBUILDING BALANCE SHEET FOR FUTURE
PROJECTS
• CASH TO INVEST IN PROJECTS
• CAPITAL STRUCTURE RATIOS SUPPORT CAPACITY FOR
NEW LONG TERM DEBT ISSUANCE
• PAYROLL AP GROWTH FOR DELAYED FICA PAYMENTS
• COVID-19 LIABILITY WAS MEDICARE PAYMENT
ADVANCE
• FY2020 DSCR PROJECTED TO MET BOND COVENANT
22CASH FLOW
PROJECTED BUDGET TWO YEAR
SOURCES OF CASH FY 2020 FY 2021 TOTAL
OPERATING GAIN $ (1,184,500) $ 1,944,700 $ 760,200
CHANGE IN AR $ 1,784,871 $ (2,262,000) $ (477,129)
CHANGE IN AP $ 1,279,291 $ 109,000 $ 1,388,291
ADD: DEPRECIATION EXPENSE 3,959,800 3,110,000 7,069,800
ADD: PHILANTHROPIC CASH TRANSFER - 200,000 200,000
ADD: INTERNAL BORROWING - -
ADD: MCD / BCBS - COVID FUNDS 1,371,000 - 1,371,000
ADD: MCR ADVANCE 13,725,484 - 13,725,484
ADD: HHS STIMULUS 6,607,166 - 6,607,166
ADD: NET CHANGE ON INVESTMENTS 954,653 - 954,653
MISCELLANEOUS CHANGES (105,455) (138,738) (244,193)
TOTAL SOURCES OF CASH 28,392,310 2,962,962 31,355,272
USES OF CASH
DEBT PRINCIPAL PAYMENTS 568,000 871,000 1,439,000
CAPITAL BUDGET 3,890,437 2,818,000 6,708,437
REPAY MCR ADVANCE 3,431,371 10,294,113 13,725,484
REPAY COVID MCD / BCBC 587,000 587,000
BOOKED INTO INCOME HHS STIMULUS 6,607,166 6,607,166
-
TOTAL USES OF CASH 14,496,974 14,570,113 29,067,087
INCREASE (DECREASE CASH ) $ 13,895,336 $ (11,607,151) $ 2,288,185
23COVID-19 RELATED CASH FLOW
Budget Fiscal Year 2021 Budget Fiscal Year 2021 Budget Fiscal Year 2021
COVID-19 Related Hospital Revenue COVID-19 Related Hospital Revenue COVID-19 Related Hospital Revenue
Replacement Funding Sources FY20 Replacement Funding Sources FY20 Replacement Funding Sources FY20
Total Funding Sources Funding Sources to be Paid Back Funding Sources Not to be Paid Back
Funding Sources Amount % of Total Funding Sources Amount % of Total Funding Sources Amount % of Total
Medicare Advance Funding $ 13,725,484 63.2% Medicare Advance Funding $ 13,725,484 95.9% Medicare Advance Funding $ - 0.0%
State Funding - MCD $ 871,000 4.0% State Funding - MCD $ 87,100 0.6% State Funding - MCD $ 783,900 10.6%
Federal Funding - HHS Stimulus $ 6,607,166 30.4% Federal Funding - HHS Stimulus $ - 0.0% Federal Funding - HHS Stimulus $ 6,607,166 89.4%
BCBS Advance $ 500,000 2.3% BCBS Advance $ 500,000 3.5% BCBS Advance $ - 0.0%
Other (Please Specify) 0.0% Other (Please Specify) 0.0% Other (Please Specify) 0.0%
Other (Please Specify) 0.0% Other (Please Specify) 0.0% Other (Please Specify) 0.0%
Other (Please Specify) 0.0% Other (Please Specify) 0.0% Other (Please Specify) 0.0%
TOTAL: $ 21,703,650 100% TOTAL: $ 14,312,584 100% TOTAL: $ 7,391,066 100%
24COMMENTS ON CASH FLOW
• STEPS TAKEN IMMEDIATELY TO PRESERVE CASH
WHEN PANDEMIC HIT
• CAPITAL SPENDING STOPPED
• MEDICARE, BLUE CROSS ADVANCE SECURED
• DID NOT USE ANY MONEY
• LINE OF CREDIT INCREASED
• DID NOT TAP LOC
• APPLIED FOR AVAILABLE STIMULUS GRANT FUNDS
• A/R REDUCTION GENERATED ADDITIONAL CASH
25ADJUSTMENTS
• AN EXISTING INDEPENDENT COMMUNITY
PROVIDER PRACTICE MAY TRANSFER TO BE A
HOSPITAL-BASED PRACTICE. WE WILL KEEP THE
GMCB UPDATED AS MORE INFORMATION
BECOMES AVAILABLE.
• THERE WERE NO ADJUSTMENTS RELATED TO ANY
CHANGES IN ACCOUNTING PRACTICES
26SERVICE LINE ADJUSTMENTS
• WE BELIEVE THE SERVICES NVRH OFFERS ARE
NECESSARY AND APPROPRIATE FOR OUR PATIENTS
AND THE COMMUNITIES WE SERVE. THEREFORE,
NVRH DOES NOT HAVE ANY PLANS TO ADD OR
REDUCE SERVICE LINES.
27•
RISKS
Meeting staffing needs while supporting our workforce that is balancing childcare, teaching
at home and work schedules
o Includes funding for “travelers” staff that may be needed to supplement NVRH staff
• Another surge in Covid requiring shutdown of services
o Includes salary and non-salary expenses for virus testing facility to quickly identify
member of the community that are Covid-19 positive
o Includes salary and non-salary expenses for screening and monitoring all patients and
visitors that may be at risk for carrying the virus before entering the hospital
• Inability to recruit or retain key staff
o There were already 19 nursing position vacancies before pandemic
o Travel restrictions inhibit our ability to recruit health care workers
Includes salary increases to remain competitive in labor market
Includes competitive fringe benefits including re-instated loan repayment
program
Include recruitment related expenses
• OCV Medicaid program (and potentially an opportunity)
o Includes revenues, expenses and risk associated for the OCV Medicaid risk program
o FY 2020 results may be better than estimated resulting in favorable budget
adjustment in FY 2021 (opportunity)
• Insufficient capital to fund much-needed and overdue ED facility improvement project
o Scaled back capital spending in FY 20 and FY 21
o Secured 0% financing for information system infrastructure replacement project
• Long term economic impact on the communities we serve
o Includes financial support for NEK Prosper, Caledonia and S. Essex Accountable
Health Community, and its Financially Secure Collaborative Action Network
o Includes an anticipated increase in Medicaid payer mix
• De-stabilization of our partner organizations due to pandemic, resulting in greater
social/mental health needs
• Inability of supply chain to procure sufficient quantity of PPE to safely treat patients
o Includes anticipated future price increases
o Includes costs of alternative PPE products where applicable
28OPPORTUNITIES
• Continue focus on identifying operational efficiencies and supply chain management to drive
down costs
o Includes reduction of 10 FTEs
o Includes savings for switching to primary vendor products and 340B pricing
• Explore possible collaborations with new and existing partners to meet community needs
o Discussions underway. May result in budget adjustment for practice transfer
• Take advantage of alternative ways to deliver services, where appropriate (e.g. Telehealth)
o Provider practice visits include telehealth visits
• Pandemic enhanced image in the community as strong organization that is able to respond
to most any challenge. We plan to leverage this goodwill to further develop our already-
strong community support, in efforts to improve the health of the community.
• Partner with NVU and VTC to train future health care workers
o Includes ongoing support to college programs
• Better meet needs of mental health and SUD population with focus on prevention,
intervention and recovery
• Leveraging OCV data and improving analytic capabilities to drive care coordination and
patient risk assessment
• Capitalizing on value based payment flexibility to be innovative in the service industry
29CAPITAL BUDGET PLANS
• SPENDING PLANS DELAYED 1 ½ YEARS
• SCALED BACK FY 2020 AND FY 2021 SPENDING
• REPLACEMENT OF ALL INFORMATION SYSTEM
SERVERS AND NETWORKING EQUIPMENT
• $2.4 MILLION TOTAL
• INTEREST FREE FINANCING OVER 42 MONTHS
• PLANNING PROCESS FOR MUCH NEEDED ED
EXPANSION PROJECT RE-STARTING IN FY 21,
INCLUDING REVIEW OF PROJECT SCOPE
30You can also read