FY2021 Q3 Investment Reports
←
→
Page content transcription
If your browser does not render page correctly, please read the page content below
FAC Agenda Item 3b

                           FY2021 Q3 Investment Reports
BACKGROUND

The Oregon State University (university) investment reports for the third quarter (Q3, January 1
– March 31, 2021) of fiscal year (FY) 2021 are presented in the following four sections:
   • FY2021 Q3 Public University Fund Investment Report – This section includes a
      report on the investments of the Public University Fund (PUF) for the third quarter of
      FY2021. The PUF is an investment pool that is administered by the university on behalf
      of all Oregon public university participants, pursuant to legislation adopted by the 2014
      Legislature. The PUF holds assets of the following participating Oregon public
      universities: Eastern Oregon University, Oregon Institute of Technology, Oregon State
      University, Portland State University, Southern Oregon University, and Western Oregon
      University.
   • FY2021 Q3 Oregon State University Investment Report – This section includes a
      report on the investments of the operating and endowment assets of the university. This
      report reflects the university’s operating assets and general revenue bond proceeds
      invested with multiple managers, the university’s endowment and quasi-endowment
      investments managed by the Oregon State University Foundation, the land held as
      separately invested endowments, and the land grant endowment that is invested in the
      PUF.
   • FY2021 Q3 Oregon State University Report on Unspent General Revenue Bond
      Proceeds – This section provides a summary of unspent revenue bond proceeds as of
      March 31, 2021.
   •   FY2021 Q3 Market Background – This section provides a general discussion of the
       investment markets and related performance information during the third quarter of
       FY2021.

FY2021 Q3 PUBLIC UNIVERSITY FUND INVESTMENT REPORT
(Prepared by the Public University Fund Administrator)

Performance

The PUF declined 0.1% for the quarter and gained 0.9% for the fiscal-year-to-date period ended
March 31, 2021. The PUF’s three-year and five-year average returns were 3.5% and 2.6%,
respectively.

The Oregon Short-Term Fund (OSTF) returned 0.2% for the quarter and 0.6% fiscal year-to-
date, outperforming its benchmark by 20 and 50 basis points, respectively. The Core Bond Fund
returned -0.7% for the quarter and 1.5% fiscal year-to-date, outperforming its benchmark by 70
and 210 basis points, respectively

In April, Oregon State Treasury fixed income investment officers, Will Hampson and John
Lutkehaus, conducted a quarterly performance review with university staff. The Core Bond
Fund’s relative overweight in corporate bonds (10% points) and underweight in U.S.
Government Treasuries (40% points) contributed to the portfolio’s 70 basis point relative
outperformance versus the benchmark during the quarter. Corporate bonds were favored by
investors during the period as the U.S. economic recovery gained momentum. Following

                        May 20 – 21, 2021 Board of Trustees Meetings

Finance & Administration Committee                                                       Page 1
FAC Agenda Item 3b
changes to the investment policy approved in January 2021, the investment officers began
purchasing high quality floating rate notes and collateralized loan obligations in the Core Bond
Fund. Securities from both sectors are currently offering higher yields compared to traditional
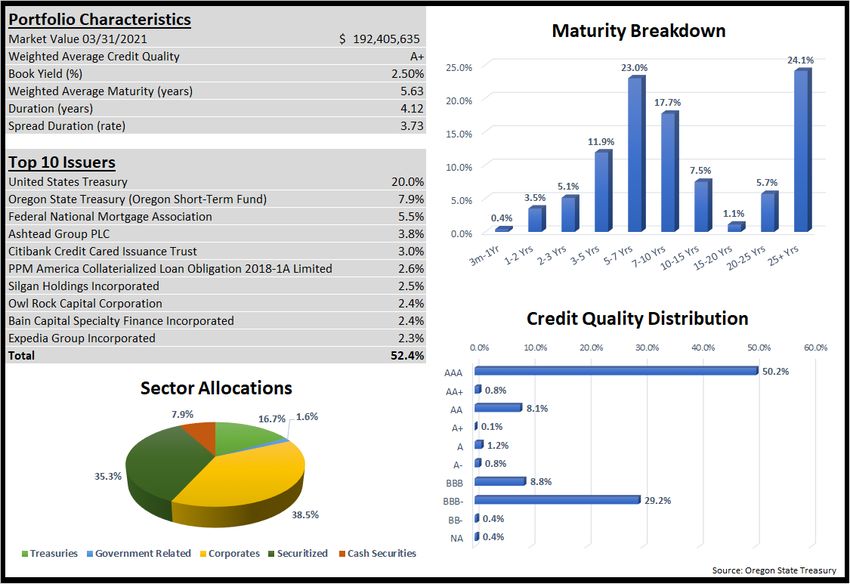
government-backed securities. The Core Bond Fund’s book yield, as of March 31, 2021, was
2.5%.
Public University Fund Performance
Quarter Current Prior 3- 5-
Asset
Ended Fiscal Fiscal Year Year Market Value Policy
Allocation
03-31-21 YTD YTD Avg. Avg.
$100
Oregon Short–
million
Term Fund 0.2% 0.6% 1.8% 2.0% 1.7% $439,116,174 69.5%
minimum¹
Benchmark - 91-day
0.0% 0.1% 1.6% 1.5% 1.2%
T-Bill
PUF Core Bond
-0.7% 1.5% 4.5% 4.8% N/A $192,405,635 30.5%
Fund
Benchmark ² -1.4% -0.6% 4.7% 4.4% 2.7%
PUF Total Return -0.1% 0.9% 3.1% 3.5% 2.6% $631,521,809 100.0%
PUF Investment
0.3% 1.5% 2.1% 2.7% 2.3%
Yield
¹ The PUF policy guidelines define investment allocation targets based upon total participant dollars committed. Core balances in
excess of liquidity requirements for the participants are available for investment in the Core Bond Fund. Maximum core investment
allocations are determined based upon anticipated average cash balances for all participants during the fiscal year.
² Benchmark is 100% Bloomberg Barclay’s Intermediate U.S. Gov’t/Credit Index as of February 1, 2021. From April 1, 2017 to
January 31, 2021, the benchmark was 75% Bloomberg Barclay’s Aggregate 3-5 Years Index, 25% Bloomberg Barclay’s Aggregate
5-7 Years Index.
A description of each investment pool’s portfolio characteristics and market exposures is
included in Attachment 1 of this report.
Investment Income and Participant Ownership
During the quarter, investment earnings distributed to the participants totaled $1,997,349
Earnings Market Value as %
Distribution ¹ of 03/31/2021 Ownership
Portland State University $ 778,367 $ 253,482,417 40.1%
Oregon State University ² 810,580 252,335,163 40.0%
Western Oregon University 120,235 40,265,470 6.4%
Oregon Institute of Technology 114,133 35,340,215 5.6%
Eastern Oregon University 101,967 30,581,457 4.8%
Southern Oregon University 72,067 19,517,087 3.1%
Grand Total $1,997,349 $ 631,521,809 100.0%
¹The earnings available for distribution to participants were earned during the months of December 2020 through February 2021 and
distributed to participants in March 2021. Earnings are distributed to participants based upon average cash and investment balances
on deposit during the same period, which differs from the total market value at the end of the quarter.
²As of March 31, 2021, Oregon State University’s total PUF market value consisted of operating assets, valued at $252,004,163,
and the land grant endowment, valued at $331,000.
May 20 – 21, 2021 Board of Trustees Meetings
Finance & Administration Committee Page 2FAC Agenda Item 3b
FY2021 Q3 OREGON STATE UNIVERSITY INVESTMENT REPORT
The schedule of Oregon State University’s investments is shown in the following investment
summary.
Public University Fund Performance
Oregon State University’s operating assets and the land grant endowment are invested in the
Public University Fund (PUF). The report on the investment performance of the PUF, provided
in the separate section above, shows the PUF declined 0.1% for the third fiscal quarter ended
March 31, 2021.
OSU Unspent Bond Proceeds Performance
The report on the investment performance of the unspent bond proceeds, provided in the table
below, shows the funds invested in the Oregon Short-Term Fund gained 0.2%. The liquidity
and short-duration portfolios, managed by RBC Global Asset Management, were unchanged
and down 0.1%, respectively, for the period. The total market value of the unspent bond
proceeds as of March 31, 2021 was $425,818,550, including $15,042,244 on deposit in
university operating bank accounts.
OSU Endowment Asset Performance
The OSU Endowment Assets, including those managed by the OSU Foundation, increased
4.3% for the quarter and 22.1% fiscal year-to-date. The three-year average return was 11.0%.
The total market value of the OSU endowment assets as of March 31, 2021, was $63,629,812.
The OSU Foundation, pursuant to an investment management contract, is managing the
majority of the university’s endowment assets. The OSU Foundation’s Endowment Pool
increased 4.9% for the quarter and 25.7% fiscal year-to-date. The investment pool outperformed
its benchmark by 220 basis points for the quarter and 210 basis points fiscal year-to-date. The
three-year average return was 11.0%.
May 20 – 21, 2021 Board of Trustees Meetings
Finance & Administration Committee Page 3FAC Agenda Item 3b
May 20 – 21, 2021 Board of Trustees Meetings
Finance & Administration Committee Page 4FAC Agenda Item 3b
May 20 – 21, 2021 Board of Trustees Meetings
Finance & Administration Committee Page 5FAC Agenda Item 3b
FY2021 Q3 OREGON STATE UNIVERSITY REPORT ON UNSPENT GENERAL REVENUE
BOND PROCEEDS
The schedule of Oregon State University’s unspent revenue bond proceeds as of March 31,
2021, is shown in the summary below.
Unspent Revenue Bond Proceeds1
Issuance Year 2015 2 2016 3 2017 4 2019 2020 Total 5
Unspent
Revenue Bond
$ 66,022 $ 787,165 $ 54,173,783 $ 70,609,918 $299,962,713 $ 425,599,601
Proceeds
Allocated 6 $ 66,022 $ 787,165 $ 54,173,783 $ 48,728,586 $ 86,662,713 $ 190,418,269
Unallocated 7 $ - $ - $ - $ 21,881,332 $ 213,300,000 $ 235,181,332
1 Reported based on book value and does not include $123,471 unrealized gains or $95,478 investment earnings not
yet distributed.
2 Space Improvement Projects are forecasted to be fully expended in FY2021.
3 Primarily taxable funds allocated to IT Systems Infrastructure project (Link Oregon).
4 Proceeds use approved June 2017.
5 Balance represents unspent revenue bond proceeds as of March 31, 2021, including $15,042,244 of proceeds
invested in operating bank accounts.
6 Allocated proceeds are proceeds committed to specific projects that have Stage Gate 2 approval by the Board.
7 Unallocated proceeds have not yet been committed to specific capital projects approved by the Board.
FY2021 Q3 MARKET BACKGROUND
(Prepared by USSE and Meketa Investment Group, consultants to the Oregon Investment
Council)
Report on Investments – as of March 31, 2021
Economic and Market Update
Markets continue to digest incremental positive economic news in most regions of the world as
economies slowly reopen and distribute vaccines. The economic recovery after COVID-19 has
persisted. Market participants continue to pay close attention to the new U.S. administration’s
policy agenda, which is still materializing. The Biden administration’s approach to the regulation
of large tech companies and corporate/individual taxation is worth continued close attention
going forward. In the short-term, focus remains on the $1.9 trillion fiscal package and the
potential for additional fiscal spending on infrastructure. In February, yields on U.S. Treasuries
rose rapidly on higher growth and inflation expectations as economic data on unemployment,
manufacturing, services, and demand (retail sales, construction, incomes) came in better than
expected and given the likely additional fiscal stimulus. Equity markets stalled as they repriced
and rotated out of growth / tech stocks into value / recovery stocks in light of the advancing
yields. Generally, growth stocks are expected to generate more of their cash flows further into
May 20 – 21, 2021 Board of Trustees Meetings
Finance & Administration Committee Page 6FAC Agenda Item 3b
the future than value stocks; when interest rates rise, those cash flows receive a larger discount,
reducing their present value.
The conditions that were in place to begin the year are holding steady with strong policy support
in the U.S., vaccine deployment trending positively, and economic data remaining resilient. The
continued accommodative policy by the Federal Reserve and another round of fiscal stimulus
further boosted investor sentiment, supporting a positive 6.2% total return by the S&P 500
during the period.
Market Returns1
March 31, 2021
1
Source: Oregon State Treasury
YTD returns are computed on a calendar year basis.
The yield curve continued its steepening trend as rates on the 10-year Treasury surpassed
1.70%, driving bond prices lower. The Bloomberg Barclay’s Aggregate Bond Index declined
3.4% during the period, as long-dated U.S. Treasuries declined over 13%. While investors have
expressed concerns about the persistence of rising inflation, the Federal Reserve’s Jerome
Powell sought to allay inflation fears by saying overnight rates will remain in the zero-lower
bound through 2023.
RECOMMENDATION
Staff recommend the Finance & Administration Committee accept the FY2021 Q3 Public
University Fund Investment Report and the FY2021 Q3 Oregon State University Investment
Report.
May 20 – 21, 2021 Board of Trustees Meetings
Finance & Administration Committee Page 7FAC Agenda Item 3b - Attachment 1
Oregon Short Term Fund March 31, 2021
May 20 – 21, 2021 Board of Trustees Meetings
Finance & Administration Committee Page 8FAC Agenda Item 3b - Attachment 1
Core Bond Fund March 31, 2021
May 20 – 21, 2021 Board of Trustees Meetings
Finance & Administration Committee Page 9You can also read