GOMONROVIA UPDATE CITY COUNCIL STUDY SESSION JULY 17, 2018
←
→
Page content transcription
If your browser does not render page correctly, please read the page content below
GoMonrovia Update
City Council Study Session
       July 17, 2018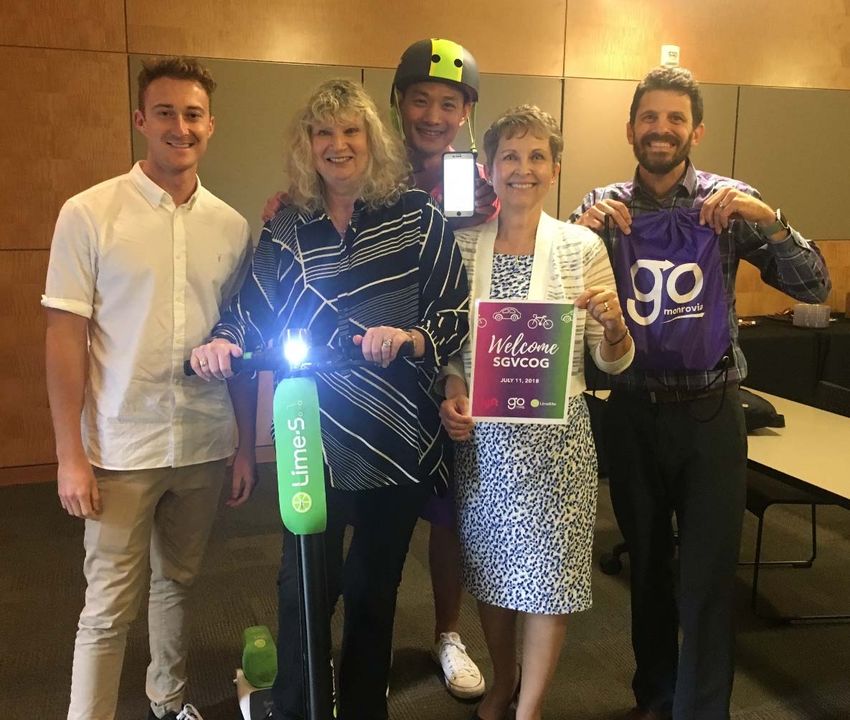
GOMONROVIA PROGRAM OVERVIEW
Pilot Program Development & Launch
   ▪ Agreements with both Lyft and LimeBike approved by
      City Council on February 20, 2018
   ▪ Rolled out marketing program in February ‐ March 2018
   ▪ Launched program on March 17, 2018
Study Session Goals
   ▪ Review overall GoMonrovia program performance &
     budget
   ▪ Council provide direction on potential program
     modifications
   ▪ Staff to bring back amendments on August 7, 2018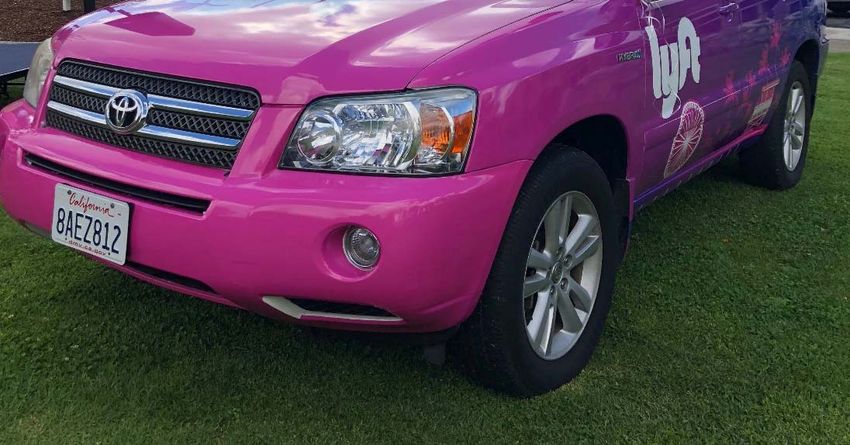
GOMONROVIA IS THE TALK OF THE REGION…
                   AND BEYOND!!
 SGVCOG SPECIAL GOMONROVIA         SCAG CONFERENCE – MAY 3, 2018 – INDIAN WELLS, CA
REGIONAL MEETING ‐ JULY 11, 2018
GOMONROVIA IS THE TALK OF THE REGION…
          AND BEYOND!!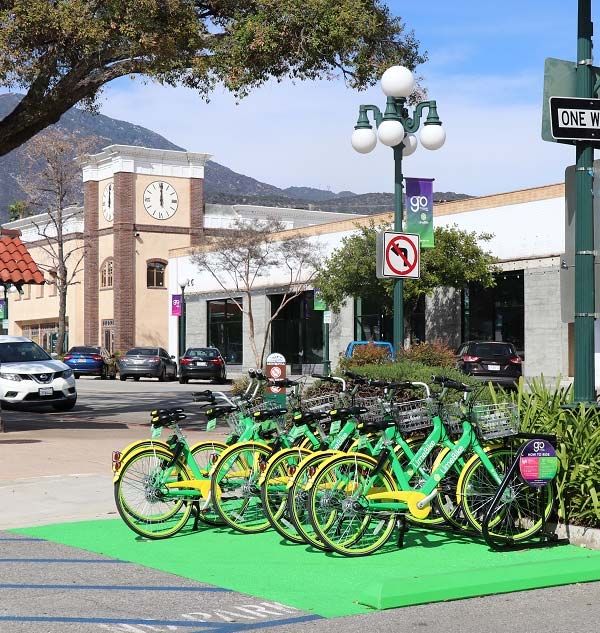
GOMONROVIA IS THE TALK OF THE REGION…
          AND BEYOND!!
SINCE ITS LAUNCH ON
   MARCH 17, 2018,
HAVE PEOPLE BEEN USING
    GOMONROVIA?
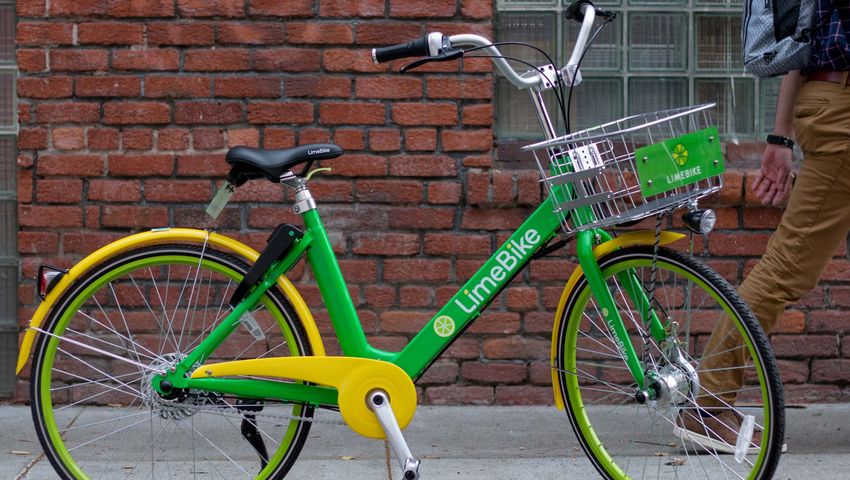
riding with
 LIME

GOMONROVIA LIME USAGE

Total Number of Rides             Total Number of Riders
  ▪ 8,719 total rides completed     ▪ 3,052 unique riders
  ▪ ~75 to ~85 rides / day
Total Time Spent Riding           Total Distance Ridden
  ▪ 3,115 hours spent riding on     ▪ 6,925 miles ridden on
    LimeBikes                         LimeBikes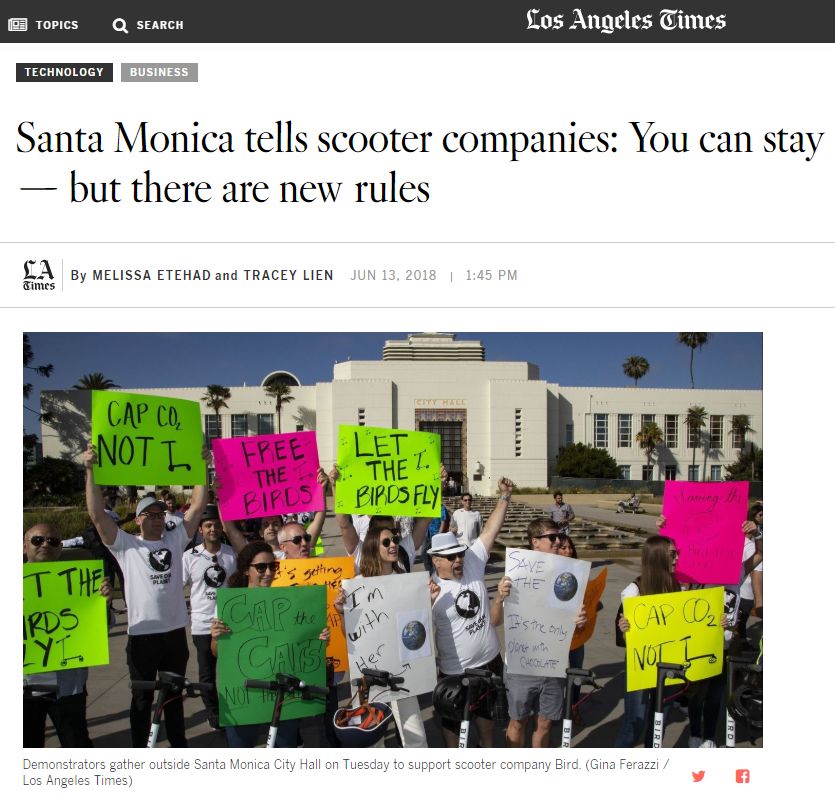
HOW ARE PEOPLE RIDING?

 The average user      Fridays & Saturdays
 travels 0.5 mile &       are the most
rides for 12 minutes      popular days
HOW ARE PEOPLE RIDING?

  Lifetime Rider Frequency

        2% 2%

  18%
                             Fewer than three trips
                             Three or more trips
                             Five or more trips
                             Fifteen or more trips
17%                   61%
                             Thirty or more trips
GOMONROVIA ONLINE DATA PORTAL
LIME PILOT PROGRAM SUMMARY & NEXT STEPS
▪ Limited start‐up costs to install bike racks and marketing materials
▪ No ongoing costs with Lime
▪ Access to real‐time LimeBike usage data through online portal
▪ Working to identify residential areas to install new bike racks based on
  usage
▪ Revise Bike Sharing Ordinance to include Scooters
▪ Continued outreach and public education regarding safety and
  parking etiquette
▪ Continue to improve rebalancing efforts in partnership with Lime
  operations team
MONROVIA TRANSIT
    powered by
GOMONROVIA
LYFT USAGE
▪ Since GoMonrovia began on March 17, 2018…
▪ The first two weeks… 3,800 rides!
▪ April 2018… the first full month… nearly 19,000 rides!
▪ May 2018… the second month… nearly 31,000 rides!GOMONROVIA
LYFT USAGE
▪ Around 8,000 people have signed up to use Lyft through the GoMonrovia
Program, making GoMonrovia Lyft’s most utilized transportation
partnership program!
▪ High adoption rate at start attributed to outreach efforts and marketing
▪ Average subsidy: ~$6.00 / tripHOW ARE PEOPLE RIDING?
Trip Length (Miles)
▪ Most rides are for short distances
▪ 93% of rides were 4 miles or less 6%
1%
0‐2 miles
2‐4 miles
34%
59% 4‐6 miles
>6 milesWHEN ARE PEOPLE RIDING?
Usage by Time of Day*
▪ Midday and evening rides most popular
time of day
▪ Approximately 1/5 potentially using for
8%
commute
20%
▪ Many going out to lunch and after‐work AM PEAK
errands / entertainment MIDDAY
33% PM PEAK
LATE NIGHT
39% *May 2018WHEN ARE PEOPLE RIDING?
Days of the Week*
▪ Ride distribution indicates
6,000
a higher percentage of use
mid‐week 5,000
5,025 5,049
4,706
5,019
▪ Tuesday – Friday most
3,979 3,929
popular days 4,000
▪ Sunday least popular day 3,000
2,964
of the week
2,000
1,000
0
Sunday Monday Tuesday Wednesday Thursday Friday Saturday
*May 2018GOMONROVIA LYFT VS. DIAL‐A‐RIDE RIDERSHIP
▪ Currently, we are providing ~ 1,000 rides / day with Lyft
▪ Compared to ~ 100 rides / day with Monrovia Transit’s dial‐a‐ride vans
▪ That is a 10x increase in ridership!
▪ Annual Ridership with Dial‐A‐Ride: 38,000
▪ May 2018 Monthly Ridership with Lyft: 31,000
▪ We are serving about as many passengers in one month of Lyft rides as we
served in an entire year on the dial‐a‐ride programWHY HAS THE COMMUNITY RESPONDED SO WELL
TO THE GOMONROVIA PROGRAM?
▪ More convenient, faster, and personalized form of public transportation
▪ Program design is simple and easy to use
▪ Visible GoMonrovia marketing campaignBENEFITS RESULTING FROM OUR LYFT PARTNERSHIP ▪ Substantial cost savings compared with dial‐a‐ride service ▪ Average dial‐a‐ride subsidy amount: ~$19.70 / ride ▪ Lyft program subsidy amount: ~$6.00 / ride ▪ Serving more than double the number of users ▪ Providing more than 10x number of rides annually ▪ Significant portion of community participating in program
BENEFITS RESULTING FROM OUR LYFT PARTNERSHIP
▪ Bridges first mile‐last mile connections between transit stops and
  origin / destination
▪ Reduces greenhouse gas emissions with Lyft’s carbon‐neutral rides!
▪ Reducing parking demand and helps ease commuter parking
  shortages
▪ Addresses late‐night and holiday service interruptions with dial‐a‐ride
▪ Dial‐a‐ride passengers benefit from faster response times due to
  decreased demand
ONE MAJOR ACCOMPLISHMENT OF GOMONROVIA…
        WE’RE GETTING PEOPLE OUT OF THEIR CARS!
▪ Suburban residents primarily rely
  on driving their cars for most trips
▪ Used to the comfort and
  convenience of personal vehicle
  ownership
▪ Reluctant to try new mode of
  transit / technology
▪ Changing existing behavior /
  patterns is the hardest part!
GOMONROVIA IS A HIT!!! …BUT CAN WE AFFORD TO BE SO POPULAR?
RESTRICTED TRANSPORTATION REVENUES
▪ We receive ~$3 million in restricted transportation funds on an annual basis
▪ About ~$1.8 million is reserved for ongoing projects / agreements, including Parking
  Companies of America (PCA)
▪ This leaves ~$1.2 million in restricted transportation revenues to use toward Lyft program
                                                                                                  Available Funds
              Funding Source                   Total Annual Budget       Obligated Amounts
                                                                                                    Remaining
    Prop A                                 $             1,139,145   $            (476,483)   $            662,662

    Prop A ‐ LA County ‐ Incentive Grant   $              225,000    $                   ‐    $            225,000

    Bradbury Reimbursement                 $                8,448    $                   ‐    $              8,448

    Measure M                              $              531,486    $            (400,000)   $            131,486

    Prop C                                 $              625,278    $            (508,216)   $            117,062

    Measure R                              $              468,968    $            (397,216)   $             71,752

    TOTAL                                  $             2,998,325   $          (1,781,915)   $          1,216,410
GOMONROVIA LYFT VS. DIAL‐A‐RIDE COSTS
DIAL‐A‐RIDE ANNUAL BUDGET (FY 16‐17)
Total Costs
Actual: $821,583.12
March 2018 $24,276.46
Fuel: $63,184.33
April 2018 $112,148.29
Quarterly Inspections w/ Foothill Transit: $12,453.38
May 2018 $192,328.75
Total Costs: $897,220.83 Total Costs $328,753.50
▪ Plus vehicle maintenance costs as needed
Avg. Cost / Passenger ~ $19.70 Avg. Subsidy / Ride ~ $6.00PROJECTED PROGRAM COSTS
EXCEED AVAILABLE FUNDS
▪ Currently, our projected annual ridership is 372,000 rides / year at the current
usage level of 31,000 rides / month
▪ At a $6.00 / ride subsidy, the projected annual costs are ~$2.2 million
▪ This mean that if we do nothing, we will exceed the ~$1.2 million restricted
transportation funds available to use toward the Lyft programHOW CAN WE KEEP PROVIDING THESE
SERVICES WHILE STAYING WITHIN OUR
TRANSPORTATION BUDGET?SHIFTING TO SHARED RIDES ‐
CAPITALIZING ON BEHAVIOR CHANGE
▪ Now that we’ve gotten people out of their cars, can we keep
the best parts of GoMonrovia, while shifting passengers to
Lyft’s shared ride option?RECOMMENDED PROGRAM MODIFICATIONS
1. Make the “Shared Ride” option the default for GoMonrovia rides
▪ Keep shared rides at $0.50 / ride
▪ Shared rides are provided at a lower cost to the City
▪ Approximately $3.50 / ride in GoMonrovia Service Area
▪ Passenger pays $0.50, City pays $3.00
Shared Ride Logistics:
▪ Only 1‐2 passenger(s) per ride
▪ Lyft app may or may not match you with passengers along your route
▪ May add a few minutes to your trip
Shared Rides Cut Our Subsidy / Ride in Half!
▪ From ~$6.00 / ride to ~$3.00 / rideBENEFITS OF SHIFTING TO SHARED RIDES
▪ In addition to cutting the City’s costs / ride in half…
▪ Shared Ride option will reduce vehicles miles traveled (VMT) and greenhouse
gases from vehicle emissions
▪ Each Shared Ride can be reported to the National Transit Database as a public
transit option
▪ Increase in ridership means the City could be eligible for more transportation
related fundingRECOMMENDED PROGRAM MODIFICATIONS
2. Continue to offer Regular Lyft (4‐seat) rides at the price of $3.00 / ride
▪ Shift the Regular Lyft rides to $3.00 / ride
▪ This will lower the City’s subsidy amount to ~$3.00 / ride
▪ This maintains an option for passengers willing to pay more for the comfort of
a private ride
▪ Also, it would allows families to transport additional passengers (up to 4)PROJECTED LYFT COSTS UNDER
NEW PRICING MODEL
▪ New pricing model means that Shared
Rides and Regular Rides would require
an approximately equal subsidy amount Total Rides / Month Annual Cost
of $3.00 / ride
30,000 $1,080,000
▪ If the City’s average subsidy is $3.00 /
ride at a ridership level of 35,000 or less, 35,000 $1,260,000
then our annual costs will decrease to
40,000 $1,440,000
approximately $1.2 million
▪ This would bring our operating costs in 45,000 $1,620,000
line with available transportation fundsBUT… WHAT IF RIDERSHIP LEVELS CONTINUE TO INCREASE?
IF USAGE CONTINUES TO INCREASE
WE CAN MANAGE DEMAND WITH NEW PRICING MODELS
    ▪ Staff would recommend making the shift to halve our
      subsidy costs initially, and see how usage levels fluctuate
      during the next few months
    ▪ If ridership levels continue to increase, we can start looking
      to manage demand by adjusting pricing levels until we
      reach a stabilization point that balances usage with our
      existing transportation budget
SOME ADDITIONAL
FOOD FOR THOUGHT…
EMERGING TRENDS IN THE
BIKE / SCOOTER / CAR
SHARING ECONOMY…
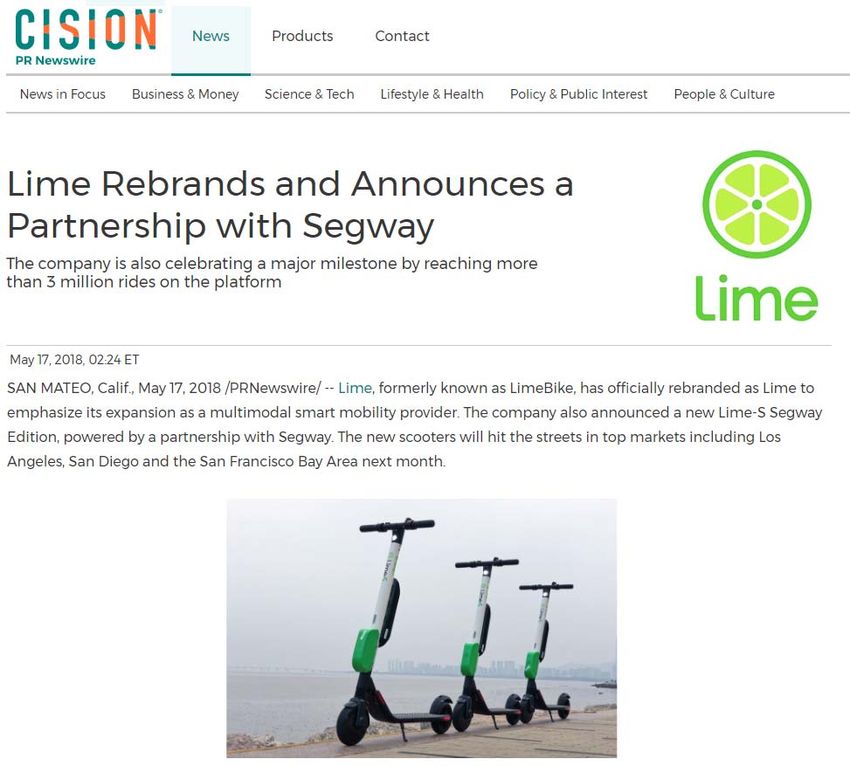
AND HOW IT IMPACTS US IN MONROVIA!WHAT’S NEXT FOR LIME?
WHAT’S NEXT FOR LYFT?
THE FUTURE OF BIKE & SCOOTER‐SHARING…
THE FUTURE OF BIKE & SCOOTER‐SHARING…
DEVELOPING SMART TRANSPORTATION POLICIES
▪ Increased value of curb space
▪ Cities crafting new policies to regulate scooters,
  electric bikes, and dockless bikes
   ▪ New permitting requirements
   ▪ Capping numbers of companies and devices
   ▪ Annual fees
   ▪ Per‐device fees
   ▪ Helmet / Reckless behavior enforcement challenges
     for scooters
   ▪ Pilot programs to determine what works best
SUMMARY OF PROPOSED PROGRAM ADJUSTMENTS
STAFF RECOMMENDATIONS

▪ Transition the $0.50 / ride to Shared Lyft rides
▪ Shift Regular Lyft rides to $3.00 / ride
▪ Amend Bike Share Ordinance to include “Scooter Sharing”
▪ Extend agreements with Lyft and Lime
▪ Continue to monitor Lyft usage and adjust pricing as needed
▪ Bring contract amendments to Council on August 7, 2018
QUESTIONS?
You can also read