How and why? Technology and practices used by university mathematics lecturers for emergency remote teaching during the COVID-19 pandemic - Oxford ...
←
→
Page content transcription
If your browser does not render page correctly, please read the page content below
Teaching Mathematics and its Applications: An International Journal of the IMA (2021) 0, 1–25
https://doi.org/10.1093/teamat/hrab018 Advance Access publication

 How and why? Technology and practices
 used by university mathematics lecturers

                                                                                                                                        Downloaded from https://academic.oup.com/teamat/advance-article/doi/10.1093/teamat/hrab018/6380163 by guest on 29 November 2021
  for emergency remote teaching during
         the COVID-19 pandemic
                                                              †,∗                                          ‡
                        Eabhnat Ní Fhloinn and Olivia Fitzmaurice
                       † School   of Mathematical Sciences, Dublin City University, Dublin, Ireland
                              ‡ School of Education, University of Limerick, Limerick, Ireland
                                  ∗ Corresponding author. Email: Eabhnat.nifhloinn@dcu.ie

                                   [Received February 2021; accepted September 2021]

     The COVID-19 pandemic led to closures of university campuses around the world from March
     2020 onwards. With little or no time for preparation, lecturers turned to emergency remote
     teaching to continue to educate their students. Online mathematics education poses particular
     challenges in terms of both the hardware and software necessary for effective teaching, due to
     issues with mathematical symbols and notation, among others. In this paper, we report upon an
     online survey of 257 university mathematics lecturers across 29 countries, which explores what
     hardware and software they used for emergency remote teaching, for what purposes they used
     these and what training and support were made available to them at the time. We also consider
     what approaches they took to emergency remote teaching and what were their reasons for this.

1. Introduction
The first wave of the COVID-19 pandemic in late February/early March 2020 led to a series of closures
of university campuses across the globe, with many lecturers turning to emergency remote teaching
to continue to educate their students. While a wealth of research and experience exists in the general
area of online teaching, it is important from the outset to note the difference between online teaching
and emergency remote teaching, with the latter best characterized ‘as a temporary shift of instructional
delivery to an alternate delivery mode due to crisis circumstances’ (Hodges et al., 2020). During the
initial closures of university campuses, many were mid-way through semester block of teaching and
had to change their mode of delivery over the course of a weekend. Beyond the initial months of the
emergency remote teaching what many lecturers have been engaged in can be described as blended
(Graham, 2006), hybrid (Snart, 2010) and distance learning (Moore et al., 2011), but this article is solely
concerned with the emergency remote teaching that took place during the early months of the pandemic.
   Teaching mathematics remotely presents specific challenges related to the nature and symbolic
notation of the subject, among other challenges (Trenholm & Peschke, 2020; Glass & Sue, 2008).

         © The Author(s) 2021. Published by Oxford University Press on behalf of The Institute of Mathematics and its Applications.
This is an Open Access article distributed under the terms of the Creative Commons Attribution License (http://creativecommons.
 org/licenses/by/4.0/), which permits unrestricted reuse, distribution, and reproduction in any medium, provided the original work is
                                                                                                                      properly cited.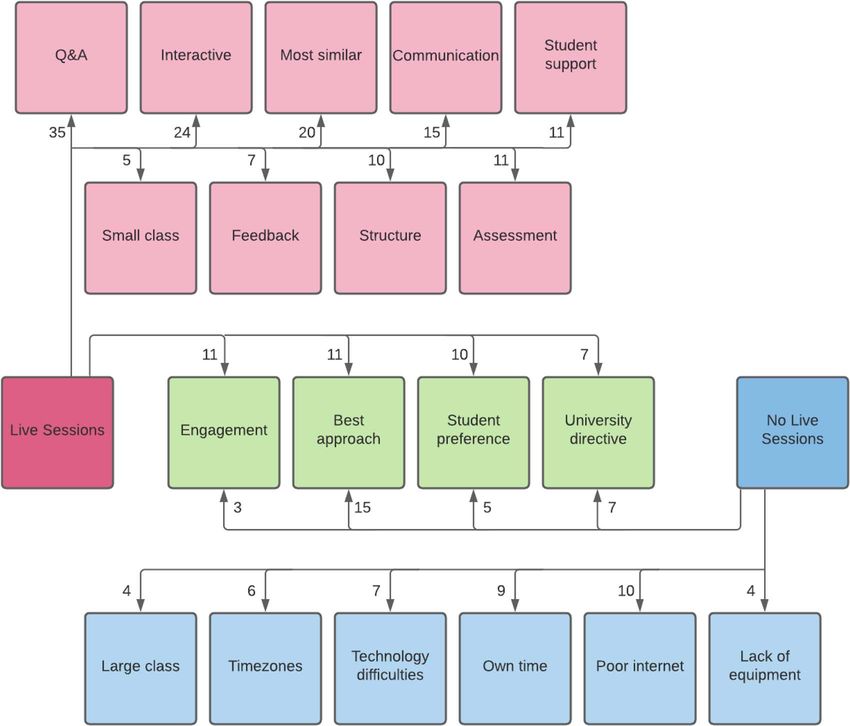
2                                    E. N. FHLOINN AND O. FITZMAURICE

Therefore, the aim of this research was to investigate how and why large numbers of mathematics
lecturers in higher education used particular technology to adjust to emergency remote teaching during
the initial months of the COVID-19 pandemic. Specifically, this paper addresses the following research

                                                                                                               Downloaded from https://academic.oup.com/teamat/advance-article/doi/10.1093/teamat/hrab018/6380163 by guest on 29 November 2021
questions:
    (1) What hardware and software were most commonly used by mathematics lecturers before the
        pandemic compared with during emergency remote teaching?
    (2) Why did lecturers choose to conduct live online sessions, pre-recorded sessions or other
        approaches during emergency remote teaching?
    (3) What training and support did staff receive in the use of hardware and software?
  In order to address these research questions, an online survey was designed and distributed to a wide
range of mathematics lecturers in May–June 2020 as detailed below.

2. Background
Research into the impact of the COVID-19 pandemic upon university education is starting to emerge,
with several publications focusing on how lecturers and students reacted to emergency remote teaching,
either in individual universities or regions (Bao, 2020; Bawa, 2020; Jena, 2020; Oyediran et al., 2020;
Rahiem, 2020) or specific subject areas, particularly in STEM fields (Alqurshi, 2020; Barton, 2020;
Delgado et al., 2020; Jabbar et al., 2021; Tan et al., 2020). There has been, as of yet, only a small number
of publications in relation to the teaching and learning of mathematics in higher education during the
COVID-19 pandemic although more are beginning to emerge. Several of these papers have focused on
the education of prospective mathematics teachers and how the students adapted to the use of digital
resources for mathematics (Mulenga & Marbán, 2020a, 2020b; Naidoo, 2020). A number of articles
suggest alternative approaches to assessment in mathematics that are appropriate for remote teaching
(Iannone, 2020; Jungic, 2020; Videnovic, 2020; Seaton, 2020). Other reports detail how mathematics
support in higher education adapted during the emergency remote teaching (Hodds, 2020; Johns & Mills,
2021), highlighting in particular the ‘drastically reduced’ numbers engaging with the services during this
time. Others consider how the community of mathematics post-secondary educators can learn from their
experience of this time (Garaschuk & Jungic, 2020). An excellent resource for mathematics lecturers has
been created in the UK (www.talmo.uk), which provides community-led online workshops and resources
to assist lecturers with their practice.
   Prior to the COVID pandemic, a growing body of research was emerging regarding the use of
technology in mathematics lecturing in higher education (Trenholm et al., 2012; Juan et al., 2011; Oates,
2011), including areas such as the use of mathematics-specific software (Zambak & Tyminski, 2020;
Hernández et al., 2020; Caglayan, 2018), investigations into student and lecturer preference/usage of
various mathematical resources (Ní Shé et al., 2017; Inglis et al., 2011) and explorations of approaches
to mathematical problem-solving using technology (Abramovich, 2014; Kay & Kletskin, 2012). The
question of providing recorded versions of live mathematics lectures for students has been explored for
over a decade at this point (Cascaval et al., 2008; Yoon & Sneddon, 2011) and is of particular relevance
in relation to the stark choices that academics faced during emergency remote teaching due to COVID. In
a study in which students had the choice of attending lectures or watching video resources (or both) in a
first-year business mathematics module in Ireland, the majority chose the video resources, although those
with higher lecture attendance in general received higher marks in the module (Howard et al., 2018).
Another study which considered students from five different mathematics modules in which both live
TECHNOLOGY AND PRACTICES USED BY UNIVERSITY MATHEMATICS LECTURERS 3
lectures and video recordings were provided found that those who attended lectures in person considered
video recordings of the lectures to be inferior to the live version (Yoon et al., 2014), although lecture
attendance was about 35% of the total cohort. Similarly, in a study comparing students in the UK and
Downloaded from https://academic.oup.com/teamat/advance-article/doi/10.1093/teamat/hrab018/6380163 by guest on 29 November 2021
Australia, it was found that lower lecture attendance rates coupled with higher usage of video resources
resulted in greater surface learning (Trenholm et al., 2019).
Oftentimes, higher education lecturers reject the use of technology as unnecessary to their teaching
until some powerful new incentive appears (Englund et al., 2017). At this point, training and support for
those adopting new technology, as well as positive initial experiences, are of paramount importance
(Heinonen et al., 2019; Jääskelä et al., 2017). Prior research has shown that mathematics lecturers
may not even be aware of the choice of additional hardware (e.g. visualizers, audio recording devices)
accessible to them for teaching purposes within their own university, and there is a need for greater
communication of such resources (Wood et al., 2011). In addition, there is some evidence to suggest
that mathematics lecturers are particularly wedded to their traditional form of lecturing (Sfard, 2014)
and have been slow to embrace online teaching (Lokken & Mullins, 2014), with Engelbrecht & Harding
(2005) questioning whether this was even possible in a discipline like mathematics. Maclaren (2014)
postulates that the reluctance of mathematics lecturers to embrace newer technologies in place of a
physical blackboard/whiteboard may be related to their perception that the trade-off is not worthwhile.
Indeed, even the standard qwerty keyboard is tailored for text-based disciplines but does not easily
translate into usage for representations of mathematics in an online environment (Trenholm & Peschke,
2020). Emergency remote teaching forced lecturers to adapt at short notice to teaching online, and so we
explored what they used and for what purpose when they did so.
3. Materials and methods
In order to address the three research questions highlighted above, we designed and implemented a survey
for mathematics lecturers in higher education.
3.1. Survey instrument
The online survey instrument began with a series of profile questions to determine the age profile,
gender, country in which the respondent currently worked, years of experience teaching mathematics
in higher education and current employment status. Following further profiling questions about class
sizes, contact teaching hours and modules taught, there were six other sections in the survey (for the
sections on assessment, see Fitzmaurice & Ní Fhloinn, 2021; the students’ experience, see Ní Fhloinn
& Fitzmaurice , 2021a; the lecturers’ experience, see Ní Fhloinn & Fitzmaurice, 2021b; and advice for
other practitioners, see Ní Fhloinn & Fitzmaurice, 2021c). In this paper, we focus upon two sections of
the survey: types of technology and purpose of technology. Within these two sections, there were 29
questions of which 8 were open ended. The relevant questions are to be found in the Appendix.
3.2. Data collection
Ethical approval to conduct the study was granted by one of the author’s local ethics committee.
The survey was conducted exclusively online using Google Forms and was emailed to mathematics
department mailing lists and advertised via online conferences in mathematics education.4 E. N. FHLOINN AND O. FITZMAURICE
Table 1. Profile statistics of survey respondents (N = 257), showing their
gender, age, years of experience teaching mathematics in higher education and
current employment status
Downloaded from https://academic.oup.com/teamat/advance-article/doi/10.1093/teamat/hrab018/6380163 by guest on 29 November 2021
Number %
Gender
Male 135 52.5%
Female 118 45.9%
Non-binary 1 0.4%
No response 3 0.8%
Age
20–29 years 16 6.2%
30–39 years 61 23.7%
40–49 years 69 26.8%
50–59 years 71 27.6%
60+ years 38 14.8%
No response 2 0.8%
Experience teaching mathematics in higher education
0–1 year 8 3.1%
2–3 years 13 5.1%
3–5 years 20 7.8%
5–10 years 34 13.2%
10–15 years 31 12.1%
15–20 years 34 13.2%
20+ years 117 45.5%
Employment Status
PhD/Postdoc 3 1.2%
Short-term contract (1 yr) 28 10.9%
Permanent 205 79.8%
Retired but teaching 4 1.6%
No response 1 0.4%
3.3. Data analyses
The quantitative data were analysed using Excel. General inductive analysis (Thomas, 2006) was
employed to code the qualitative data. Coding was undertaken by both researchers independently. The
codes were then compared and re-coded where necessary to ensure reliability. Throughout this paper, N
is used to report the total number of respondents to a given question, while n is used for the number who
selected a certain answer for a given question.
3.4. Sample
A summary of the profiling questions can be seen in Tables 1 and 2. There were 257 respondents. There
was a fairly even breakdown of gender among the respondents, which would not be typical of surveys of
mathematicians, given the fact that there are more male academic mathematicians than female. However,
the survey was specifically emailed to a mailing list for female mathematicians, which contributed to the
higher proportion of females answering the survey. The age of respondents showed a good spread withTECHNOLOGY AND PRACTICES USED BY UNIVERSITY MATHEMATICS LECTURERS 5
Table 2. Countries in which survey respondents (N = 257) currently work
Country Number %
Downloaded from https://academic.oup.com/teamat/advance-article/doi/10.1093/teamat/hrab018/6380163 by guest on 29 November 2021
Ireland 78 30.4%
UK (region not specified) 37 14.4%
Germany 21 8.2%
Hungary 21 8.2%
England 17 6.6%
USA 12 4.7%
Scotland 10 3.9%
France 6 2.3%
Australia 5 1.9%
Italy 5 1.9%
The Netherlands 5 1.9%
Turkey 5 1.9%
Albania 3 1.2%
Slovakia 3 1.2%
Wales 3 1.2%
North Macedonia 2 0.8%
Northern Ireland 2 0.8%
Portugal 2 0.8%
Serbia 2 0.8%
Slovenia 2 0.8%
Spain 2 0.8%
Other 8 3.1%
Not provided 6 2.3%
lower proportions under the age of thirty as would be expected among the lecturing population, and
their years of experience teaching mathematics in higher education reflected this. The vast majority of
respondents were in permanent employment.
By far, the highest proportion of respondents was based in Ireland, which is where both researchers
are also based, and almost all respondents were based in Europe at the time of answering. However, in
total, respondents from 29 different countries took part in the survey. These are displayed in Table 2.
The countries in which only a single respondent was based are the following: Austria, Czech Republic,
Denmark, Faroe Islands, Malta, Republic of Moldova, Sweden and Switzerland are listed collectively
in the table (Other). Six respondents did not provide a base country (Not provided). Note that otherwise
the table is a compilation of the exact responses given by respondents; for example, we have not collated
England, Scotland, Wales and Northern Ireland with the general heading of UK (region not specified) as
the education systems are not identical in each of these four countries.
The subjects being taught by the respondents could influence their approach to online teaching or
their experience of this, particularly in terms of assessment (Iannone & Simpson, 2011), or whether
they were teaching students specializing in mathematics (who would be studying many mathematics
modules online) or students taking only a single mathematics module. Respondents were asked to list
all courses they were teaching. Almost three-fifths of respondents were teaching students who were
majoring in mathematics, with just over half of respondents teaching service-mathematics students (those
studying one or more mathematics modules as part of their degree programme but not specializing in
mathematics).6 E. N. FHLOINN AND O. FITZMAURICE
How many contact teaching hours (total per WEEK) did
you expect to have this semester (pre-COVID pandemic)?
40
Downloaded from https://academic.oup.com/teamat/advance-article/doi/10.1093/teamat/hrab018/6380163 by guest on 29 November 2021
35
No. of Respondents
30
25
20
15
10
5
0
1 2 3 4 5 6 7 8 9 10 11 12 13 14 15 16 17+
No. of Expected Contact Teaching Hours
Fig. 1. Number of contact teaching hours per week that respondents expected to have (pre-COVID pandemic)
(N = 247).
The number of scheduled contact teaching hours that respondents had planned to do per week, pre-
pandemic, was of interest as it would give a rough indication of the teaching workload involved. Figure 1
shows this for the 247 responses, with the vast majority of those teaching 8 hours a week or fewer.
Finally, the class sizes involved could impact upon a lecturer’s approach to emergency remote teaching
and so respondents were asked to indicate the class sizes with which they were dealing with small being
up to 30, medium being 30 to 100 and large being over 100. Of the 256 responses, 59.4% had small
classes, 50.4% had medium classes and 22.7% had large classes.
3.5. Limitations of the study
(1) The current country of employment of 93% of respondents is somewhere in Europe with 30% of
respondents in Ireland, meaning that the results may not be generalizable to other continents.
(2) The survey was only available in English and was conducted online, advertised via mailing
lists and online conferences. There is no way of knowing how representative a sample it is of
mathematics lecturers.
(3) The survey was undertaken during May/June 2020. At this point, some universities may not have
completed their semester or examinations, which would impact some of the answers.
(4) Many respondents were in different stages in their academic year depending on the country in
which they were located.
4. Results: hardware and software used by mathematics lecturers
To gain an insight into what hardware and software mathematics lecturers used during emergency remote
teaching due to the COVID-19 pandemic, it was firstly important to ascertain what they used prior to this.
As such, respondents to the survey were initially asked about the hardware/software they used prior to the
pandemic and for what purposes, before then being asked the same question but for during emergencyTECHNOLOGY AND PRACTICES USED BY UNIVERSITY MATHEMATICS LECTURERS 7
Hardware used before and during Emergency Remote
Teaching (ERT)
250
Downloaded from https://academic.oup.com/teamat/advance-article/doi/10.1093/teamat/hrab018/6380163 by guest on 29 November 2021
No. of Respondents
200
150
100
50
0
Laptop Webcam External mic iPad/Tablet Visualiser Stylus pen Smartphone Other
Hardware used
Preparaon Before ERT Preparaon During ERT Teaching Before ERT
Teaching During ERT Communicaon Before ERT Communicaon During ERT
Fig. 2. Types of hardware used before the pandemic/during ERT and their purposes (N = 257).
remote teaching. The full results are presented separately for hardware and software, to enable an easier
comparison between the two time periods involved.
4.1. Hardware used before and during emergency remote teaching
Figure 2 shows the responses to the questions ‘What types of hardware did you use in the workplace
before the pandemic/during emergency remote teaching?’. Respondents were asked to indicate for what
purposes they used the hardware in question, with three options available to them: for preparing materials,
for teaching and for communicating with students.
It can be seen from Fig. 2 that there was very little use of different types of hardware prior to the
pandemic, with almost all respondents indicating use of a laptop and only one quarter of respondents
also using a visualizer (or document camera) for teaching purposes. By contrast, as might have been
expected, a far wider variety of hardware was utilized by those involved in emergency remote teaching.
Laptop usage was almost universal, with high usage of webcams, external microphones and stylus pens
also reported. Visualizer usage for teaching had decreased, most likely due to lack of access.
In terms of the ‘other’ hardware used in various situations, the most common response (n = 29) was
the use of a PC instead of a laptop, followed by a blackboard/whiteboard (n = 15). The other responses
mostly would have been encapsulated in those shown in the figure or else were mentioned by only a
couple of respondents.
4.2. Software used before and during emergency remote teaching
Having established what hardware was in use, respondents were then asked about their use of software
both before the pandemic and during emergency remote teaching. Again, they were also asked for what
purposes they used this software. The results are shown in Fig. 3.8 E. N. FHLOINN AND O. FITZMAURICE
Soware used before and during Emergency Remote
Teaching (ERT)
200
Downloaded from https://academic.oup.com/teamat/advance-article/doi/10.1093/teamat/hrab018/6380163 by guest on 29 November 2021
No. of Respondents
150
100
50
0
VLE Zoom Skype MS Teams Blackboard PowerPoint Latex Other
Collaborate
Soware used
Preparaon Before ERT Preparaon During ERT Teaching Before ERT
Teaching During ERT Communicaon Before ERT Communicaon During ERT
Fig. 3. Types of software used before the pandemic/during ERT and their purposes (N = 257).
Table 3. ‘Other’software options which more than four
respondents mentioned using either before the pandemic
or during emergency remote teaching
Software # Respondents
Cisco WebEx 9
OneNote 9
Big Blue Button 8
Email 8
Mathematica 7
OBS 7
Screencast-o-matic 7
YouTube 7
Geogebra 6
Canvas 5
Maple 5
Matlab 5
Panopto 5
MS Word 5
The virtual learning environment (VLE) in their university was in use for all three purposes prior
to the pandemic, with LaTeX also featuring strongly in the preparation of materials. PowerPoint also
featured for both preparation and teaching purposes. During emergency remote teaching, the list became
more diverse with communication systems such as Zoom, Skype, MS Teams or Blackboard Collaborate
showing a wider usage.
In terms of ‘other’ software used, there were 101 different software listed by respondents, but 87 of
these were mentioned by four respondents or fewer. The others are shown in Table 3 below.TECHNOLOGY AND PRACTICES USED BY UNIVERSITY MATHEMATICS LECTURERS 9
Type of online sessions (live online vs pre-recorded)
90
80
Downloaded from https://academic.oup.com/teamat/advance-article/doi/10.1093/teamat/hrab018/6380163 by guest on 29 November 2021
70
% Respondents 60
50
40
30
20
10
0
20-29 yrs 30-39 yrs 40-49 yrs 50-59 yrs 60+ yrs
Age
Both Live online Pre-recorded Neither
Fig. 4. Types of online sessions (live online/pre-recorded/both/neither) run by respondents during ERT, subdivided
by age-group (N = 255).
4.3. Selection of technology
Respondents were asked a general question regarding who chose the technology that they used and were
allowed to select as many options as were applicable: 81.3% (n = 208) of respondents said they chose
it themselves, 21.5% (n = 55) said decisions were made at departmental level, while 53.1% (n = 136)
said it was at university level. From comments made throughout the survey, this would seem to indicate
that the department/university chose what paid technologies to make available, and most lecturers were
then in a position to choose which technology they would use from what was available.
5. Results: remote teaching practices
Having looked in Section 4 at a macro level at the ways in which the hardware and software were used
by mathematics lecturers, both before the pandemic and during emergency remote teaching, we then
focussed on uncovering the specific forms of teaching mathematics lecturers pursued during the latter.
Almost three-quarters of respondents (n = 189) gave some form of live online sessions, and over three-
fifths produced pre-recorded sessions (n = 156). Just over two-fifths undertook both live online sessions
and pre-recorded sessions (n = 104). There were no significant differences between male and female
lecturers in terms of which form of online teaching they undertook, but some differences were observable
between lecturers in varying age groups, as shown in Fig. 4. In general, lecturers were less likely to use
pre-recorded sessions as they got older and slightly more likely to do neither live online nor pre-recorded
sessions. It should be remembered, however, that there were smaller numbers of the 20–29 years and
60+ years cohorts within the overall sample, and so these results must be interpreted with this in mind.
About three-quarters of respondents conducted lectures online (n = 193), almost 68% gave online
tutorials (n = 174) and nearly 17% did online computing labs (n = 43). Figure 5 shows the breakdown of
what combinations of teaching sessions were undertaken. There were no significant differences between
lecturers of different genders or age groups in this case.
In order to further explore the reasons for choosing to give live sessions versus pre-recording material,
respondents were asked to comment further on these issues, as reported below.10 E. N. FHLOINN AND O. FITZMAURICE
Type of teaching sessions undertaken during ERT
120
Downloaded from https://academic.oup.com/teamat/advance-article/doi/10.1093/teamat/hrab018/6380163 by guest on 29 November 2021
No. of Respondents
100
80
60
40
20
0
Lectures Tutorials Computer Lectures Tutorials Lectures Lectures,
only only labs only and and labs and labs tutorials
tutorials and labs
Type of Teaching Session
Fig. 5. Types of teaching sessions (lectures/tutorials/computer labs) conducted by respondents during ERT
(N = 256).
5.1. Live sessions
A total of 203 of the 257 who responded about whether or not they gave live online sessions commented
further to explain why. Of these 203 commenters, 71.4% had given live sessions. The comments were
split into those made by respondents who conducted live sessions, and those made by those who did not,
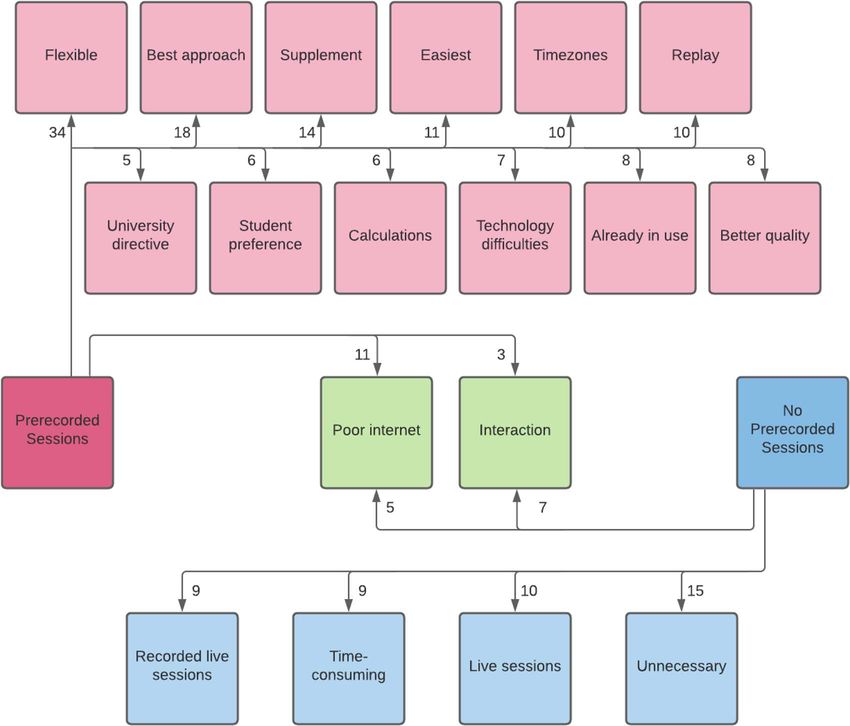
as shown in Fig. 6. Comments were coded under more than one theme, where applicable.
The most common theme among those who had conducted live online sessions was that of facilitating
‘Question and Answer’ sessions (n = 35, 17%) with most highlighting the importance they placed upon
‘giving students the opportunity to ask questions’. Closely linked to this was the lecturers’ desire to
make sessions ‘interactive’ (n = 24, 12%) (‘I believe that interactions with students are essential’)
and their overall feeling that offering live sessions was the ‘most similar’ to what students were used
to (n = 20, 10%) (‘All sessions were live as I felt it was best to try and normalize the experience as
much as possible’). Many also mentioned that ‘communication’ was an important part of their teaching
(n = 15, 7%) (‘personal communication is absolutely necessary to teach the type of material I taught
for undergrads’) and that this was facilitated by live sessions. Another theme to emerge was that of
‘student support’ (n = 11, 5%), with respondents feeling that ‘the psychological impact of live sessions
helped my students greatly’. The theme of ‘assessment’ emerged also (n = 11, 5%) with respondents
using live sessions to conduct student presentations (‘in this course the students are supposed to present
their seminars’), group-work assignments or project supervision. Some felt strongly that regular live
sessions were useful in providing a ‘structure’ with which students were familiar (n = 10, 5%) (‘I felt
it would help students stay motivated and structure their time if there was still a schedule to follow’).
Finally, lecturers found live sessions important ‘to get direct feedback from the students’ (n = 7, 3%) but
also acknowledged that they were particularly suitable for a ‘small class’ group (n = 5, 2%) (‘Had a
small Masters class. So Teams meeting seemed the best way to go. For my other module, there were 180
students. Felt that was too big for the meeting format’).
There were four common themes across those who had and had not given live sessions: for example,
respondents from both groups mentioned being given a ‘university directive’ to either give live online
sessions or not to (live: n = 7, 3%; not live: n = 7, 3%). Similarly, ‘student preference’ was a decidingTECHNOLOGY AND PRACTICES USED BY UNIVERSITY MATHEMATICS LECTURERS 11
Downloaded from https://academic.oup.com/teamat/advance-article/doi/10.1093/teamat/hrab018/6380163 by guest on 29 November 2021
Fig. 6. Themes which emerged from the question: ‘Did you give live sessions online and why/why not?’ The number
of comments under each theme are indicated by the numbers present on the arrows.
factor for both groups (live: n = 10, 5%; not live: n = 5, 2%). In terms of ‘engagement’ (live: n = 11,
5%; not live: n = 3, 1%), those who did live sessions ‘felt it was very important, both academically and
from a well-being perspective, to keep the students engaged’, while those who did not avoided them due
to ‘uncertainty about participation rate’. The most frequent common theme between both groups was
that of their approach being the ‘best approach’ (live: n = 11, 5%; not live: n = 15, 7%), with those who
did live sessions stating ‘this was the best thing given the nature of some of my teaching’ and those who
did not feeling that there was not ‘any great pedagogical advantage versus recorded lectures’.
There were six other themes identified among the responses of those who did not offer pre-recorded
sessions. Most prominent among these was ‘poor internet’ (n = 10, 5%), with lecturers concerned about
the low quality of their own internet connection or that of their students. Other respondents felt that it
was important to allow students to engage with material in their ‘own time’ (n = 9, 4%), rather than
having scheduled sessions (‘I thought best . . . that students could participate when it suited them best.12 E. N. FHLOINN AND O. FITZMAURICE
This was to try to reduce any pressure on them’). Some lecturers spoke of ‘technology difficulties’ that
prohibited them from conducting live sessions (n = 7, 3%) (‘the technology (tablet+mic+camera) adds
sufficient extra difficulty that I do not think it would be manageable’), while others mentioned the fact that
Downloaded from https://academic.oup.com/teamat/advance-article/doi/10.1093/teamat/hrab018/6380163 by guest on 29 November 2021
their students live in different ‘time zones’ ‘who would not have been able to tune into the live sessions’
(n = 6, 3%). Finally, ‘large class’ sizes dissuaded some from live online sessions (n = 4, 2%) (‘class
is too large for live session (400 students)’), along with ‘lack of equipment’ (n = 4, 2%), particularly
during the initial weeks (‘I did not have a visualizer to show students calculations in real time. I did not
have a tablet for several weeks’).
5.2. Pre-recorded sessions
A total of 201 of the 254 who responded about whether or not they did pre-recorded sessions commented
further to explain why. As above, the comments were split into those who had conducted pre-recorded
sessions and those who had not, as shown in Fig. 7. Again, comments were coded under more than one
theme, where applicable.
A large number of themes emerged from those who pre-recorded material. Chief among these was
the ‘flexible’ nature of such content (n = 34, 17%), both for students (‘Allowed students to work when
suited them’) and lecturers themselves (‘since I am at home with my family, it was easier to work at any
particular time, rather than following the school’s timetable’). The next most common theme was that
of pre-recorded sessions being the ‘best approach’ under the circumstances (n = 18, 9%) (‘It seemed
like the best available substitute for live lectures’), closely followed by the fact that others intended
these pre-recorded sessions as a ‘supplement’ for other approaches (n = 14, 7%) (‘For higher level
modules, where additional materials are not easily available online from other sources, I though it is of
benefit to offer short focussed videos on key concepts’). Other respondents found pre-recorded sessions
to be the ‘easiest’ approach (n = 11, 5%) (‘Since I have an iPad and my institution already subscribes to
Explain Everything, recording pencasts was very easy to do and was an obvious tool to use’), with others
mentioning the ability for students to ‘replay’ the material as a clear advantage (n = 10, 5%) (‘Students
can pause and replay if they do not get the idea at once’). Different ‘time zones’ emerged as a theme for
a number of respondents (n = 10, 5%), with pre-recorded sessions allowing them ‘to address students
being in multiple time zones’. For some respondents, pre-recorded sessions ensured that their teaching
was of ‘better quality’ (n = 8, 4%) (‘I would demand of myself that such videos were more polished than
a livestream. Even though those are also recorded’), while for others, this approach was ‘already in use’
(n = 8, 4%) (‘I have always used short podcasts’) and as such, it made sense to continue to incorporate
these during remote teaching. Fear of ‘technical difficulties’ during live sessions drove some towards
pre-recording (n = 7, 3%) (‘Technical issues made me fear that I couldn’t do anything reliably at the
beginning’), while others reported that it was the ‘student preference’ (n = 6, 3%) (‘I had some positive
feedback from students about having both the video and the annotated slides from the end of the video.
They could look over the annotated slide to see if they understand what was done in the video, and then
watch the video, knowing that they might need to pay special attention to some parts, or be able to skip
over parts that already make sense to them’). The sense that students ‘need to see calculations develop’
was put forward as another reason for pre-recorded sessions (n = 6, 3%), while other respondents stated
that it was a university directive (n = 5, 2%), either because ‘initially, the university could not provide
services for live sessions’ or they ‘preferred us to upload recorded classes instead of performing live, so
as not to overload the university server’.
There were only two common themes between those who pre-recorded sessions and those who
did not: ‘poor internet’ (pre-recorded: n = 11, 5%; no pre-recorded: n = 5, 2%) and ‘interaction’TECHNOLOGY AND PRACTICES USED BY UNIVERSITY MATHEMATICS LECTURERS 13
Downloaded from https://academic.oup.com/teamat/advance-article/doi/10.1093/teamat/hrab018/6380163 by guest on 29 November 2021
Fig. 7. Themes which emerged from the question: ‘Did you do any pre-recorded sessions and why/why not?’ The
number of comments under each theme are indicated by the numbers present on the arrows.
(pre-recorded: n = 3, 1%; no pre-recorded: n = 7, 3%). In terms of those who pre-recorded sessions,
most of those who mentioned internet issues were ‘concerned that poor broadband would negatively
impact on student engagement with live lectures’ while those who did not pre-record were either unable
to upload recordings due to their own poor internet speed or worried that students would not be able
to download them for similar reasons. In terms of interaction, those who pre-recorded mentioned low
interaction levels in lectures, so they felt there would be little lost by simply pre-recording while those
who did not pre-record spoke of how they ‘believe that interactions with students are essential’ and felt
pre-recording would not allow for this.
There were four other themes identified among the responses of those who did not do pre-recorded
sessions. The most common of these was that respondents felt they were ‘unnecessary’ (n = 15,
7%), and they did not comment further on this. Several respondents mentioned preferring to do ‘live
sessions’ instead (n = 10, 5%) (‘Live sessions seemed to me better since that way I could speak directly14 E. N. FHLOINN AND O. FITZMAURICE
with students and answer to their questions and preoccupations’), while others specifically referenced
‘recording live sessions’ as an alternative approach (n = 9, 4%) (‘Live sessions were recorded, which (in
part) did away with the need for pre-recording’). Finally, the ‘time-consuming’ nature of pre-recording
Downloaded from https://academic.oup.com/teamat/advance-article/doi/10.1093/teamat/hrab018/6380163 by guest on 29 November 2021
also emerged as a theme (n = 9, 4%) (‘Generating additional pre-recorded material would have required
significant additional time’).
5.3. Alternative approaches
From those who did not offer lectures, tutorials or computing labs online, there were a number of
alternative approaches taken, with 32 respondents providing feedback on this. The most common
approach (n = 11, 34%) taken was to conduct online assessment or give students exercises to complete
and submit for feedback. Next most popular (n = 10, 31%) was to help students on an individual basis,
either through email or video consultation sessions. Another popular approach (n = 9, 28%) was to
provide videos for the students, made available through their VLE, YouTube or directly emailed to
students. Nine respondents (28%) provided lecture notes, which they sent to their students for self-study,
though a couple mentioned that they only took this approach because their module was almost completed
and there was little content remaining to be covered. Finally, a small number (n = 4, 12%) of respondents
set up discussion forums for student use.
6. Results: training and support
6.1. Training
Respondents were asked about the formal training they received in the use of any technology. 44.9%
of respondents (n = 115) stated that they were offered formal training in the use of technology by their
employer prior to the pandemic, with 54% (n = 62) of these availing of such training. Once the pandemic
began, 65% of respondents (n = 166) were offered formal training, and 45% (n = 74) participated in this.
Of this pandemic-related training, 10.3% (n = 12) stated that the training took place at the outset of the
pandemic just prior to emergency remote teaching, 56% (n = 65) stated it took place during emergency
remote teaching, with 33.6% (n = 39) stating training was available both before and during emergency
remote teaching.
For those who did not give tutorials and/or computing labs online themselves, 53% had a teaching
assistant do so instead (N = 103). In terms of training these teaching assistants in the use of the necessary
software, the responsibility for this lay in a variety of areas: 35% (n = 22) of respondents said it was their
responsibility as lecturer, a further 32% (n = 20) said it was the teaching assistant’s own responsibility,
while 19% (n = 12) stated it was up to the university and 14% (n = 9) that it was up to their department.
6.2. Technical support
When asked if they had access to technical support if needed during emergency remote teaching, 92.5%
(n = 234) of respondents stated that they did, with 5.9% (n = 15) having no such access. However,
numerous comments under this question stated that the technical support was overwhelmed at this point
in time (‘In theory yes, but have received no help. Staff were either overloaded and could not help
or just weren’t able to do what I requested’). A total of 55.1% (n = 141) of respondents stated that
they experienced technical difficulties during online teaching that took place during the early period of
the COVID-19 pandemic. The most common technical difficulties encountered at this time were poorTECHNOLOGY AND PRACTICES USED BY UNIVERSITY MATHEMATICS LECTURERS 15
internet connection (n = 67, 26%), software issues (n = 60, 24%), hardware problems (n = 30, 12%),
communication difficulties (n = 22, 9%) and technical difficulties for students (n = 22, 9%). Poor internet
connections were generally mentioned in relation to issues providing live online classes (‘very poor
Downloaded from https://academic.oup.com/teamat/advance-article/doi/10.1093/teamat/hrab018/6380163 by guest on 29 November 2021
internet connection from my house . . . making it impossible to run live lectures’). Software issues ranged
from ‘trouble with installation of programmes’, to ‘unfamiliarity with software - needed to learn how to
master it’, to software errors, particularly in relation to assessments (‘issues with online assessment of
maths via BrightSpace—no records being sent to the GradeCentre’), and finally, software deemed not
fit for purpose (‘I followed the advice of the university on what software and hardware to use to teach a
highly-interactive class. The advice was only theoretically good. In practice, the proposed combination
is not workable’). Hardware problems are usually related to old equipment (‘very old laptop that I have
to have an icepack under else it overheats’), lack of equipment (‘no printer/scanner available in home
office’) or unsuitable equipment (‘the external webcam does not work well to shoot on my handwriting’).
Communication difficulties often referred to problems with Zoom/Teams/Adobe Connect (‘issues with
Zoom using dual monitors with different resolutions’), although a few respondents also had difficulties
with their email system (‘earlier I did not use my University mail system, it was difficult to get passwords
etc.’). Finally, technical difficulties for students resulted from ‘students without access to stable internet’
or lack of hardware/software to participate as needed in the class.
When asked to list all those who resolved these difficulties for them, there were 139 responses of
which 53% said they resolved their difficulties themselves, 26% stated it was technical support, 25%
with issues still outstanding and 9% had help from colleagues or family members.
7. Discussion and conclusion
In this paper, we posed three main research questions. The first of these is related to the hardware
and software used by mathematics lecturers both before the pandemic and during emergency remote
teaching. Over four-fifths of lecturers were in a position to choose the hardware/software they used
themselves, allowing them a large degree of autonomy in this regard, although they were usually making
their selection from a pre-determined menu of options in relation to anything that was not free to use.
Prior to the pandemic, there was low usage of different types of hardware, with laptops the only exception
to this, with 88% of respondents using these for some purpose (additionally, it should be noted that some
respondents reported using PCs instead).Visualizers, stylus pens and smartphones saw some low levels
of usage for particular purposes with 27%, 17% and 18% usage, respectively, although the low usage
could have been due to lecturers’ lack of knowledge of how to access these, as was the case in Wood
et al. (2011). In fact, only two-fifths of respondents reported using laptops for teaching purposes and
a third did not report using any form of hardware for teaching purposes, with many of these relying
instead on physical blackboards/whiteboards (‘Before the closure, I used a chalkboard in all of my
classes’). This echoes the findings of Billman et al. (2018), who found in their study of mathematics
lecturers in a South African university that ‘(d)espite this remarkable increase in technology usage for
teaching, half of the teaching staff still prefers the use of a chalkboard to technology for teaching’.
Indeed Greiffenhagen (2014) argues that the blackboard has an ‘almost iconic stance’ in mathematics,
due to the nature of mathematics and the importance lecturers attach to the visibility of the ‘process of
mathematical reasoning’ it provides. This is backed up in our study by the observation that, among our
respondents, there was little discernible difference between age groups or experience levels in terms of
their reliance upon physical blackboards, with between 10% and 14% of 30–39, 40–49 and 50–59 year
olds explicitly mentioning their use of physical blackboards at various points during the survey and 6%
and 5%, respectively, of 20–29 year olds and 60+ year olds.16 E. N. FHLOINN AND O. FITZMAURICE
During emergency remote teaching as might be expected the types of hardware in use both diversified
and increased considerably, as well as the range of functions for which the hardware was being used.
The percentage of respondents reporting no hardware usage for teaching reduced from a third to 3.5%.
Downloaded from https://academic.oup.com/teamat/advance-article/doi/10.1093/teamat/hrab018/6380163 by guest on 29 November 2021
However, respondents reported difficulties accessing hardware at short notice, with numerous cases of
lecturers resorting to borrowing (‘I needed a tablet and pen but the shops were closed. I borrowed’)
or relying on personally owned equipment in their home (‘Had I not had a number of devices at
home, personally bought, then I would not have been able to perform my role as successfully as I
had’). Respondents in many cases aimed to replicate the experience of having access to a physical
blackboard/whiteboard, the format most familiar and comfortable to a large number of mathematics
lecturers (Artemeva & Fox, 2011). Despite this, the number using visualizers or even make-shift
visualizers based on adapting their smartphones (e.g. University of Oxford, Mathematical Institute, 2020)
remained surprisingly low, suggesting that lecturers may not have been aware of this possibility.
In relation to software, the results were similarly sparse before the pandemic with 76% of respondents
using their institutional VLE for some purpose, 74% using LaTeX and 28% using PowerPoint. Here,
the low numbers using PowerPoint may be as a result of its perceived ineffectiveness for teaching
mathematics, between the difficulty of representing mathematics on the slides and the static nature
of this mode of presenting (Loch & Donovan, 2006). Indeed during emergency remote teaching, the
numbers using PowerPoint for teaching purposes actually decreased slightly to 26%, showing it was not
a perceived solution during emergency remote teaching to online teaching in mathematics. The number
using their institutional VLE increased slightly to 79% during emergency remote teaching. However,
it has been observed that VLE usage in those moving initially to online teaching can simply be an
attempt to create a digital version of an existing paper-based resource, without any further alteration
for the online environment (Borba et al., 2016). Our figures show that lecturers were more likely to use
their VLE for communication purposes with students rather than for teaching purposes, suggesting that
while they were making use of the various communication tools within the VLE, they were less inclined
to use (or less familiar with) the teaching technologies therein. Large increases were reported during
emergency remote teaching in communication software usage as might have been expected with 39%
now using Zoom, 29% using Teams, 17% using Skype and 14% using Blackboard Collaborate. There
was a far greater diversity in the range of ‘other’ software used by respondents but no strong trends
towards particular software emerged. A total of 18% of respondents used some ‘other’ software before
the pandemic and this increased to 28% during emergency remote teaching, but respondents encountered
a range of difficulties in implementing and adapting to new software: ‘There was a VERY steep learning
curve in obtaining the necessary software, learning how to use it and getting the laptop connected to
successfully continue with the classes’ and ‘One software allows you up to so many users but your class
is too big, the other has issues with security, the third is better for recording but not real-time teaching’.
This feedback suggests that many respondents did not have the ‘positive initial experience’ that Heinonen
et al. (2019) identified as being so valuable when introducing new software for teaching.
Our second research question aimed to delve deeper into the purposes for which lecturers used this
hardware and software by exploring why lecturers opted to conduct live online sessions, pre-recorded
sessions or alternative approaches. The most common approach was to give live sessions online with
pre-recorded sessions also a prominent approach, and many respondents doing both. Only a very small
number (n = 8) of respondents mentioned having used pre-recorded sessions previously, and yet 156
developed pre-recorded sessions during this period, bearing out the observation of Englund et al. (2017)
that a powerful new incentive can lead lecturers to use technology they would previously have considered
unnecessary. The importance placed by lecturers on interactivity and the ability to ask and answer
questions in real time emerged strongly in the responses, and this was reflected in student reasons givenTECHNOLOGY AND PRACTICES USED BY UNIVERSITY MATHEMATICS LECTURERS 17
for their preferences for live lectures in the work of Yoon et al. (2014). Indeed, strong justifications were
given by respondents both in favour of and against providing live online sessions, with similar responses
for pre-recorded sessions. These responses mirror in many ways the opposing opinions expressed in
Downloaded from https://academic.oup.com/teamat/advance-article/doi/10.1093/teamat/hrab018/6380163 by guest on 29 November 2021
relation to the recording of live in-person lectures, highlighted earlier (Howard et al., 2018; Trenholm
et al., 2019; Yoon & Sneddon, 2011). At the time of the survey, the impact of one choice over another is
not yet clear in this situation, where many lecturers and students were living in lockdown conditions for at
least a portion of this time and where assessments also had to change at short notice. However, it is worth
noting that respondents from both sides deemed their approach to reflect ‘student preference’. It should
be observed that students do not always choose the most effective strategies for their own study (Bjork
et al., 2013) and ‘popular’ choices may not necessarily result in the most learning, as evidenced by the
low correlation between student evaluations of teaching and evidence of learning (Uttl et al., 2017). The
observation made by Trenholm et al. (2019) about the higher level of surface learning associated with
those who chose to engage only with video resources when live in-person lectures were available may not
correspond to this cohort of students, given the particular circumstances in play, and the fact that students
may have only had one option available in their module. Yet, engagement levels emerged as a strong
concern among lecturers, regardless of the approach they took, with some observing that ‘viewing figures
for pre-recorded sessions was very poor’and others that ‘tutorials were offered by our tutors but not many
availed of them’ or that ‘I offered “class time” for answering questions etc. There was very little take-
up’. This echoes the experience of those involved in mathematics support at that time, who universally
reported far lower engagement figures with their services during this period (Hodds, 2020). This lack of
engagement with online teaching in mathematics is not unique to emergency remote teaching, with Glass
& Sue (2008) reporting that, although students in their fully online mathematics module engaged well
with homework, they placed little value on any discussion forums or similar. Many lecturers spoke of the
benefits of the flexibility of pre-recording sessions, both for themselves but primarily for their students,
some of whom were in different time zones or shouldering known and unknown responsibilities at the
time. It should be noted that, across many of the themes that emerged in responses to questions regarding
the purpose for which technology was used, a concern for their students and a desire to provide the best
possible educational experience for them under the circumstances permeated many of the comments
made by respondents, with one simply observing ‘I miss my students’.
Our final research question focused on the training and support that lecturers received in any hardware
or software they used. There was a steep learning curve involved, one which is often made more difficult
in the case of mathematics-specific software by the different requirements of software packages when
representing mathematical language (Smith et al., 2008). Effective support of lecturers moving to a
fully online environment has been hypothesized to rely on three components: administrative support,
peer support and professional development (Covington et al., 2005), and it was the last of these that we
particularly investigated here. The percentage of respondents who were offered professional development
opportunities in use of educational technology was relatively low, given the circumstances, with less than
half reporting any training available prior to the pandemic and only two-thirds during emergency remote
teaching. Given the importance of effective training and support to ensure lecturer engagement with
new technologies of this kind (Jääskelä et al., 2017; Heinonen et al., 2019), it is vital for universities
to support their teaching staff in this manner in the event of any sudden closure. It is also incumbent
upon the lecturers to avail of such training as befits their needs, with less than half reporting engaging
with the training offered by their university during emergency remote teaching. It would be of interest
in the future to investigate their reasons for non-engagement: whether they were personal circumstances
during emergency remote teaching or whether the training was not bespoke to technology relevant to
mathematics and therefore perceived not to be of use. The vast majority of respondents reported having18 E. N. FHLOINN AND O. FITZMAURICE
technical support available to them during this time period, even if it was, as might have been expected,
often overwhelmed with the number of requests. It is worth noting however that at the time of this survey
some 3–4 months after the beginning of emergency remote teaching, 25% of those who experienced
Downloaded from https://academic.oup.com/teamat/advance-article/doi/10.1093/teamat/hrab018/6380163 by guest on 29 November 2021
technical difficulties had not yet had these resolved. This may, in part, have been due to the fact that
many were still in a state of lockdown and there were difficulties with accessing in-person support with
hardware or wifi provision but also points to a difficult transition to emergency remote teaching for a
significant portion of respondents.
The results of this survey provide a snapshot into a unique period of emergency remote teaching, as
mathematics lecturers adjusted their teaching practices, making use of whatever hardware and software
were available to them and their students in the circumstances of emergency remote teaching. The
creation of a student-centred environment which was both interactive and engaging was mentioned
in some format by the majority of respondents. However, the tension between replicating a teaching
and learning environment as close as possible to that with which they were most comfortable prior to
emergency remote teaching, under conditions that were less than conducive to teaching and learning, was
evident in the responses given. Adequate access to hardware/software, and professional development in
the use of ICT to teach mathematics, will be a requirement in all universities, as it is likely in the future
that there will be a move towards more online provision of teaching both for the duration of the COVID
pandemic and beyond (Blankenberger & Williams 2020). We believe that it is simultaneously incumbent
on universities to provide hardware, software and training and for staff to uptake and participate.
Consideration of student access is critical.
Further research into best practice is also necessary. We plan to reissue our survey a year after the
original survey was distributed to ascertain the developments within online teaching of mathematics
during this time. A spontaneous move to remote teaching is a significantly different experience to online
teaching with a year’s experience. A comparison of the initial starting point as reported in this paper, with
the developments over the course of a year, should provide new insights into the extent of this difference.
REFERENCES
Abramovich, S. (2014) Revisiting mathematical problem solving and posing in the digital era: toward pedagogically
sound uses of modern technology. Int. J. Math. Educ. Sci. Technol., 45, 1034–1052.
Alqurshi, A. (2020) Investigating the impact of COVID-19 lockdown on pharmaceutical education in Saudi
Arabia–a call for a remote teaching contingency strategy. Saudi Pharm. J., 28, 1075–1083.
Artemeva, N. & Fox, J. (2011) The writing’s on the board: the global and the local in teaching undergraduate
mathematics through chalk talk. Writ. Commun., 28, 345–379.
Bao, W. (2020) COVID-19 and online teaching in higher education: a case study of Peking University. Hum. Behav.
Emerg. Technol., 2, 113–115.
Barton, D. C. (2020) Impacts of the COVID-19 pandemic on field instruction and remote teaching alternatives:
results from a survey of instructors. Ecol. Evol., 10, 12499–12507.
Bawa, P. (2020) Learning in the age of SARS-COV-2: a quantitative study of learners’ performance in the age of
emergency remote teaching. Comput. Educ. Open, 1, 100016.
Billman, A., Harding, A. & Engelbrecht, J. (2018) Does the chalkboard still hold its own against modern
technology in teaching mathematics? A case study. Int. J. Math. Educ. Sci. Technol., 49, 809–823.
Bjork, R. A., Dunlosky, J. & Kornell, N. (2013) Self-regulated learning: beliefs, techniques, and illusions. Annu.
Rev. Psychol., 64, 417–444.
Blankenberger, B. & Williams, A. M. (2020) COVID and the impact on higher education: the essential role of
integrity and accountability. Adm. Theory Prax., 42, 404–423.You can also read