How Does Where You Live Impact Your Health? - March 2022 - SOA.org
←
→
Page content transcription
If your browser does not render page correctly, please read the page content below
How Does Where You Live Impact Your
 Health?

March 2022
How Does Where You Live Impact Your
Health?
Author          Joan C. Barrett, FSA, MAAA                                      Sponsors       Health Care Cost Trends
                Consulting Actuary                                                             Research Program Steering
                Axene Health Partners, LLC.                                                    Committee

                Stephanie D. Entzminger, FSA, MAAA
                Consulting Actuary
                Axene Health Partners, LLC.

Caveat and Disclaimer
The opinions expressed and conclusions reached by the authors are their own and do not represent any official position or opinion of the Society of
Actuaries Research Institute, Society of Actuaries, or its members. The Society of Actuaries Research Institute makes no representation or warranty to the
accuracy of the information.

Copyright © 2022 by the Society of Actuaries Research Institute. All rights reserved.
3
CONTENTS
Abstract .................................................................................................................................................................... 5
Executive Summary .................................................................................................................................................. 6
Section 1. Introduction .................................................................................................................................................. 6
Section 2. Data Curation ................................................................................................................................................ 7
Section 3. Quantitative Analysis .................................................................................................................................... 7
Section 4. Strategic Approaches ................................................................................................................................... 7
Section 5. Case Studies .................................................................................................................................................. 7
Our Companion Report ................................................................................................................................................. 8
Disclaimer ....................................................................................................................................................................... 8
Section 1: Introduction ............................................................................................................................................. 9
1.1 Socioeconomic Factors ....................................................................................................................................... 9
1.2 Food Insecurity .................................................................................................................................................. 10
1.3 Barriers to Health Care ...................................................................................................................................... 10
1.4 The Business Case.............................................................................................................................................. 11
1.5 Out-of-Scope SDOH ........................................................................................................................................... 11
Section 2: Data Curation ......................................................................................................................................... 13
2.1 Database Specifications .................................................................................................................................... 13
Relevance to the Research Objective ............................................................................................................. 14
Study Period..................................................................................................................................................... 14
Geographic Specifications ............................................................................................................................... 14
Compliance ...................................................................................................................................................... 15
2.2 Data Review ....................................................................................................................................................... 15
Federal Data Sources....................................................................................................................................... 15
The Census ....................................................................................................................................................... 16
Surveys ........................................................................................................................................................... 16
Claims and Eligibility Data ............................................................................................................................... 17
Data Compilations ........................................................................................................................................... 17
Public/Private Hybrid Data Sources ................................................................................................................ 18
Data Limitations............................................................................................................................................... 19
2.3 Database Composition ...................................................................................................................................... 20
Health Care Outcomes .................................................................................................................................... 20
Health Care Costs ............................................................................................................................................ 20
Health Care Access .......................................................................................................................................... 21
Health Care Quality ......................................................................................................................................... 21
Risk Factors for Chronic Disease ..................................................................................................................... 21
Social Determinants of Health ........................................................................................................................ 21
2.4 Alternative Data Sources ................................................................................................................................... 21
Payer Data ........................................................................................................................................................ 21
Provider Organization Data............................................................................................................................. 22
Other Sources .................................................................................................................................................. 22
Section 3: Quantitative Analysis .............................................................................................................................. 24
3.1 Methods ............................................................................................................................................................. 24
3.2 Results ................................................................................................................................................................ 25
The Overall Cluster Landscape........................................................................................................................ 26
Identifying Clusters to Target for Intervention .............................................................................................. 27
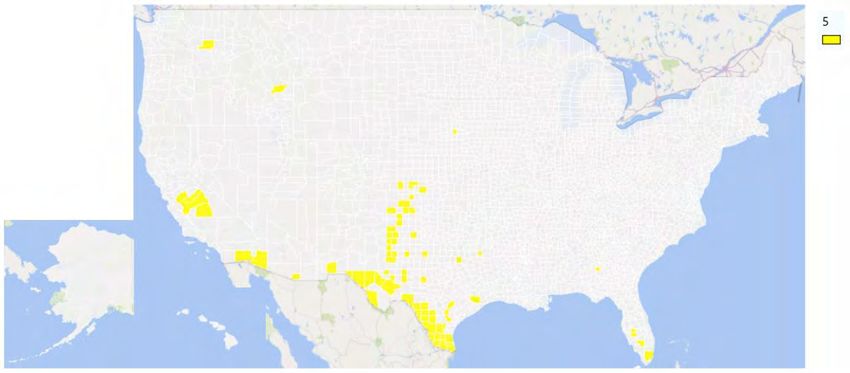
Analysis: Cluster 10 ......................................................................................................................................... 29
Analysis: Cluster 9............................................................................................................................................ 31
Copyright © 2022 Society of Actuaries Research Institute
4
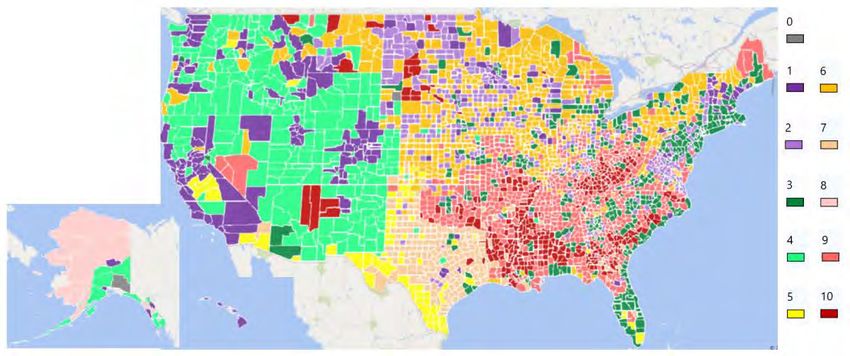
Analysis: Cluster 5............................................................................................................................................ 33
Next Steps ........................................................................................................................................................ 34
Section 4: Strategic Considerations ......................................................................................................................... 35
4.1 Food Insecurity ...................................................................................................................................................... 35
Barriers to Food Security................................................................................................................................. 36
Affordability Solutions ..................................................................................................................................... 36
Other Solutions ................................................................................................................................................ 37
4.2 Access to Providers ................................................................................................................................................ 37
Barriers to Better Health ................................................................................................................................. 38
Affordability Solutions ..................................................................................................................................... 38
Other Solutions ................................................................................................................................................ 39
4.3 Navigating the System ........................................................................................................................................... 40
Barriers to Better Health ................................................................................................................................. 40
Solutions .......................................................................................................................................................... 41
4.4 What Can Payers and Providers Do About It? ...................................................................................................... 41
Optimizing Resources ...................................................................................................................................... 42
Guiding Consumers ......................................................................................................................................... 42
Creating a Knowledge Base............................................................................................................................. 43
Section 5: Case Studies ........................................................................................................................................... 44
5.1 Emergency Department Uncompensated Care ............................................................................................... 44
The Analytics .................................................................................................................................................... 45
The Final Decision ............................................................................................................................................ 45
5.2 Medicaid MCO Data Capture and Community Partnerships .......................................................................... 45
5.3 Health Plan Self-Insured Strategy ..................................................................................................................... 47
Goals ........................................................................................................................................................... 47
Data ........................................................................................................................................................... 47
Knowledge Base............................................................................................................................................... 48
Section 6: Acknowledgments .................................................................................................................................. 50
Appendix A: Data Sources ....................................................................................................................................... 51
Table A-1: Census Data from the U.S. Census Bureau ............................................................................................... 51
Table A-2: Fee-for-Service Medicare Data from the Centers for Medicare and Medicaid Services ....................... 52
Table A-3: Food Access Data from the U.S. Department of Agriculture ................................................................... 52
Table A-4: Food Insecurity Data from Feeding America ............................................................................................ 53
Table A-5: Broadband Access Data from BroadbandNow.com ................................................................................. 53
Table A-6: Health Outcomes and Risk Factors from the CDC’s PLACES Project ....................................................... 54
Table A-7: Economic Statistics from Various Sources, Compiled by the U.S. Department of Agriculture .............. 54
Table A-8: Education Statistics from the U.S. Department of Agriculture ................................................................ 55
Table A-9: Poverty Statistics from the U.S. Department of Agriculture .................................................................... 55
Table A-10: Medicare Health Care Quality from the Dartmouth Atlas of Health Care ............................................ 56
Table A-11: Economic Statistics from the U.S. Department of Agriculture .............................................................. 56
Table A-12: Health Care Access and Demographics Statistics from the Health Resources and Services
Administration’s Area Health Resources Files ............................................................................................................ 57
Table A-13: Uninsured Rate from the Small Area Health Insurance Estimates ........................................................ 57
Appendix B: Variables ............................................................................................................................................. 58
Table B-1: Section 2 Data Dictionary .......................................................................................................................... 58
References ..................................................................................................................... Error! Bookmark not defined.
About The Society of Actuaries Research Institute .................................................................................................. 68
Copyright © 2022 Society of Actuaries Research Institute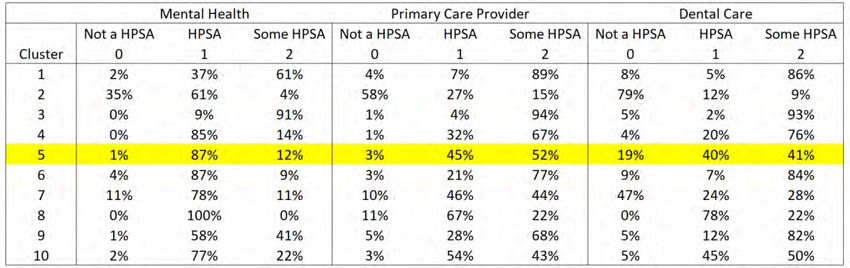
5

Abstract
How does where you live impact your health? The following research considers this question through the
lens of social determinants of health (SDOH), which are factors relating to where you live or work that may
impact your health. In the United States, geographical differences in SDOH contribute to wide disparities in
health status and outcomes. In particular, individuals who are negatively affected by SDOH may have an
increased burden of disease, leading to a relatively high total cost of care and worse quality of life. Given
the increased awareness of the pivotal role of SDOH in general health status as well as total cost of care,
more actuaries and their counterparts are interested in developing programs to address the SDOH of their
members (for health plans) and patients (for providers). This research presents a roadmap for SDOH
“solution” development, from data collection to analysis to integration with existing programs. Although
SDOH data collection is still in early stages, there is much that can be done with the data that exist. Also,
many potential SDOH “solutions” exist that may be implemented by payers and providers. These solutions
range from simple initiatives, such as including information about local resources in member
communications, to more substantive endeavors, such as setting up rural health clinics.

                                                                        Copyright © 2022 Society of Actuaries Research Institute
6

Executive Summary
Your health depends not only on your genetic make-up and lifestyle but also on where you live. Simple
things that many of us take for granted, such as transportation to grocery stores1 or doctors,2 can have a
direct and significant impact on your health if they are not available. Conditions that relate to where you
live and work that may impact your health are known as social determinants of health (SDOH).3 SDOH
contribute to wide disparities in health status and outcomes, and they exacerbate poor outcomes,4
especially in rural and low-income areas.

As income inequality has grown over the years and the link between income and good health becomes
more apparent,5 payers (health plans, employers, Medicare, Medicaid etc.) and providers (hospitals,
doctors, pharmacy benefit managers etc.) have begun to show increased interest in addressing SDOH,
primarily through their foundations and community outreach programs. An organization may want to
address SDOH through their business model for several reasons, including reductions to their total cost of
care, market competitiveness, member/patient satisfaction and corporate social responsibility. In a recent
employer survey, for example, 67% of the respondents indicated that SDOH are of growing importance to
their health strategy.6 Similarly, the Centers for Medicare and Medicaid Services (CMS) recently issued
guidance to states to drive adoptions to address SDOH in Medicaid.7

Given this increased interest in SDOH, the purpose of this report is to address two key questions:
    • How does where you live impact your health?
    • What can payers and providers do about it?

Countless ways can be identified to answer these questions, and each organization will do so in a way that
fits into its business model. This report suggests a roadmap for payers, providers and others to follow as
they analyze the landscape and develop solutions to local problems. Although the expectation is that most
readers will be actuaries, the report is written for anyone using SDOH data or developing a program
intended to address SDOH

The first section, the introduction, is the starting point for the journey. In any organization, the process
usually works best as a team effort, with some members focused on the numbers and others focusing on
the consumer. Following that principle, Sections 2 and 3 focus on the data and modeling needed to
determine which geographic areas and SDOH deserve a closer look. In Section 4, the focus is on the
consumer view, with an emphasis on what the consumer needs, what the consumer has now, and how to
help the consumer meet their needs. These two viewpoints are tied together in Section 5, where
hypothetical case studies describing how an organization may work to meet its objectives are provided.

SECTION 1. INTRODUCTION
The first step in the SDOH solutions development process is to understand how SDOH impacts health based
on information available in the literature. SDOH include socioeconomic factors and environmental factors,
among others, that can have direct or indirect impacts on health. Deleterious indirect impacts to health can
arise when SDOH pose barriers to health care access. Barriers to health care associated with SDOH include
affordability, discrimination and transportation, among others. One study has shown up to a 10% reduction
in costs for patients who social needs have been met8 when compared to those that did not.

                                                                        Copyright © 2022 Society of Actuaries Research Institute
7

SECTION 2. DATA CURATION
The second step in the process was to gather data for use in the modeling and analytics. Since the goal was
to compile a replicable dataset with a nationwide scope, the search was limited to publicly available data
with a nationwide footprint. This required heavy reliance on federal data sources, although these data
were supplemented with public data compiled by private entities. To capture a broad range of SDOH and
health data, the data include descriptions for each of the following: health care outcomes, health care
costs, health care access, health care quality, risk factors for chronic disease and select SDOH.

SECTION 3. QUANTITATIVE ANALYSIS
The third step in the process was to build and run an SDOH model. The model relied on the data compiled
in Section 2, using cluster analysis to group all U.S. counties into one of 10 profiles or “personas” based on
their SDOH and other health-related data. The output clusters were then ranked from best to worst based
on their average outcomes for 13 heath conditions. The regions with the worst health outcomes tended to
be areas in the rural Southeast characterized by persistent poverty and low broadband access. The regions
with the best outcomes tended to be urban areas on the West and East Coasts with low uninsured rates.

SECTION 4. STRATEGIC APPROACHES
Before an organization can develop a solution to address SDOH, it needs to understand the barriers to
better health and the actions other organizations are taking to address the issue. The federal government
has several programs in place to address key SDOH such as food insecurity and lack of provider access.
These programs alone are not adequate since barriers to better care remain. They are frequently
supplemented by nonprofit organizations, payers and providers. For example:
     • Nonprofit organizations and managed Medicaid plans often deliver boxes of healthy foods to
         consumers who are likely to be food insecure.
     • Payers, especially employers, may build or staff a clinic to meet the needs of a specific
         population.9

Even if an organization cannot accommodate efforts like these in their business model, they are in a unique
position to guide consumers through their health care journey. Those efforts may be as simple as including
information about local resources in their communications materials or as sophisticated as including
change management and behavioral finance techniques as part of their day-to-day business. Change
management techniques involve providing consumers with the knowledge and reinforcement they need to
change behavior. Behavioral finance involves framing choices and providing incentives to help consumers
make optimal decisions.

SECTION 5. CASE STUDIES
In this section, the principles described above are applied to a specific business situation using hypothetical
case studies. In the first case study, a large hospital system has noticed a significant increase in
uncompensated care attributed to its emergency department. A study of patient records shows that most
of the patients do not have a primary care provider. The hospital system wants not only to not only reduce
the level of uncompensated care but also to increase the rate of primary care. Although the problem is
spread throughout the service area, it is determined that the problem is centered in two areas, an urban
neighborhood and a county on the outskirts of its service area. After an extensive review of both areas, the
hospital system decided to build a rural health center. For their entire system, they will consult with a
change management expert to find a way to encourage people to seek primary care.

                                                                         Copyright © 2022 Society of Actuaries Research Institute
8

In the second case study, a health plan with a large, self-insured block of business wants to enhance the
analytical and consulting services provided to their members. The health plan already has a considerable
database it has developed over the years, which includes a proprietary database used to impute SDOH for
each member. To expand its capabilities, the health plan is creating a geographic resources database,
which will have the capacity to map local services to a member’s place of residence. With this information,
the health plan will be able to consult with its clients to determine how to supplement existing resources in
the most effective way.

In the final case study, a Medicaid managed care organization (MCO) has determined that some areas with
poor medical loss ratio performance may benefit from increased attention to SDOH. The MCO increases
SDOH data capture efforts in partnership with their providers and expands efforts to partner with
community-based organizations in targeted regions.

THE COMPANION REPORT
This report has been written as the first part of a two-part series. The companion report, which is being
written by Sara Corrough Teppema, FSA, MAAA, FCA, and Rebecca Owen, FSA, MAAA, FCA, will provide a
qualitative discussion of SDOH data and methods that will be a primer for actuaries and data analytics
professionals. That report, to be published later, will go into more depth for selected topics as described in
this report.

DISCLAIMER
This report is solely the work of the two authors, Joan C. Barrett, FSA, MAAA, and Stephanie D. Entzminger,
FSA, MAAA. It does not reflect the opinion of our employer, Axene Health Partners, LLC; the Society of
Actuaries; or members of the Project Oversight Group. The use of first-person pronouns, such as “we” and
“our,” refer to just Ms. Barrett and Ms. Entzminger.

                                                                        Copyright © 2022 Society of Actuaries Research Institute
9

Section 1: Introduction
Social determinants of health (SDOH) are typically very broadly defined, including most factors that affect
health outcomes outside of pathogens and individual risk behaviors. This means SDOH can include
environmental, socioeconomic, regulatory, cultural and other factors that influence health. Even pathogen
exposure and individual risk activity can be impacted by SDOH; for example, working in a factory with
unhygienic conditions could increase disease exposure, and tobacco use is strongly associated with
socioeconomic status.10

The factors that make up SDOH can be associated with geography, albeit at different levels. Regulations
that affect health, such as restrictions on indoor smoking, may be applicable at local, state or federal levels.
Poor air quality can be regional but also wide-ranging (for example, smoke from West Coast wildfires
compromising the air quality in New York City).

Given the geographic association of many SDOH, one of the primary goals of this paper is to use social
determinants of health data in conjunction with more traditional health data to identify geographies where
population health could be improved through a new intervention or program. In the following section of
this report, Section 2, we discuss the data used in our analysis and the sources of the data. The discussion
below provides support for the selection of the SDOH data used in our analysis, with a focus on the
following:
     • Section 1.1 discusses socioeconomic factors, including income level, education, occupation,
         poverty etc.
     • Section 1.2 discusses food insecurity, defined as the inability to meet nutritional needs due to low
         economic resources as well as low food access.
     • Section 1.3 discusses barriers to health care, including factors that hinder access to health care
         services, such as language barriers, affordability or lack of accessible providers.

Each of these factors is explored in more detail below. The subsection that follows, Section 1.4, discusses
the business case. This section details why health care payers and providers might be interested in SDOH
and the related geography. The final subsection, Section 1.5, discusses additional SDOH that are considered
out of scope for purposes of this project.

1.1 SOCIOECONOMIC FACTORS
Low socioeconomic status is a major contributor to poor health.11 Americans with few economic resources
may be unable to afford medical care, such that they must choose between going into debt to receive care
or avoiding needed care. And in some cases, this is a false choice. Taking on medical debt is itself associated
with delaying or forgoing needed health care.12 Those with difficulty paying medical bills reported skipping
or postponing rehabilitative services, dental care, physician-recommended treatments and tests, and filling
prescriptions more often than those who did not report difficulty paying medical bills.13

Although delaying or forgoing care may not ultimately result in an adverse health outcome, it certainly can
have a deleterious impact. For example, a study of commercially insured women with breast cancer found
that the cost of treatment more than doubled for those who received their diagnosis at a late stage
compared to those with early-stage diagnoses, implying a higher level of acuity for women diagnosed at
later stages.14 Delays in cancer treatment are associated with mortality increases as well.15 Perhaps
unsurprisingly, people living in poverty are more likely to receive late-stage cancer diagnoses than the
affluent.16 And people living in areas with persistent poverty—at least 20% of the population in poverty for
the past three decades—have higher cancer mortality than others, including those in areas with current
(but not persistent) high poverty.17

                                                                         Copyright © 2022 Society of Actuaries Research Institute
10

Poverty is not the only component of socioeconomic status that impacts health; related factors, such as
education and occupation, are also associated with health status.18,19,20

One note about terminology: Terms such as “low-income,” “Medicaid recipients” and “Temporary
Assistance for Needy Families (TANF) populations” are sometimes used interchangeably in SDOH
discussions. Although considerable overlap is seen in these populations, they are not identical. Due
diligence is necessary to understand the subtleties in interpreting the results of a study to a specific
population. In this report we discuss each of these populations on a stand-alone basis.

1.2 FOOD INSECURITY
Food insecurity occurs when a person or family does not have enough food to meet their nutritional needs.
Food insecurity is associated with low socioeconomic status, which itself is associated with poor health
outcomes (as discussed above). Having food insecurity in addition to low socioeconomic status, though,
can exacerbate poor health outcomes.21 For example, among low-income adults (less than 300% of the
federal poverty level), “severe” food insecurity was associated with higher prevalence of Type 2 diabetes
than “mild” food insecurity.22

Food insecurity is also associated with obesity, particularly among women. 23 Obesity is a risk factor for
many chronic conditions, including diabetes, hypertension and heart disease.24

Other health conditions associated with food insecurity include hypertension, coronary heart disease
(CHD), hepatitis, stroke, cancer, asthma, diabetes, arthritis, chronic obstructive pulmonary disease (COPD)
and kidney disease.25 Although food insecurity was found to be significantly associated with each of these
10 conditions, income was found to be associated with only three of the 10 (hepatitis, arthritis and COPD).

1.3 BARRIERS TO HEALTH CARE
Many barriers may hinder a person from accessing needed health care. As discussed in more detail above,
delayed or forgone care is associated with adverse health outcomes. A few of the potential barriers to
health care that a person may encounter include the following:
    • Access: A person may live in an area with too few primary care or other providers to meet the
         needs of the community.
    • Affordability: A person’s anticipated cost of health care may exceed their ability to pay, whether or
         not they have health insurance coverage.26
    • Child care: A parent or caregiver may lack affordable child care, hindering their ability to seek care
         for themselves.
    • Cultural norms: Needed care may be forgone due to cultural norms, particularly for women.27
    • Discrimination: A person may avoid health care system because of actual or perceived
         discrimination based on their gender, race, ethnicity, nationality, ability to pay or insurance
         coverage (e.g., enrollment in Medicaid).28
    • Health care literacy: A person may have difficulty navigating the health care system.
    • Language: For those whose first language is not English, difficultly may arise in finding a provider
         with whom they can effectively communicate their health issues.
    • Opportunity cost: Providers outside of urgent and emergency care settings often operate during
         working hours, such that a prospective patient must take paid or unpaid time off from work to
         seek care.
    • Transportation: A person may face long travel times to reach providers, or transportation options
         are unaffordable.

                                                                         Copyright © 2022 Society of Actuaries Research Institute
11
• Wait time: Delays in receiving treatment may be more likely depending on the service needed, the
urgency of the service or the patient’s insurance coverage.
One factor associated with many of the above barriers to care (including provider access, affordability,
cultural norms, discrimination and transportation) is the rurality of a person’s community.29 Rural areas
may lack sufficient providers across the health care spectrum, from primary care physicians to acute care
hospital facilities. A lack of accessible providers is associated with adverse health outcomes, including
increased preterm delivery, preventable hospitalizations and mortality. 30,31
A relatively new social determinant of health that can also pose a barrier to health care access is
broadband internet access. Lack of access to broadband (high-speed internet connectivity) hinders access
to telehealth services and can exacerbate other social determinants of health, such that broadband access
has been called a “super-determinant of health.”32
1.4 THE BUSINESS CASE
Why should a payer or provider spend resources on initiatives that address the upstream determinants of
health as described above rather than focus on the chronic and acute conditions that have traditionally
been their purview? Potential reasons include the following:
• Total cost of care (TCOC): Programs that address SDOH may prove more cost-effective in the long
run than “treating the symptoms” of SDOH. Payers are already attuned to TCOC, and providers are
becoming increasingly aware of TCOC as they take on more risk. One study has shown up to a 10%
reduction in costs for patients whose social needs have been met when compared to those that
did not.33
• Competition: Payers and providers who ignore SDOH may lose market share to competitors who
offer SDOH solutions. For example, if a payer is the only Medicare Advantage plan that does not
offer a transportation benefit in a particular rural area, then the organization may lose
membership.
• Member/patient satisfaction: Some patients appreciate a “whole person” approach to treatment.
For payers and providers to treat members and patients holistically, they must incorporate
physical, behavioral and social determinants of health into benefit offerings and treatment plans.
• Corporate social responsibility: Payers and providers may simply want to give back to their
community because they see it as the right thing to do, or it fits within their social responsibility
initiative.
The business case for addressing SDOH will likely vary by entity, depending on the unique challenges and
opportunities faced by each organization. Some examples of these are provided in the case studies in
Section 5.
1.5 OUT-OF-SCOPE SDOH
Many SDOH are not included in this report, including environmental factors and regulatory environment.
The discussion focuses on factors for which comprehensive public data are readily available (apart from
barriers to care, for which only a subset of factors has at least one associated public dataset). Other SDOH
data sources, covering some of the factors not discussed here, are discussed in the following section of this
report (Section 2).
Below we have provided a sample of topics that we believe deserve a more in-depth exploration, along
with a few resources that may be of use to readers:
Copyright © 2022 Society of Actuaries Research Institute12
• The COVID-19 pandemic: The COVID-19 pandemic has exacerbated disparities in health outcomes
for persons who have been historically marginalized.34 The CDC and Kaiser Family Foundation have
examined some of these disparities, as peer-reviewed studies have as well.35
• Nonmedical opioid use: The opioid pandemic disproportionately affects the uninsured and is
estimated to have added billions in costs to the U.S. health care system. 36
• Race/ethnicity: Substantial health disparities exist across race and ethnicity in the U.S. Although
peer-reviewed articles examining these disparities can be found in many publications, the Journal
of Racial and Ethnic Health Disparities37 focuses on this topic specifically.
• Provider practice patterns: Primary care providers tend to practice in regions close to their site of
training.38 This may contribute to differences in practice patterns by region, which may contribute
to regional differences in health outcomes.
• Regulatory environment: Federal, state and local laws and regulations may contribute to health
care outcomes. Laws that are broader in scope and percent of population impacted are likely to
be more thoroughly studied; for example, there is a wealth of information regarding the impact of
the passage of the Affordable Care Act on health insurance access and coverage.
• Environmental factors: Some populations are disproportionately exposed to environmental
hazards, including poor air quality, contaminated water, unsafe living conditions and noise
pollution. Available studies of environmental SDOH typically focus on one environmental element
at a time and can often be found in public health journals.
Data sources and descriptions of the variables that were considered in-scope for this report are discussed
in the following section of this report.
Copyright © 2022 Society of Actuaries Research Institute13
Section 2: Data Curation
How does where you live impact your health? To address this question, data are required.
In the previous section, we explored the link between SDOH and health status to provide context and
support for the quantitative and qualitative SDOH analyses discussed in this report. In this section, we
discuss guidelines for curating data, details of specific data sources we found to be applicable, and
potential data limitations. Our intent in this section is both to provide the data curation roadmap that we
developed for purposes of this study and to provide guidance for the analyst who has a different research
objective and must develop an alternate roadmap.
The next three parts of this section relate to our specific research objective, although some of the findings
are more broadly applicable:
• Section 2.1 provides our data curation guidelines.
• Section 2.2 includes a discussion of our data sources.
• Section 2.3 describes the variables included in our database.
Finally, Section 2.4 considers data sources that fell outside of our scope but may be useful to another
analyst interested in utilizing SDOH data. Although our focus in this section is on publicly available data, we
understand most analysts will have access to some additional data sources. As such, we have provided a
review of additional potential data sources in that subsection.
We focus here on publicly available data because one of our goals is to generate results that can easily be
reproduced, updated and expanded upon over time. We additionally wanted to focus on publicly available
data accessible to all analysts.
Our process for data curation is specific to our analysis (see Section 3) but has elements that can be
replicated for other analyses. The more generalized processes of selecting, reviewing and compiling data
sources for SDOH analyses will be outlined in the companion paper.
In this section, as well as those that follow, we complied with the appropriate actuarial standards of
practice (ASOPs) in that we have disclosed any limitations in our data or analysis that may be material.
Materiality is defined in the ASOPs as a statement or omission that could impact a decision made by an
intended user. In this section and the attached Appendix B, we have identified the primary limitations of
the data for the purposes of our study. The ethical use of data will be discussed in more detail in the
companion paper.
2.1 DATABASE SPECIFICATIONS
We are endeavoring in this section to compile a broad spectrum of useful, appropriate and publicly
available data to answer the question “How does where you live impact your health?” Given this broad
mission, one of our first steps was to develop a series of database specifications. These specifications were
used as research guidelines. These guidelines narrowed our focus and, importantly, gave meaning to the
term “useful, appropriate and publicly available data.”
Copyright © 2022 Society of Actuaries Research Institute14
We considered the following when developing our database specifications:
• Relevance to the research objective
• Study period
• Geography
• Compliance
Each of these specifications is reviewed in more detail below.
RELEVANCE TO THE RESEARCH OBJECTIVE
Our primary interest is how where one lives impacts one’s health. As such, our scope was limited to data
fields that have been demonstrated to have an impact on health.
We developed the following series of data domains that related to our primary objective:
• Health care outcomes
• Health care costs
• Health care access
• Health care quality
• Risk factors for chronic disease
• Social determinants of health (SDOH)
We accounted for relevance by limiting data selection to variables that fit one of the above domains.
Additionally, we maintained a diversity of fields by selecting a few variables for each domain.
The domains and their final variables are discussed in greater depth in Section 2.3.
STUDY PERIOD
Our study period is calendar year 2019. We selected this period to avoid conflating results with the impact
of the COVID-19 pandemic and because that was the most recent period available for many of the sources
we reviewed.
A few caveats are associated with this study period:
• Some of our sources did not have data available through 2019. These limitations are detailed in
Appendix A. We considered the usefulness of these data (particularly the urban/rural
classifications) to outweigh the fact that they were not current.
• Some of our data apply to the entire calendar year, such as Medicare claims data, whereas some
data are applicable to a specific date range within the year (e.g., some survey data).
Other limitations associated with the study period are discussed in Section 2.2.
GEOGRAPHIC SPECIFICATIONS
Our analysis is restricted to the 50 states and the District of Columbia. The U.S. has more than 89,000 state
and local governments,39 so one challenge in developing this report was to determine a focused way to
reflect the diversity in the health care system by geographic region.
In this report, the analysis and data collection efforts have been performed at the county level since data
are widely available at this level and counties tend to be well-defined geographically from year to year. A
total of 3,142 counties or county equivalents are found nationwide. A county equivalent is comparable to a
county but may go by another name, such as a parish in Louisiana or a borough in Alaska. In some cases, a
Copyright © 2022 Society of Actuaries Research Institute15
city that is governmentally independent of county organization, such as Carson City, Nevada, is treated as a
county. In most states, the county is also a political division, but that is not always the case. In Connecticut,
Rhode Island and Massachusetts, geographic counties are listed although they are not governmental
entities.
We relied on the Federal Information Processing Standard (FIPS) code, which is unique to each county, to
match counties between datasets as a unique identifier.
We did consider basing our analysis on metropolitan statistical areas (MSAs) instead of counties since
health care resources are often organized by MSA. The primary reason we did not use them is that some
MSAs, such as Cincinnati, cross state borders. Key decisions (such as Affordable Care Act [ACA] premium
rates and Medicaid eligibility and benefit rules) are made at the state level. We found it important to
perform our analysis at the county level, since each county is associated with only one state.
For some data sources, data are available at a more granular level than by county. This is important to note
because as units of study, counties can vary widely. For example, the 2019 population estimate for
Kalawao, Hawaii, was 86 residents. During the same period, more than 10 million people resided in Los
Angeles, California. Analysts requiring a smaller geographic unit may find data available at the three- or
five-digit ZIP code level, at the census tract level, or another geographic basis. As discussed above for MSAs,
ZIP codes may cross state borders, which is important to be mindful of if the analysis is dependent on laws
or other factors that vary at the state level. When working with data at the census tract level, the user may
need to incorporate crosswalks to other geographies. These mappings may not be one-to-one depending
on the fields used.40
COMPLIANCE
Compliance, which is sometimes referred to as data use, has a two-pronged meaning: the first is
compliance with applicable ASOPs, and the second is legal compliance. Legal compliance includes
compliance with specific laws, such as HIPAA (the Health Insurance Portability and Accountability Act of
1996), as well as compliance with copyright law, including the terms of use associated with each data
source. Depending on the publishing entity, the terms of use may include, among other things, a
requirement to cite the data source, an agreement to hold the publishing entity harmless for the data, an
agreement not to reproduce and sell the data. It is often advisable to have the organization’s legal team
review the process.
2.2 DATA REVIEW
The specifications detailed above informed our data review. In accordance with the ASOPs, we conducted a
review of the quality control process for each organization providing data and the underlying analytical
methods of each of the data sources. We were generally satisfied that the quality control processes were in
place and the analytical methods were acceptable, with the exceptions noted.
Below we provide the results of the review, including a description of the sources we used for our database
and potential limitations of these and other public data.
FEDERAL DATA SOURCES
Most of the data we obtained were sourced from various departments of the federal government. Data
collection, processing and dissemination at this level are handled by multiple federal statistical agencies.
These functions are governed by a specific set of principles and practices that are intended to ensure
credibility and promote trust among stakeholders, among other goals. 41
Copyright © 2022 Society of Actuaries Research Institute16
We relied upon the census, survey results, claims data and data compilations sourced from multiple
departments. A summary of the nature of our sources is provided in Figure 2.1.
Figure 2.1
FEDERAL DATA SOURCES
Data
U.S. Census Surveys Claims Data
Compilations
Geographic
American Food Environment
Decennial Census Variation Public
Community Survey Atlas
Use File
Behavioral Risk
Area Health
Annual Estimates Factor Surveillance
Resource Files
System
Below we provide a description of federal sources included in the database. More details are provided in
Appendix A.
THE CENSUS
The U.S. Census Bureau conducts the decennial census once every 10 years as required by the Constitution.
The Constitution states that the purpose of the decennial census is to apportion seats in the House of
Representatives, but over time the census has become a premier source of information about the U.S.
population.
As the term “census” implies, the intent is to count every person living in the U.S. Each person can
participate by answering a short questionnaire by mail, online or over the phone. Although the intent is to
include everyone, there is a potential for undercounting, especially for some populations.
The Census Bureau also provides an annual update of the population count using a roll-forward method,
which accounts for births, deaths and migration. This method is complicated and may result in some
overstatements or understatements, especially in smaller areas.
SURVEYS
To supplement the limited data available through the census, we used surveys and surveillance systems,
such as the following:
• The American Community Survey (ACS) provides detailed population and housing data based on
surveys of about 3 million households annually. It is administered by the U.S. Census Bureau and
covers a wide variety of social, housing-related, economic and demographic topics. Once every
five years, the Census Bureau releases a five-year estimate that includes data for all 3,142
counties, including the 2,136 counties with populations too small to produce annual estimates.
The latest five-year release was for the 2015–2019 timeframe.42
• The Behavioral Risk Factor Surveillance System (BRFSS) is a system of health-related surveys
regarding risk behaviors, chronic health conditions and use of preventive services. The BRFSS
surveys about 400,000 adults (age 18 or greater) each year on an ongoing basis. Like the ACS, the
Copyright © 2022 Society of Actuaries Research Institute17
BRFSS is continuously administered, as opposed to a moment-in-time survey like the decennial
census.
Unlike the decennial census, surveys are based on a random sample of the population. The survey may be
“oversampled” for specific subgroups to provide a statistically valid conclusion about that population. For
other populations, especially smaller areas, little or no data may be collected in any given year, so the
values must be imputed.
CLAIMS AND ELIGIBILITY DATA
In addition to survey data, we relied upon federal claims and eligibility data. Claims data for the uninsured,
commercially insured and even Medicaid populations are not generally publicly available, with exceptions
discussed in Section 2.4. By comparison, data for traditional Medicare beneficiaries are abundantly
available, although some data are suppressed for privacy purposes. In this report, we relied on CMS’s
Medicare Geographic Variation Public Use Files, which include Medicare beneficiary, cost and utilization
data by county. The cost data can be analyzed on a raw or risk-adjusted basis, and CMS additionally
provides costs standardized to a national fee schedule (as well as other modifications).43 Concerns with
using these data include treatment of missing or suppressed data, as noted above, as well as applicability
to the study population. Also, these data do not include any data relating to Medicare Advantage
beneficiaries, so the data may not represent the Medicare population as a whole.
DATA COMPILATIONS
We also relied on data compiled by the U.S. Department of Agriculture’s (USDA) Economic Research Service
(ERS). These datasets included a wealth of information compiled from other government departments,
covering poverty, economic statistics, education and other factors. We cross-checked control totals against
tables from the originating department and found no alarming discrepancies, and so we concluded that the
ERS compilations may be an acceptable “one-stop shop” for government data. That said, data users must
be careful to understand the definition of each variable they are using, particularly when performing
reasonability checks against other sources. For example, according to a Society of Actuaries research
report, the definition of “uninsured” varies considerably depending on the survey instrument used.44
We used two other federally supplied data compilations in our analysis:
• The Food Environment Atlas, which is also available through the USDA’s ERS. The Food
Environment Atlas is updated every few years and contains data on food access, grocery store
prevalence, health risk factors, and other things. One issue with the data in the Atlas is that the
primary data source often has more up-to-date information. For example, the most recent
population estimate provided in the latest Atlas release (2020) is for calendar year 2018. An
additional limitation is that documentation appears to be available for the 2017 Atlas release but
not the 2020 Atlas release. The best use of these data might be to get a quick view of many
potential variables, decide which best suit the analysis, and then pull the data from the primary
source, whenever possible.
• The Area Health Resource Files (AHRF) are available through the Health Resources and Services
Administration. The files are quite large, containing more than 6,000 health care–related variables
sourced from dozens of public and private entities. Limitations of these data include geography
(the most granular level available is county), age (some fields are at least a few years outdated)
and validity. Some fields we checked did not pass a reasonableness test, and so they could not be
used in our analysis. We recommend checking the desired fields against a secondary source as a
reasonableness test before using them.
Copyright © 2022 Society of Actuaries Research Institute18
PUBLIC/PRIVATE HYBRID DATA SOURCES
We prioritized federal data as our default source. This was a natural choice as our data specifications
included publicly available, nationwide data. In some instances, however, data from private entities either
offered variables that did not appear to be available through federal data or offered data that appeared to
be more robust or applicable to our needs than the federal equivalent.
In this report we relied on three such data sources available through private entities: The Dartmouth Atlas
of Health Care from The Dartmouth Institute for Health Policy and Clinical Practice, the Map the Meal Gap
dataset from Feeding America, and the Open Data Challenge data from BroadbandNow. These datasets all
still rely on federal data, though, as shown in Figure 2.2.
Figure 2.2
DEVELOPMENT OF HYBRID DATA
Private Sector Hybrid
Federal Data
Resources Sources
American
Map the Meal
Community
Gap
Survey
Models and/or
Medicare claims Dartmouth Atlas
proprietary data
Form 477
BroadbandNow
regulatory data
Below we provide a description of public-private hybrid sources included in the database. More details are
provided in Appendix A.
The Dartmouth Atlas of Health Care provides a broad array of Medicare data, including expenditures,
mortality, hospital discharge rates and quality metrics such as hospital readmission rates. It also integrates
other sources, such as data from the American Hospital Association. We preferred some of these data to
CMS’s data because adjustments were made to standardize differences in age, sex and race. However,
some of the quality measures, such as hospital readmission rates for patients with a congestive heart
failure diagnosis, have a prohibitively high rate of missing or suppressed data. Such variables may be useful
for some regions but cannot be used in a nationwide analysis. Additionally, the data lag CMS releases by at
least a year. Most of the work done by the Dartmouth Atlas of Health Care goes through a rigorous peer
review process, so we were satisfied that the quality control processes were in place.
Another advantage to using these data are that resource data are allocated to the residence of the patients
using the resource, not to the physical location of the resource. This better reflects the availability or
resources for rural areas, which may have a few physicians and no hospitals located in that area.
Feeding America supplies annual data regarding food insecurity at the state, county and congressional
district level. As noted above, we did pull food access data from the USDA. However, food insecurity is
defined differently than food access. Food access in the USDA dataset was defined as a function of distance
Copyright © 2022 Society of Actuaries Research InstituteYou can also read