Indoor Air Quality Guidance: Assessment, Monitoring, Modelling and Mitigation September 2021 - Version 1.0 - IAQM
←
→
Page content transcription
If your browser does not render page correctly, please read the page content below

IAQM u GUIDANCE
                                    Indoor Air Quality

                                        Institute of
                                        Air Quality
                                        Management

Indoor Air Quality Guidance: Assessment, Monitoring,
Modelling and Mitigation
Version 1.0
September 2021

                                             www.iaqm.co.uk
IAQM uuGUIDANCE
                                                                                  GUIDANCE
                                                                         Indoor Air Quality

Contents
     Acknowledgements									                                                          4
1.   Introduction 											5
     1.1. Purpose of this Guidance									5
     1.2. Context 											5
     1.3. Scope 											5
     1.4. Why IAQ is Important 									6
     1.5. Purpose of a IAQ Assessment									7
2.   Background 											8
     2.1. Main Pollutants and Their Health Effects 							                              8
     2.2. Indoor Chemistry 										10
     2.3. Exposure											11
     2.4. Other Indoor Environmental Conditions			                     				12
3.   Assessment Criteria 										13
     3.1. Introduction											13
     3.2. Derived Assessment Criteria 									13
     3.3. Hierarchy of Assessment Criteria								16
4.   Assessment Approach										17
     4.1. Introduction											17
     4.2. IAQ Assessment Stage 1: Scoping Study – Collation of Relevant Information 			 19
     4.3. IAQ Assessment Stage 2: Assessment								21
     4.4. Stage 3: Mitigation/Improvement Opportunities						27
     4.5. Stage 4: Reporting										27
5.   Monitoring Indoor Air Quality and Personal Exposure						                          28
     5.1. Reasons to Sample										28
     5.2. What to Sample										28
     5.3. Sampling Duration										28
     5.4. How to Sample										28
     5.5. Where to Sample										29
     5.6. Suitability of the Monitoring Method								31
6.   Modelling Indoor Air Quality									33
7.   Mitigation/Improvement Opportunities								35
     7.1. Hierarchy of Measures									35
     7.2. Implementation of Measures									35
8.   Bibliography											37

Appendix A. Glossary and Abbreviations								41
Appendix B. Conversion of Units									43
Appendix C. Organisations that Publish IAQ Assessment Criteria and Measurement and Testing Protocols 44
Appendix D. RIBA Stages										46
Appendix E. Simple Assessment Case Studies								47
Appendix F. IAQ Measurement and Testing Protocols							50
Appendix G. Examples of Monitoring Equipment							52
Appendix H. Case Studies: Monitoring									54

2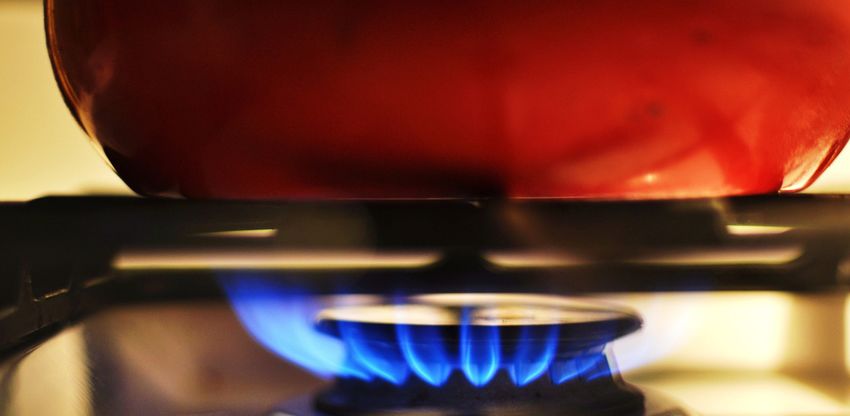
IAQM u GUIDANCE
                                                                                 Indoor Air Quality

Appendix I. Data Quality and Uncertainty								61
Appendix J. Examples of measures to manage IAQ (design, construction, operation and monitoring) 64

Figure 3.1: Summary of Selected Air Quality Criteria							15
Figure 3.2 : Hierarchy of Assessment Criteria								16
Figure 4.1: Schematic of IAQ Sources, Pathways and Receptors						18
Figure 4.2: Determination of the Need for an IAQ Assessment 					19
Figure 4.3 : Stages of an IAQ Assessment 								20
Figure 4.4: Schematic of the Stage 2A Simple Assessment            					22
Figure 5.1: Effect of Averaging Period on Reported Concentration (µg/m3)           			29
Figure 7.1: Hierarchy of Improvement Measures 							36
Figure H1: Carbon Dioxide (CO2) Time in Range (8am-6pm, Mon-Fri)            				55
Figure H2: 15-minute Mean TVOC Concentration Over a 7-day Period					                                      56
Figure H3: Comparison of Outdoor and Indoor PM2.5 Concentrations (Sir John Cass School Urban Background) 56
Figure H4 : Average Internal TVOC Profile by Day            						60

Table 3.1: IAQ Pollutants and their Assessment Criteria 							                                            14
Table 4.1: Magnitude of Potential Harm Caused by Ingress of Ambient (Outdoor) Pollution		 23
Table 4.2: Magnitude of Potential Harm Caused by Emissions from Internal Sources			24
Table 4.3: Potential Duration/Frequency of Exposure of the Most Sensitive Groups of Individuals            26
Table 4.4: IAQ Risk											26
Table 5.1: Range of Sampling Methods Available for IAQ Monitoring					30
Table 5.2: Number of Sampling Points Required Based on Project Area and Number of Floors		 31
Table B1: Common Conversions Between Concentration Units						43
Table C1: Organisations that Publish IAQ Assessment Criteria and Measurement and Testing Protocols 44
Table D1: RIBA Plan of Work: Illustration of Air Quality Input to Design and Construction of New Buildings 46
Table E1: Summary of IAQ Assessment of Prison Staff Exposure in a Prison Wing				47
Table E2: Summary of IAQ Assessment of Nursery School Children in a Ground Floor Classroom		               48
Table E3: Summary of IAQ Assessment of Reception Staff Exposure at a Ground Floor Reception Desk 49
Table F1: Current Indoor Air Quality Guidance								50
Table F2: Typical Individual Sampling Durations for Indoor Air Pollutants					51
Table G1: Examples of Monitoring Equipment								52
Table H1: Monitoring Results, Formaldehyde								57
Table H2: Monitoring Results, TVOCs									58
Table H3: Monitoring Results, Top 10 VOCs								58
Table H4: Summary Statistics for Each Air Quality Parameter Monitored					60
Table I1: Calibration Types and Corresponding Sampling Method						62
Table J1: Design Measures										64
Table J2: Construction Measures									65
Table J3: Operational Measures										67
Table J4: Monitoring Recommendations									67

Box 2.1: Factors Relating to the Effect of a Pollutant on an Individual					11
Box 4.1: Factors to Consider During Assessment								21
Box 4.2: Stage 2A Recommended Further Actions							27
Box 6.1: Main Features of Box Models									33
Box 6.2: Main Features of CFD Models									34

IAQM Indoor Air Quality Guidance: Assessment, Monitoring, Modelling and Mitigation                      3
IAQM u GUIDANCE
                                                                                            Indoor Air Quality

 Acknowledgements
Disclaimer: This Guidance was produced as a result of the             The Institute of Air Quality Management (IAQM): IAQM
voluntary contributions of the members of IAQM’s Indoor               aims to be the authoritative voice for air quality by maintaining,
Air Quality Sub Committee Working Group. This Guidance                enhancing and promoting the highest standards of working
represents the collective view of the IAQM and not necessarily        practices in the field and for the professional development of
those of individual members or those of External Reviewers. All       those who undertake this work. Membership of IAQM is mainly
have commented in their personal capacities and not necessarily       drawn from practising air quality professionals working within
on behalf of the organisations listed below.                          the fields of air quality science, air quality assessment and air
                                                                      quality management.
IAQM thanks Arup, Cundall, Hoare Lea and WSP for permission
to use the case studies in Appendices E and H.                        Graphic Design: Danielle Kopecky
Chair of the Working Group                                            Copyright statement: Copyright of these materials is held
Dr Claire Holman (Air Pollution Services)                             by the members of the Working Group. IAQM encourage the
                                                                      use of the materials but request that acknowledgement of
Co-editors
                                                                      the source is explicitly stated. All design rights are held by the
Carl Hawkings (ADM Ltd)
                                                                      IAQM, unless otherwise stated.
Dr Christine McHugh (Keane & Gray)
                                                                      Suggested citation: IAQM (2021). Indoor Air Quality
Members of the Working Group                                          Guidance: Assessment, Monitoring, Modelling and Mitigation
Roger Barrowcliffe (Clear Air Thinking)                               (version 1.0). Institute of Air Quality Management, London.
Ethny Childs (Secretary, IES)
Emma Gibbons (UCL)
Kieran Laxen (Air Pollution Services)                                 Contact:       IAQM
Oliver Puddle (DustScanAQ)                                            		              c/o Institution of Environmental Sciences
                                                                      		              6-8 Great Eastern Street, London
Chris Rush (Hoare Lea)
                                                                      		              EC2A 3NT
Peter Walsh (WSP)
                                                                            T:        +44 (0)20 3862 7484
External reviewers                                                          E:        info@iaqm.co.uk
Dr Hywel Davies (CIBSE)
Dr Sani Dimitroulopoulou (Public Health England)                      Date: 		       September 2021
Dr Vina Kukadia (University of Surrey)
Dr Gráinne McGill (University of Strathclyde)                         Cover image: Clockwise from top left: © zinkevych | Adobe
Dzhordzhio Naldzhiev (University College London)                      Stock, © Konstantin Yuganov | Adobe Stock, © Monkey
Dr Clive Shrubsole (University College London)                        Business | Adobe Stock, © Pixel-Shot | Adobe Stock
Dr Marcella Ucci (University College London)
Stuart Upton (Building Research Establishment)
Edwin Wealend (Cundall)

CIBSE
IAQM acknowledges the contributions made to this Guidance by
CIBSE members. This guidance is endorsed by CIBSE as a useful
contribution to improving indoor air quality.

Member consultation
The IAQM would like to extend thanks to all those who provided
comments during the member consultation. These comments
played a key role in the development of this document. Consultation
responses can be accessed on the IAQM website.

4
IAQM u GUIDANCE
                                                                                                 Indoor Air Quality

1. Introduction
1.1. Purpose of this Guidance                                              1.2.2. IAQ is just one of a range of factors that affect the quality
                                                                           of an indoor environment. The indoor environment quality
1.1.1. This Guidance has been produced by the Institute of                 (IEQ) also depends on a range of factors such as noise, lighting,
Air Quality Management (IAQM) to assist its members in                     ventilation, airtightness, comfort (temperature and relative
the assessment of indoor air quality (IAQ). It is guidance for             humidity), and décor (BSRIA, 2021). There can be trade-offs
appropriately qualified practitioners and is not intended to be            between different factors where there has not been a holistic
a comprehensive handbook on IAQ.                                           approach to building design (Kukadia & Abela, 2015). For example,
                                                                           a ventilation system can improve IAQ but may lead to additional
1.1.2. It is applicable to proposed and existing buildings of all types    emissions from power generation, which in turn may affect
including residential, commercial, retail, education, community            outdoor air quality and increase greenhouse gas emissions.
facilities and healthcare (except specialist settings such as operating    Some factors (e.g. poor IAQ) may require ventilation rates to be
theatres). The Guidance is not designed to be applicable to other          increased which may in turn increase noise, cost and greenhouse
internal spaces (e.g. underground car parks, basements) but the            gas emissions. Mechanical ventilation systems may also require
principles may still be relevant. It is not intended to supersede          space that could have other uses of greater value for developers
any legal requirement e.g. such as related to occupational health          or occupants. Demand control ventilation using carbon dioxide
exposure in an industrial setting. It can be used to identify IAQ issues   (CO2) as a proxy for general IAQ is a good way of managing
in existing buildings, or to influence the design of proposed buildings    IAQ. Overall, a balance needs to be struck between energy
and buildings undergoing major refurbishment or conversion.                consumption and IAQ.

1.1.3. For proposed buildings, it is important that IAQ is considered 1.2.3. Indoor environments can be varied in their construction,
at an early stage in the design process, to avoid any conflicts            materials, furnishings, layout, use, operation and ventilation
with other design considerations, such as sufficient space for a           type, so while general principles have been described in this
ventilation system, airtightness requirements for energy savings,          document, there is an important role for site specific and ongoing
noise from mechanical ventilation and the location of the air              assessment, whether by monitoring and/or modelling.
intakes. If left late in the process, changes can be difficult to
implement and can potentially be expensive to retrofit.                    1.2.4. The assessment approaches described in this document
                                                                           require professional judgement from a competent and suitably
1.1.4. In addition to IAQM members, this Guidance will be of               experienced IAQ professional, in order to reach a conclusion on
interest to the construction industry (architects, developers,             the overall significance of the impact. Full membership of the IAQM
planners, building services engineers etc.), building owners and           (membership was extended to include IAQ practitioners in 2019),
occupiers, and regulatory authorities (environmental health,               the only professional body specifically for air quality practitioners
building control and planning).                                            in the UK, may be evidence of such competence and experience.
                                                                           Membership of some other professional bodies (e.g. those relating
1.1.5 This Guidance is intended primarily for use in the UK,               to occupational hygiene) having relevance to the practice of IAQ
where the vast majority of IAQM members work. However, it                  assessment may also provide reassurance of competence.
is recognised that the membership of IAQM is international and
that the Guidance may be applied elsewhere. Where this occurs, if          1.2.5.  There are many organisations that are publishing
local conditions and approaches to IAQ assessment are different,           research and tools that will help the professional gain a better
careful consideration will need to be given to its applicability.          understanding of IAQ (e.g. Clean Air London, CIBSE, USEPA).
                                                                           As experience of using this Guidance develops, and as further
1.2. Context                                                               evidence relating to IAQ becomes available, it is anticipated that
                                                                           revisions of this document may become necessary. The most
1.2.1. In the UK, most people spend only a few hours per day               recent version will be available on IAQM’s website.
outdoors (Diffey, 2010), yet relatively little is known of pollution
concentrations inside buildings and other indoor environments.             1.3. Scope
As concentrations of major outdoor air pollutants such as sulphur
dioxide, nitrogen dioxide and particulate matter have reduced, the         1.3.1. This Guidance document focuses on the assessment of
emphasis of practitioners, policy makers and others has moved              exposure of people in a wide range of indoor environments. The
indoors, with increasing understanding of the importance of a good         legislation to protect the public from exposure to air pollution
indoor environment for people’s health, well-being, and productivity.      largely relates to outdoor air. There is no legal protection for

IAQM Indoor Air Quality Guidance: Assessment, Monitoring, Modelling and Mitigation                                                             5
IAQM u GUIDANCE
Indoor Air Quality
the general public in the UK regarding IAQ. However, employers
have a duty of care to their employees and exposure is covered
by Health and Safety at Work legislation.
1.3.2. This Guidance is explicitly not intended to override any
legally defined protections of workers such as those defined in
law related to the Control of Substances Hazardous to Health
(COSHH) and EH40 Workplace Exposure Limits (WELs) (HSE,
2020). However, this legislation does not provide for protection
of the general public inside buildings if it is not their place of
work or, in some cases, if they are not an official visitor. This
creates a contradiction as, if the exposure (concentration and
time) is the same, the risk of health effects is the same whether
the exposure occurs indoors or outdoors and regardless of the
individual’s status as employee, visitor or member of the public.
Consideration of occupational health, in a legal sense, is therefore
outside of the scope of this Guidance.
1.3.3. This Guidance aims to provide clarity regarding an
appropriate approach to protecting human health from exposure
to indoor air pollutants, in a range of indoor locations.
1.3.4. The scope of this Guidance is on polluting chemicals, in
the gas phase in indoor environments, and particulate matter.
Approaches for the assessment of mould, bacteria and viruses
(e.g. SARS-CoV-2), and moisture in buildings are beyond the
scope of this Guidance, but some of the principles may be
applicable. Parameters such as temperature, moisture and
mould are already covered in documents produced by others
e.g. the Chartered Institution of Building Services Engineers
(CIBSE) and the United Kingdom Centre for Moisture in
Buildings (UKCMB). These are important elements that should
be considered in good building design and operation and IAQ
should not be considered in isolation. It is recommended that
IAQ practitioners are involved at the design stages of a proposed
building/refurbishment to ensure that IAQ considerations are
part of the decision making process and an holistic approach
is taken to building design.
1.3.5. This Guidance and method of assessment for pollutants
known to be carcinogenic (e.g. benzene) is not recommended as
guidelines are generally risk based, with no safe limit.
1.3.6. It is unlikely to be feasible to carry out an IAQ assessment
of all potential indoor air pollutants. A suitably comprehensive
approach should seek to evaluate the concentrations of key indoor
air pollutants of interest/concern in specific indoor environments.
1.3.7. Odour is another consideration of IAQ. Many of the
compounds discussed (e.g. Volatile Organic Compounds (VOCs))
in this Guidance have an odour that may vary from pleasant to
offensive, and guidance on reducing the concentration of gaseous
pollutants applies to them as much as to odourless gases. The
perception of odour is mostly subjective and may require input Image: © Carl Hawkings
6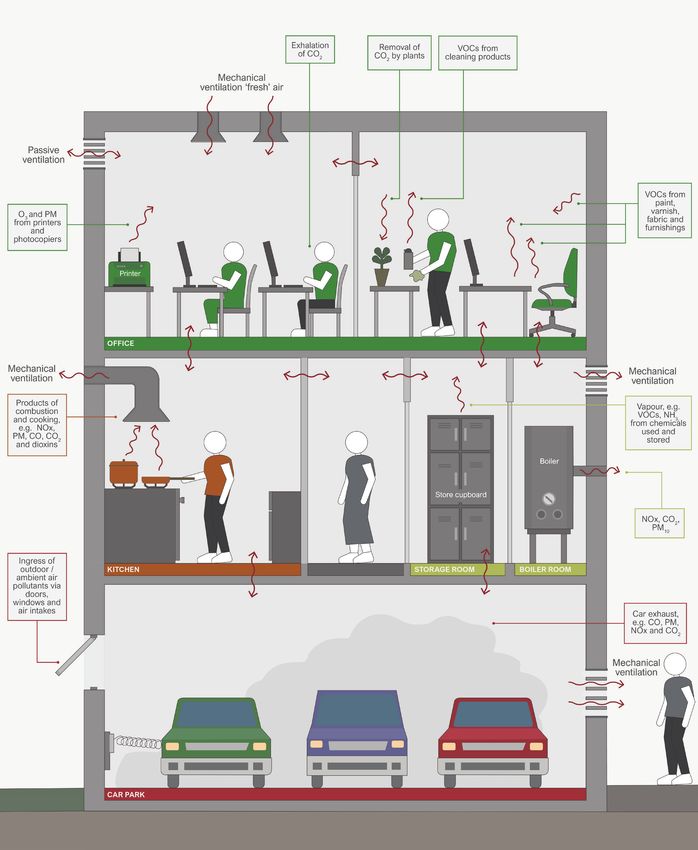
IAQM u GUIDANCE
                                                                                            Indoor Air Quality

from an odour specialist. Therefore, detailed consideration of        1.5. Purpose of an IAQ Assessment
odours is outside of the scope of this Guidance.
                                                                      1.5.1. An assessment of IAQ should ideally be undertaken as
1.3.8. The ingress of potentially toxic chemicals due to natural      part of the scope of an overall air quality assessment required
sources (e.g. radon (PHE, Accessed Jan 2021)) or building on land     for planning, permitting or other purpose. An IAQ assessment
contaminated as a result of the historic uses of the site or          is undertaken for a number of other reasons, including:
neighbouring land, can also affect IAQ. For proposed buildings,
measures should have been put in place during the planning            •   establishing which pollutants are present in an indoor space
process to ensure that the land has been fully remediated before          and how they might affect health and well-being;
construction is permitted.
                                                                      •   assessing occupational exposure compliance with COSHH
1.4. Why IAQ is Important                                                 Regulations/EH40 (HSE, 2020) (N.B. not within the scope
                                                                          of this document);
1.4.1. Air pollution has a significant effect on public health        •   assessing post construction building air quality for
(WHO, 2013). There is good evidence that long term exposure               compliance with building certification schemes such as
to outdoor air pollution can reduce life expectancy (COMEAP,              BREEAM, WELL and LEED (see Appendix A), which may be
2009), mainly due to cardiovascular and respiratory diseases (Royal       prior to or post occupancy (post occupancy appraisal will
College of Physicians, 2016). Recent evidence suggests that it can        include sources such as gas cooking);
also adversely affect many other aspects of human health and
well-being including cognitive ability, and may cause or contribute   •   determination of the performance of buildings and of
to dementia, diabetes, obesity, and low birth weight (WHO, 2016).         ventilation systems and design;
                                                                      •   defining ambient air quality in relation to limits and standards,
1.4.2. It is apparent that exposure to indoor air pollutants              where considered relevant to IAQ;
could have greater significance on human health than outdoor
                                                                      •   identifying the cause of an issue reported by a building’s users;
air for several reasons:
                                                                      •   identifying infiltration and determining the levels of ingress
•   most of us spend more time breathing indoor air than                  of external pollutants;
    outdoor air (WHO, 2013);
                                                                      •   assessing and demonstrating compliance with planning policy
•   buildings have become more airtight to reduce energy                  (e.g. some councils are including specific planning policy
    consumption which reduces uncontrolled ingress of outdoor air;        objectives in local/neighbourhood plans (KNP, 2018); and
•   we may be exposed to a wider range of air pollutants,             •   assessing compliance with building regulations.
    particularly VOCs, inside, than outside; and
•   concentrations of many pollutants are higher inside than
    outside (WHO, 2010).

1.4.3. There is a growing body of evidence (PHE, 2020 and
USEPA, 2021b) of the adverse health effects from exposure to
poor IAQ. These include irritation of the eyes and respiratory
tract, allergies, asthma, central nervous system symptoms, liver
and kidney damage, as well as cancer risks.

1.4.4. Pollutant concentrations indoors are a function of
the source strength and how long they persist indoors. The
latter depends on ventilation, how reactive they are and their
deposition rate. Some pollutants, such as ozone, have a short
lifetime indoors because they either deposit or react with other
pollutants very quickly.

IAQM Indoor Air Quality Guidance: Assessment, Monitoring, Modelling and Mitigation                                                        7
IAQM u GUIDANCE
Indoor Air Quality
2. Background
2.1. Main Pollutants and Their Health Effects associated with dementia, lung cancer, low birth weight, diabetes
(PHE, 2018) and increased mortality (although there is further research
2.1.1. Outdoor air enters buildings through openings such as doors and recommended as opinion is divided) (COMEAP, 2018).
windows, mechanical ventilation systems and by infiltration through
the fabric of buildings. For old and/or poorly constructed buildings, 2.1.4. Particulate Matter (PM) is a complex mixture of solid and
infiltration through the fabric of the building can often be significantly liquid particles suspended in the air, and its composition depends on
higher than for a well constructed/new building. Infiltration of outdoor its origin. In urban areas, the combustion of diesel, brake and tyre wear
air may improve or worsen indoor air quality depending on the quality as well as construction and demolition activities can be important
of the outdoor air relative to the quality of indoor air. local sources. Any dust deposited on roads can be resuspended by
moving traffic. Much of the PM, however, is formed in the atmosphere
2.1.2. There are many additional sources of air pollutants generated from other pollutants and is transported over long distances from the
indoors, some of which are briefly described below with some of emission of its precursors. The UK also periodically experiences mineral
their more important health effects. These internally generated dust pollution from the Sahara Desert. Indoor emission sources
pollutants can accumulate inside buildings and may also exfiltrate include renovation works, cooking (particularly frying), smoking,
the building and adversely affect outdoor air quality. wood burning fires/stoves, burning candles. Clothing, carpets and soft
furnishings also release particles/fibres into the air. In the 1990s, the
2.1.3. Nitrogen dioxide (NO ) is either emitted directly during
2 emphasis of air quality management was on the particles less than
combustion of fuels, such as gas and diesel, or is formed in the 10 µm in diameter (PM10), but from the late 2000s it began to move
atmosphere from nitric oxide (NO), which is also emitted during towards smaller particles that penetrate deeper into the respiratory
combustion. Together NO2 and NO are referred to as oxides of nitrogen system (e.g. PM2.5). A range of health effects including respiratory
(NOx). Almost all (97% in 2019, (BEIS, Accessed May 2021)) emissions of and cardiovascular diseases, cancers and mortality, diabetes and low
NOx in the UK were from the combustion of fuels (vehicles, industry, birthweight have been associated with exposure to PM (PHE, 2018).
space heating boilers etc.). Gas appliances (e.g. cookers) are the main More recently, there is emerging evidence that it may also affect
indoor sources of NOx. Short term exposure to elevated concentrations cognitive ability (Allen, et al., 2017).
of NO2 can cause inflammation of the airways in the lungs (WHO,
2010). It can also increase susceptibility to respiratory infections and 2.1.5. Radon is a radioactive gas and a known cause of lung cancer.
to allergens (COMEAP, 2016). Long term exposure to NO2 has been It is formed by the radioactive decay of small amounts of uranium
Image: © CheapStockImage_com | Pixabay
8
IAQM u GUIDANCE
                                                                                                          Indoor Air Quality

that occur naturally in all rocks and soils and enters buildings from            and its known adverse health effects such as watery eyes, burning
the ground beneath buildings or from the materials from which                    sensations of the eyes, nose, and throat, coughing, wheezing, nausea
they are built. The air in every building contains radon, but the                and skin irritation (PHE, 2019) (Salthammer, 2019). The US EPA has
concentrations are typically low. PHE (now part of the National                  also classified formaldehyde as a probable carcinogen (USEPA, 2010).
Institute for Health Protection (NIHP)) has produced a map of the
risk of radon (PHE, Accessed Jan 2021) and has a Radon Action Level              2.1.11.   Acrolein (C3H4O) causes similar health effects as
of 200 Bq/m3 and a target level of 100 Bq/m3 averaged over a                     formaldehyde (USEPA, 2009) and may be confounding results
year (PHE, Accessed Nov 2020). Radon Affected Areas are defined                  from studies that look at asthma and exposure to formaldehyde
as those with 1% or more homes above the Radon Action Level.                     (Golden & Holm, 2017) (WHO, 2002). Acrolein is generated when
For new homes in Radon Action Areas appropriate mitigation                       heating various oils (e.g. in cooking) above 180oC, is formed from the
measures are incorporated into their design and construction.                    breakdown of certain outdoor air pollutants and tobacco smoking
There has also been a Government programme of remediating                        (Golden & Holm, 2017). One study (WHO, 2002) found acrolein to be
existing homes over the last 30 years (BRE, 2015). The target level              common in indoor environments especially where there was frying
is the ideal outcome for remediation works in existing buildings                 of food, tobacco smoking or proximity to vehicle emissions. A more
and protective measures in new buildings (HPA, 2010).                            recent review (Shrubsole, Dimitroulopoulou, Foxall, Gadeberg, &
                                                                                 Doutsi, 2019) found acrolein to be a low priority in residential settings.
2.1.6. Volatile Organic Compounds (VOCs) have several
definitions (e.g. BS EN16516:2017 Annex G (BSI, 2020)). VOCs are                 2.1.12. Terpenes (α-pinene and d-limonene) are used in cleaning
an important grouping of compounds for IAQ as they are generally                 products, perfumes, and deodorants (Shrubsole, Dimitroulopoulou,
gases at normal room temperatures. The definition of a VOC as a                  Foxall, Gadeberg, & Doutsi, 2019) and can be released during use. They
Very Volatile Organic Compound (VVOC), VOC or Semi-volatile                      are also important in the chemistry of other gases and the formation
Organic Compound (SVOC) is based on the compound’s physical                      of secondary organic aerosols (SOAs) (see Section 2.2).
properties: where the compound elutes on the gas chromatograph
column with respect to n-hexane and n-hexadecane.                                2.1.13. Phthalates used in e.g. PVC floorings, children’s toys, are
                                                                                 released from these products into the air. Phthalates used in some
2.1.7. VOCs are widely used in construction products, furnishings,               products are known carcinogens and asthmagens as well as endocrine
toiletries, fragrances and cleaning products (Naldzhiev, Mumovic,                disruptors (Woolley, 2017).
& Strlic, 2020). Examples of construction products containing
VOCs include surface coatings, timber preservation (Pohleven,                    2.1.14. Other VOCs can be emitted from photocopiers (Cacho, et al., 2013)
Burnard, & Kutnar, 2019), adhesives, sealants, damp proofing and                 and printers (Guo, Gao, & Shen, 2019) and during cooking (He, et al., 2020).
roofing materials (Weigl, et al., 2014 and Woolley, 2017). There
are many thousands of organic compounds that could be in the                     2.1.15. The health effects of VOCs include irritation of the eyes and
indoor environment including: aromatic hydrocarbons, saturated                   respiratory tract, allergies and asthma, effects on the central nervous
aliphatic hydrocarbons (n, -iso, cyclo-), terpenes, aliphatic alcohols,          system, liver, and kidney damage as well as cancer (PHE, 2019). While
aromatic alcohols, glycols, glycol ethers and aldehydes.                         the health impacts of many VOCs are known, there is little evidence
                                                                                 available on the combined effects of a range of many different VOCs,
2.1.8. Total Volatile Organic Compounds (TVOC) refers to the                     nor the combined effects with inorganic pollutants.
sum of the concentrations of the identified and unidentified VOCs,
as specified in BS EN16516:2017. As compounds can vary in toxicity,              2.1.16. Carbon dioxide (CO ) is the major greenhouse gas
                                                                                                                       2

use of TVOC as a measure provides limited information on the                     contributing to climate change but has not traditionally been thought
potential health effects of building occupants, and it is therefore              of as a health related pollutant with local effects at source. The main
important to consider the concentration of key compounds.                        source in buildings is generally people (and animals), who exhale CO2
                                                                                 during respiration. CO2 is also produced indoors from combustion of
2.1.9. Aldehydes (particularly formaldehyde, acetaldehyde and                    carbonaceous fuels e.g. gas cookers/heaters and from fermentation.
acrolein) are widely used in construction and furnishing products                Poorly ventilated buildings, or those with high occupancy rates, can
and are slowly released into the air after construction. They come               result in high concentrations. Plants emit CO2 when respiring (e.g. when
from various sources such as resins, phenol formaldehyde, and urea               there is insufficient light for photosynthesis) and remove CO2 when
formaldehyde (UF) used in wood based products such as particleboard              photosynthesizing. CO2 can also be used as a marker for ventilation
furniture, UF based lacquers and UF foam cavity wall insulation.                 rates, e.g. in the management of viral infection risk.

2.1.10. Formaldehyde (HCHO/CH O) is probably the VOC of 2.1.17. Background CO concentrations are in excess of 400 parts
                                            2                                                                2

greatest importance, due to its prevalence in the indoor environment             per million by volume1 (ppm) (or more than 0.04% by volume) and

1
 Parts per million by volume (ppm) is used here because volume per volume units are the convention for CO2. In Europe, other pollutants are generally expressed
in mass units (e.g. µg/m3). See Appendix B for further explanation and conversion of units.

IAQM Indoor Air Quality Guidance: Assessment, Monitoring, Modelling and Mitigation                                                                           9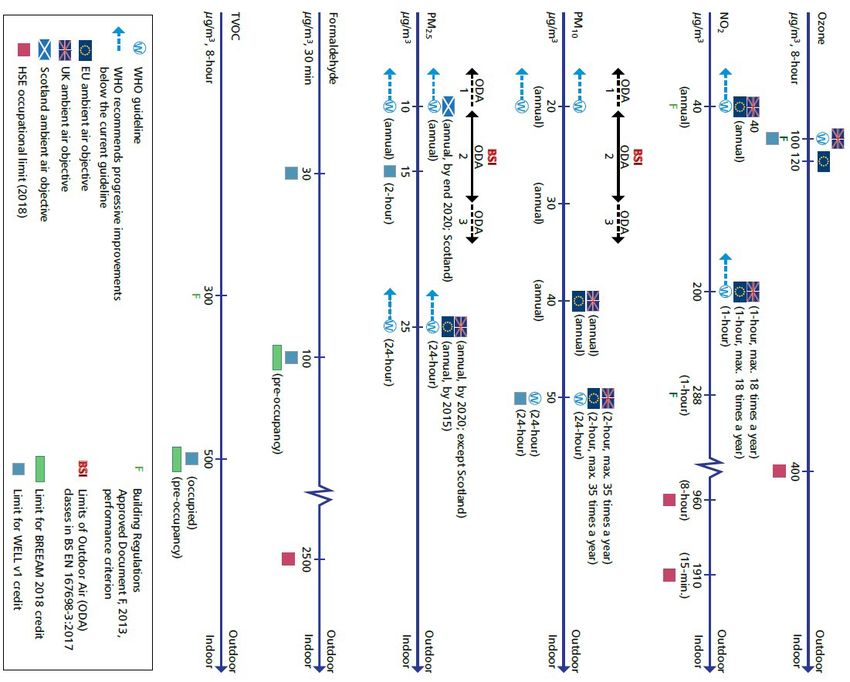
IAQM u GUIDANCE
Indoor Air Quality
are increasing (Lindsey, 2020). One review of the effects of indoor cause unconsciousness and death. There can be serious damage to
exposure to CO2 concluded that there was limited evidence of the central nervous system even without unconsciousness (WHO,
acute impacts to human health or cognition below 5,000 ppm 2000). Exposure to low CO concentrations has been associated with
(Fisk, Wargocki, & Zhang, 2019). Other studies show that elevated a wide range of health effects including reduction of the duration
CO2 concentrations (around 1,000 ppm and above) can impair of active exercise in young adults, and impairment of brain function.
human ability (Bierwirth, 2014 and Allen et al., 2016), induce fatigue Long term exposure to low concentrations of CO exposure can cause
and cause physiological effects such as inflammation and bone cognitive memory deficits, emotional psychiatric changes, cardiac
demineralisation (Jacobson, et al., 2019). Other research shows that events, and low birth weight.
cognition is unaffected or even enhanced (Scully, et al., 2019) at
some elevated concentrations. As concentrations further increase, 2.1.19. Ozone (O ) is produced indoors by some electronic
3
above about 2,000 ppm, exposure over several hours may cause equipment such as printers, photocopiers (Cacho, et al., 2013) and
headaches, sweating and shortness of breath. PHE/NIHP is currently some air cleaning appliances (Salonen, Salthammer, & Morawska,
reviewing the evidence to whether CO2 should be considered as a 2018). It is also produced outdoors from interactions between
pollutant or as an indicator of ventilation rates (Lowther, et al., In NOx and VOCs, with high concentrations of O3 occurring during
preparation). Build-up of CO2 in enclosed/confined spaces is also periods of hot, sunny weather. Exposure to ozone can cause
a cause of serious health impacts and death. asthma, irritation and damage to eyes, nose and the airways,
increase hospital admissions and increase mortality (COMEAP,
2.1.18. Carbon monoxide (CO) is emitted during inefficient 2015). Prolonged exposure to high concentrations can result in
combustion processes. High concentrations indoors are typically damage to the lungs and airway linings (WHO, 2000).
due to the use of incorrectly installed, poorly maintained or poorly
ventilated gas heaters and cookers. Mean concentrations in homes 2.2. Indoor Chemistry
without gas stoves are often in the range 0.5-5 ppm (0.6-6 mg/m3)
(USEPA, 2021a). Near properly adjusted gas stoves, concentrations are 2.2.1. The concentration of an indoor air pollutant is a function
often in the range 5-15 ppm (6-18 mg/m3) and near poorly adjusted of numerous processes including indoor emissions, exchange with
stoves concentrations may be 30 ppm (37 mg/m3) or higher (USEPA, outdoor air, deposition to indoor surfaces, removal by filtration,
2021a). CO preferentially binds to haemoglobin reducing its capacity to and indoor chemistry (Weschler & Carslaw, 2018). Indoor chemistry
transport oxygen around the body. Exposure (to higher concentrations includes the chemical and physical transformations that occur
for a short time or lower concentrations over a longer period) can indoors and is very different to that which occurs outdoors. This is
Image: © A Stockphoto | Adobe Stock
10IAQM u GUIDANCE
Indoor Air Quality
due in part to the much larger surface to volume ratios and the higher concentration of both hydroxyl (HO) and hydroperoxy (HO2) radicals
concentrations of VOCs indoors, but also due to the lower light by several orders of magnitude (Carslaw, Fletcher, Heard, Ingham, &
levels, reduced temperature fluctuations and lack of precipitation. Walker, 2017). A typical indoor concentration of SOAs in suburban UK
is around 1 µg/m3. During cleaning, SOAs may reach concentrations
2.2.2. For reactions between gas phase pollutants to be of 20 µg/m3 (Carslaw, Mota, Jenkin, Barley, & McFiggans, 2012).
important in the indoor environment, the timescale of the
reaction must be competitive with the rate of air exchange, 2.3. Exposure
otherwise the reactants will be removed before significant
reaction can take place. In buildings with lower ventilation rates 2.3.1. The effect of a pollutant on an individual depends on a
there is more time for gas phase chemistry to occur. In general, number of factors (see Box 2.1) all of which need to be considered
the reaction with surfaces, with the exception of reaction with when undertaking an assessment of IAQ.
the surface of airborne particles, is faster than the air exchange
rate, and therefore ventilation rates are not a constraint. New
surfaces soil fairly quickly, and under typical conditions five layers Box 2.1: Factors Relating to the Effect of a Pollutant
of SVOCs accumulate on impermeable surfaces in one to three on an Individual
months. After this period, the reactivity of many indoor surfaces
changes little, with ongoing formation of reactive compounds • The concentration of the pollutant in the various
from the deposition of skin oil, skin flakes, particles and other areas a person may be exposed.
indoor pollutants (Weschler & Carslaw, 2018). • Whether the pollutant is present continuously or
intermittently at each location.
2.2.3. Much indoor air chemistry research has focused on the
reaction between oxidants (O3 and hydroxyl (OH) radicals) and • The period/duration and variability of exposure
VOCs. These reactions generate a complex range of secondary (exposure to high concentrations over a short period
pollutants, some of which also have human health effects. The can result in the same effect as exposure to low
main route of formation of OH indoors is through reaction of concentrations for a longer period but this is not
O3 with alkenes and monoterpenes. Once formed, OH can react always the case).
with other terpenes and organic compounds, to form, amongst • Whether the body accumulates, destroys or excretes
other compounds, aldehydes such as formaldehyde. The rate of the pollutant.
reaction of O3 with some VOCs is enhanced on surfaces compared
to the gas phase; e.g. the gas phase reaction of benzo(a)pyrene • The susceptibility of the individual (e.g. those with pre-
(BaP) with ozone is negligible but when BaP is absorbed onto existing diseases such as asthma, Chronic Obstructive
glass it produces a range of epoxides (Weschler & Carslaw, 2018). Pulmonary Disease (COPD), cystic fibrosis will be much
higher, those who are pregnant, older people).
2.2.4. Photolysis (decomposition/separation by the action • Whether there is a threshold concentration below
of light) occurs indoors but more slowly than outdoors. which there is no known adverse effect.
Reactions requiring higher energy light such as O3 photolysis
are attenuated more indoors relative to outdoors than those • Exposure to several pollutants may produce effects
reactions requiring less energy such as the photolysis of that are greater than the sum of the effect of each, but
formaldehyde (Weschler & Carslaw, 2018). these potential combined effects are outside the scope
of this guidance and are not always fully understood.
2.2.5. Secondary organic aerosols (SOAs), that are particles, can be
formed indoors from the reaction of O3 with terpenes and terpene
alcohols. The concentrations of these terpenoid compounds tend 2.3.2. IAQM recommends that an IAQ Assessment is based
to be much higher indoors than outdoors. The less volatile reaction on the most sensitive type of person likely to be present at the
products condense onto existing particles or nucleate, producing location or locations being assessed (this may not be the same
SOA that can grow to 0.7 µm in diameter (Rohr, Weschler, Koutrakis, type of person in all locations being assessed) unless measures
& Spengler, 2003). The production of SOA can be episodic, such as have already been taken to minimise exposure of some people
during the use of scented cleaning products or relatively continuous, (e.g. by limiting access to part of a building).
as occurs with the use of plug in air fresheners. Other gas phase
reactions and surface chemistry can also be important indoor 2.3.3. Better and more comprehensive data on air quality
sources of SOAs (Weschler & Carslaw, 2018). and exposure (i.e. time activity profiles e.g. (Dimitroulopoulou,
Ashmore, & Terry, 2017)) to a range of pollutants in different
2.2.6. Some commercially available indoor air cleaning devices types of indoor environments are needed to fully understand
and surface cleaning products have been shown to increase the the impacts of indoor air pollution on human health. What we
IAQM Indoor Air Quality Guidance: Assessment, Monitoring, Modelling and Mitigation 11IAQM u GUIDANCE
Indoor Air Quality
do know is that the indoor environment is complex with many 2.4.5. To reduce energy consumption, mechanical ventilation
different chemicals present. These chemicals are likely to change systems may extract the heat from the exhaust air, and recirculate
in the future as product formulations change. It is important that the air, which can exacerbate the overheating problem. Mechanical
IAQ practitioners keep up to date with these changes. ventilation systems can be designed to avoid overheating and
whilst taking up space and additional capital and operational
2.4. Other Indoor Environmental Conditions costs, some modern systems do not incur substantial extra
cost or require much if any additional space. The avoidance of
2.4.1. Healthy indoor environments can enhance the lives and overheating should be an important consideration in the design
health of the occupants (BESA, 2021), making people more productive of proposed buildings. Free standing air conditioning systems
and reducing sick days. There is growing interest in improving the (and some integrated systems) recirculate air which can lead to
health and well-being of employees by investing in measures that pollutants building up over time.
improve the working environment in terms of air quality and other
factors. However, there may be conflicts between IAQ and other 2.4.6. To a lesser extent, cold temperatures in the working
environmental considerations such as noise generation and energy environment can also reduce productivity although in most
efficiency (Kim & Choi, 2019) (e.g. see this guide to energy efficiency indoor environments it is easier to improve the situation (by
and ventilation systems (Liddament, 1996)). Ventilation rates may be local heating, extra clothing etc.) than is the case for elevated
reduced at certain times (e.g. night-time weekends) which will facilitate temperatures.
deposition of airborne particles, that may get resuspended when air
flow is increased (by increased ventilation or human activity). 2.4.7. Building designers and managers need to balance the
production of good indoor environments, where people feel
2.4.2. According to The World Green Building Council (World comfortable and perform well, with energy efficiency and use.
Green Building Council, 2016) employees can account for up to The best way to prevent high indoor pollutant concentra-
90% of operating costs. Developers and landlords also recognise tions is to eliminate or control them at source. If this is not
that healthy buildings can improve sales, command higher rental possible, the next approach is good ventilation and filtration
incomes, and attract and retain tenants in longer term leases may be appropriate; this can be e.g. filtering outdoor air prior
(Kukadia & Upton, 2019). to introduction to the indoor space or recirculating filters (e.g.
cooker extraction hoods) (Kukadia & Upton, 2019).
2.4.3. Passive control of IAQ (and comfort) is preferable to
active/mechanical measures. Where appropriate (taking into 2.4.8. In some cases, especially in tall buildings, the flow of
account issues such as security, outdoor air quality, heat loading), air caused by temperature or pressure differences between the
natural ventilation/opening windows is preferred to mechanical top and bottom of the building may transport polluted air from
ventilation. Mechanical ventilation requires energy (and therefore street level through the building (e.g. up the lift shafts) (known as
may increase emissions) and produces noise. Mechanical ventilation the “stack effect”). Ventilation (natural or mechanical) may not
and heat recovery systems require good design and maintenance be the primary solution to improve IAQ in these cases.
to ensure filtration delivers the required performance and they do
not contribute to poor IAQ. Passive ventilation may not achieve
the required ventilation rates as it often relies on local action/
inaction by the occupants (e.g. opening/closing windows) and
so mechanical ventilation may be the only option in some cases.
Where mechanical ventilation is required, heat recovery should
be considered. The choice of construction/insulation materials
and shading can also reduce the need for heating/cooling of a
building which again may impact air quality inside and out.
2.4.4. The sealing of building façades, and the use of mechanical
ventilation has been used to improve energy efficiency and
reduce the ingress of noise and air pollution in urban areas (see
Guidance (CIBSE, 2017b) (ANC & IOC, 2020)). It is important that
the position of the intake to the mechanical ventilation system is
located away from local pollutant sources (Kukadia & Hall, 2011)
(Cheng, Kukadia, & Hall, 2014). The sealing of building façades can
lead to unacceptably high temperatures inside buildings (known
as overheating), particularly in the summer and if the building
has not adequately taken this account in the design stage.
12IAQM u GUIDANCE
Indoor Air Quality
3. Assessment Criteria
3.1. Introduction 3.1.5. Occupational health is normally assessed in relation to
exposure over averaging periods of minutes to a few hours (usually
3.1.1. Assessment criteria for outdoor air quality are well up to 8 hours). Health based air quality guidelines for the general
established and often have legal/statutory status (e.g. (UK population (non-occupational exposure) are intended to protect
Government, 2010)) and provide clarity regarding the applicable the most sensitive individuals and relate to averaging periods ranging
time period and location of exposure. By contrast, there are no from less than one hour to a year. This leads to big differences in
consistent formal IAQ assessment criteria for covering the different the numerical values for the various standards/guidelines e.g. the
indoor environments and people with different sensitivities to occupational exposure 8 hour limit for NO2 of 960 µg/m3 is over
air pollution (e.g. children, elderly, the sick). There is no primary 20 times higher than the long term UK Air Quality Objective (AQO)
legislation in the UK that requires IAQ standards, applicable to all (applicable outdoors) (DEFRA, Accessed May 2021) and the WHO
indoor environments, to be achieved although indoor air quality guideline (WHO, 2000) which are both 40 µg/m3 averaged over
criteria are available e.g. (PHE, 2019) (WHO, 2010)). The situation in one year (used to assess outdoor exposure but this value is also
other countries e.g. The Netherlands is different, where indoor air applicable to indoor exposure (MHCLG, 2021b)).
quality is part of public health legislation and applies equally to
both indoor and outdoor environments (RIVM, Accessed May 2021). 3.1.6. In schools, employees in certain circumstances (e.g.
laboratories) are covered by the COSHH workplace legislation
3.1.2. Health and Safety at Work legislation does not apply to whereas the pupils, and other staff in situations (e.g. where they
people in their home (occupied dwellings), or users of a facility are not working with chemicals or other hazardous substances)
run by volunteers which is not, therefore, a workplace. This leads are covered by Government Guidance (Education and Skills
to gaps and contradictions between exposure of different people Funding Agency, 2018).
in the same location and between indoor and outdoor criteria.
Appendix C gives further information on organisations that have 3.1.7. COSHH workplace exposure limits (WELs) given in EH40
set assessment criteria and their averaging times. Some air quality (HSE, 2020) apply to healthy adults in occupational settings,
criteria are shown in Table 3.1 and Figure 3.1 (taken with permission working at normal rates for normal shift periods (Channing, 2013).
from (CIBSE, 2020a)). They are not aimed at exposure of more vulnerable individuals,
or people who occupy buildings on a more permanent basis (e.g.
3.1.3. The WHO have recently published revised AQ guidelines and office workers and building occupants). Some workplaces include
interim targets (WHO, 2021). These are applicable to both indoor and people with underlying health conditions that makes them more
outdoor air quality and are included in Table 3.1; some WHO guidelines susceptible to the effects of polluted air.
previously published are still valid and have not been updated. Interim
targets are to guide the improvement of air quality towards the ultimate 3.1.8. Where legislative and regulatory criteria have the same
and timely achievement of the AQ guidelines for those countries that averaging time as an outdoor AQO, the regulatory value is often
exceeded the AQ guidelines. This Guidance has been written with higher than the AQO, providing less protection to an employee
previous WHO guidelines (WHO, 2005, WHO, 2010) in mind and the at work than to a member of the public outdoors e.g.:
methodology and all further statements about WHO guidelines relate
to these and not the new guidelines and interim targets. Professional • the 8 hour WEL for carbon monoxide is 35 mg/m3 compared
judgement should be used to ensure that IAQ assessments take into to the 8 hour UK AQO of 10 mg/m3; and
account the potential health effects if IAQ is likely to exceed these • Approved Document F1 (MHCLG, 2010a) gives two values for
new and tougher guidelines. 8 hour carbon monoxide concentrations in a non-dwelling:
10 mg/m3 (implied that this value applies in offices) and
3.1.4. The UK Health and Safety Executive (HSE) requires (HSE, 2021) 35 mg/m3 for “occupational exposure” (implied that this
that an employer “…should carry out a suitable and sufficient assessment value applies in industrial settings).
of the risk to the health of your employees and any other person
who may be affected by your work, if they are exposed to substances 3.1.9. WHO IAQ guidelines (WHO, 2010) apply to all indoor
hazardous to health.” This clearly applies to a visitor to industrial premises environments. However, they do not include assessment criteria for
or a member of the public passing roadworks. However, it is not clear all substances that can be found in indoor environments e.g. terpenes,
whether non employees (e.g. residents and patients in a care home) perfluoroalkyl substances and phthalates. The PHE guidelines (PHE, 2019)
are covered by the same legislation as employees, even though they are an initial assessment of the most health relevant and frequently
may be exposed to the same IAQ. Residents may, indeed, be exposed occurring VOCs in homes and offices and, similarly, do not cover all
for longer periods than workers at a care home. the substances found in indoor environments, in the current version.
IAQM Indoor Air Quality Guidance: Assessment, Monitoring, Modelling and Mitigation 13IAQM u GUIDANCE
Indoor Air Quality
Table 3.1: IAQ Pollutants and their Assessment Criteria
Pollutant Averaging time Guideline concentration (µg/m3)(a)(b)(d)
1-hour mean 200 (WHO, 2010) (WHO, 2005)
NO2 24-hour mean(f) 25 (WHO, 2021)
Annual 40 (WHO, 2010), 10 (WHO, 2021)
24-hour mean(f) 50 (WHO, 2005), 45 (WHO, 2021)
PM10
Annual 20 (WHO, 2005), 15 (WHO, 2021)
24-hour mean (f)
25 (WHO, 2005), 15 (WHO, 2021)
PM2.5
Annual 10 (WHO, 2005), 5 (WHO, 2021)
CO2 ‘Occupied period’ 1,000 ppm (BB101 and CIBSE)
15-minute mean 100,000 (WHO, 2010)
1-hour mean 35,000 (WHO, 2010)
CO
8-hour mean 10,000 (WHO, 2010)
24-hour mean(f) 4,000 (WHO, 2021)
8-hour mean (f)
100 (WHO, 2005), 100 (WHO, 2021)
O3
Peak season(g) 60 (WHO, 2021)
TVOC(c) 8-hour mean 300 (ADF, (MHCLG, 2010a)
Acrolein(d) N/A(d) 0.1-0.5 (WHO, 2002)(d)
30-minute mean 100 (WHO, 2010)
Formaldehyde
Annual 10 (PHE, 2019)
Carcinogen; no safe level. Excess lifetime risk of leukaemia at
Benzene Not applicable
1 µg/m3 is 6x10⁻⁶ (WHO, 2010)
Acetaldehyde 1-hour mean 1,420 (PHE, 2019)
α- pinene 30-minute mean 45,000 (PHE, 2019)
d-limonene 30-minute mean 90,000 (PHE, 2019)
Radon (Rn) Annual 200 Bq/m3 (PHE, Accessed Nov 2020)(e)
(a) See Appendix B for conversion of units.
(b) Ensure reference conditions (temperature, pressure etc.) are considered.
(c) Monitoring TVOC will provide no information regarding the nature of the individual compounds present, their concentrations or possible toxicity.
(d) Acrolein is a WHO tolerable concentration (TC) not a guideline, based on the inhalation route, lowest observable adverse effects level (LOAEL) divided
by a safety factor. The LOAEL is based on long term exposure but an averaging period is not specified. Any monitoring should be representative of long
term (annual or greater) exposure.
(e) This is not a health based threshold criterion but rather a trigger level for action/indicator for IAQ.
(f) 99th percentile (i.e. 3–4 exceedance days per year).
(g) Average of daily maximum 8-hour mean O3 concentration in the six consecutive months with the highest six-month running-average O3 concentration.
14IAQM u GUIDANCE
Indoor Air Quality
Figure 3.1: Summary of Selected Air Quality Criteria
IAQM Indoor Air Quality Guidance: Assessment, Monitoring, Modelling and Mitigation 15IAQM u GUIDANCE
Indoor Air Quality
3.2. Derived Assessment Criteria 3.2.4. If guidance from public health organisations is not
forthcoming in the required timescale for the IAQ Assessment,
3.2.1. Assessment criteria are sometimes derived by reducing criteria derived from occupational health limits may be used. They
WELs by a factor. One approach often used in the industry and may be applied as specified or with factors applied to derive values
suggested in D1 (HMIP, 1993) for outdoor air is to take an 8-hour WEL more appropriate to the exposure duration or the sensitivity of
(HSE, 2020) and divide it by a factor of 4 (to account for continuous the receptors, as described in Section 3.2.1. The IAQ Assessment
exposure (168 hours a week) compared to 40 hours for a normal Report must justify any derived criteria and document discussions
working week) and then to divide this value by 10 to account for with any public health organisation.
the most sensitive individuals in the general population. This
results in an assessment criterion 1/40th (2.5%) of the 8-hour WEL. 3.3. Hierarchy of Assessment Criteria
3.2.2. For some pollutants (e.g. those with higher toxicity, or carci- 3.3.1. For settings where applicable legislation or Government
nogenicity) a sensitivity factor of 25 has been used, giving an overall guidance relating to IAQ exists, this should be used for the assessment
factor of 1/100th (1% of the 8-hour WEL). Another approach defined in of IAQ. For those settings and user groups not covered by legislation
EH75/2 (HSE, 2000) suggests that continuous exposure of individuals at or Government guidance IAQ should be assessed using the hierarchy
work (i.e. 24 hours per day/7 days a week e.g. as in a military submarine) of assessment criteria in Figure 3.2. The hierarchy is that WHO (WHO,
could be assessed against the relevant WEL divided by 5. However, these 2010) and PHE (PHE, 2019) guidelines for IAQ take priority followed
approaches lead to criteria that are not directly based on toxicological by WHO guidelines for outdoor air. If these sources do not include a
or epidemiological data and may not be appropriate for non-industrial relevant criterion the assessor should make contact with the relevant
indoor settings and/or the general population. public health organisation (e.g. PHE, PHW, PHS, PHA) for advice on an
appropriate assessment criterion, for non-industrial indoor settings
3.2.3. IAQM recommends that in the absence of a suitable published (e.g. homes, schools, offices) and the general population. The WELs
criterion for a substance of interest, the assessor should refrain from should generally not be applied directly as they are for healthy workers
assessing indoor exposure against any criterion, or if one is needed exposed to chemicals for normal shift periods.
(e.g. in order to finalise design or interpret monitoring data) steps are
taken to obtain guidance from the relevant public health organisation, 3.3.2. In all cases, if there is a range of applicable values the most
for non-industrial indoor settings. Whichever approach is selected, a stringent assessment value should be used unless justification can
full justification should be provided in the IAQ Assessment Report. be provided.
Figure 3.2: Hierarchy of Assessment Criteria
WHO guidelines for indoor air quality (WHO, 2010) and
PHE guidelines for indoor air quality (PHE, 2019)
Proceed to next step if no
appropriate level available
WHO guidelines for outdoor air quality (WHO, 2000 and WHO, 2005)
Proceed to next step if no
appropriate level available
Consult relevant public health organisation
16IAQM u GUIDANCE
Indoor Air Quality
4. Assessment Approach
4.1. Introduction assessment e.g. there are complaints about IAQ from occupants
or a developer wants to achieve a BREEAM ‘excellent’ rating.
4.1.1. This Chapter sets out the general approach for carrying out
IAQ assessments. Most assessments will be for a proposed building/ 4.1.7. For pollution to cause an effect there must be a source, a
major refurbishment, referred to as ‘proposed build’ from here onwards, pathway and a receptor. There may be a single source, or multiple
although IAQ assessments are also made for existing buildings to review sources emitting a single pollutant or, more likely, a mixture of many
the results of monitoring for IAQ, improve well being and occupant pollutants. The pathway is the route by which the pollution can move
health or to resolve a problem such as complaints from occupants. from the source to a receptor and includes any transformation that
may take place such as the formation of secondary pollutants through
4.1.2. For many new build projects in the UK, the overall project chemical reactions, dilution through dispersion/ventilation and loss
programme can be linked to the Royal Institute of British Architects of pollutant due to deposition onto surfaces. The receptor is, in the
(RIBA) plan of work which is a recognised structure for building context of IAQ, generally a human occupant of the building exposed
development in the UK and divides projects into seven stages. to the air pollutant.
The RIBA project stages are set out in Appendix D and provide an
illustration of the stages during design, construction and fit out, at 4.1.8. There may be circumstances where the receptor is an inanimate
which consideration of IAQ may be required. It is typically easier object (e.g. a computer/server in a data centre, food preparation areas,
and cheaper to resolve any potential IAQ issues early in the design other industrial activities such as paint finishing or microelectronics
stage than to identify and implement them after completion of the where clean rooms are required). There may be special requirements for
building. Not all projects will strictly follow the RIBA plan, in which monitoring in these locations (e.g. electronic equipment may be sensitive
case, the stage at which an IAQ consultant’s work interacts with the to some techniques which may generate a corrosive atmosphere or
plan of works is not always clear. For some projects, an issue will be produce electrical interference) and there may be specific guidance
identified at the handover or, more likely, at the post occupancy related to the circumstances (Data Centers, Accessed May 2021).
stage (RIBA Stage 7).
4.1.9. The Source Pathway Receptor Model is shown in Figure 4.1.
4.1.3. An ambient (outdoor) air quality assessment (e.g. of a new
development) often includes receptors such as schools, hospitals, 4.1.10. If any part of the Source Pathway Receptor Model is missing
and homes and assesses outdoor air quality only, equating outdoor or broken (no receptor, no pathway and/or no source) there is
air quality to potential indoor exposure of the occupants. This unlikely to be a need for an IAQ Assessment. Figure 4.2 provides a
does not allow for any attenuation of the building which can vary flow chart illustrating considerations used to determine the need
considerably. Some studies have shown that buildings can reduce for an IAQ Assessment; the order in which the source, pathway
indoor concentrations by up to 73% of outdoor concentrations and/or receptor is considered is flexible.
(Walsh, 2020). A study of London schools showed that the buildings
attenuated outdoor concentrations by 20-40% (see Appendix E). 4.1.11. If an IAQ Assessment is required, the staged process shown
below and in Figure 4.3 should be used to determine the appropriate
4.1.4. A subject often neglected is the selection of building materials level of detail required. Not all stages may be required and professional
and their effect on IAQ. Woolley, 2017 is a provocative and thought- judgement should be applied. These stages are described in more
provoking contribution to this debate. Ideally, an appropriately detail in Sections 4.2 and 4.3, and may vary in application depending
qualified consultant (which may require the combined expertise of on whether the assessment is of an existing or proposed building.
air quality, materials and/or building specialists) should be engaged
by the developer to provide advice, including on the specifications • Stage 1: Scoping Study (to define level of assessment required)
for construction and fit out materials. • Stage 2: Assessment
4.1.5. It is important to think about IAQ when considering the • Simple assessment: Source Pathway Receptor
fitting out and operation of a building (see e.g. (ASPB, 2021) for details • Detailed assessment: monitoring &/or modelling
of the IAQ impact of certain products and materials). An IAQ Plan
• Stage 3: Mitigation/improvement opportunities
for the operation of a building is often developed during the design
stage and as part of the BREEAM application process (BRE, 2014). • Stage 4: Reporting
4.1.6. An IAQ assessment needs to consider a range of issues 4.1.12. Transparency and clarity in reporting is essential. Section 4.5.1
and the methodology will depend on the specific reason(s) for the provides guidelines for reporting on the assessment and decision making.
IAQM Indoor Air Quality Guidance: Assessment, Monitoring, Modelling and Mitigation 17You can also read