Investor Presentation Seaport Global Acquisition Corp - September 2021
←
→
Page content transcription
If your browser does not render page correctly, please read the page content below
Investor Presentation

Seaport Global Acquisition Corp.

                   September 2021

    © 2021 Redbox Automated Retail, LLC. Proprietary and Confidential
Important Information About the Business Combination and Where to Find It
In connection with the proposed business combination, Seaport Global Acquisition has filed a preliminary proxy statement and intends to file a definitive proxy statement with the Securities and Exchange Commission (“SEC”). The preliminary and definitive proxy
statements and other relevant documents will be sent or given to the stockholders of Seaport Global Acquisition as of the record date established for voting on the proposed business combination and will contain important information about the proposed business
combination and related matters. Stockholders of Seaport Global Acquisition and other interested persons are advised to read, the preliminary proxy statement and any amendments thereto and, once available, the definitive proxy statement, in connection with
Seaport Global Acquisition’s solicitation of proxies for the meeting of stockholders to be held to approve, among other things, the proposed business combination because the proxy statement will contain important information about Seaport Global Acquisition,
Redbox and the proposed business combination. When available, the definitive proxy statement will be mailed to Seaport Global Acquisition’s stockholders as of a record date to be established for voting on the proposed business combination. Stockholders will also
be able to obtain copies of the proxy statement, without charge, once available, at the SEC’s website at www.sec.gov/ or by directing a request to: Seaport Global Acquisition Corp., 360 Madison Avenue, 20th Floor, New York, NY 10017, Attention: Secretary,
telephone: (212) 616-7700. The information contained on, or that may be accessed through, the websites referenced in this communication is not incorporated by reference into, and is not a part of, this communication.

Participants in the Solicitation
Seaport Global Acquisition, Redbox and their respective directors and executive officers may be deemed participants in the solicitation of proxies from Seaport Global Acquisition’s stockholders in connection with the business combination. Seaport Global
Acquisition’s stockholders and other interested persons may obtain, without charge, more detailed information regarding the directors and officers of Seaport Global Acquisition in Seaport Global Acquisition’s final prospectus filed with the SEC on December 1, 2020
in connection with Seaport Global Acquisition’s initial public offering. Information regarding the persons who may, under SEC rules, be deemed participants in the solicitation of proxies to Seaport Global Acquisition’s stockholders in connection with the proposed
business combination is set forth in the proxy statement for the proposed business combination. Additional information regarding the interests of participants in the solicitation of proxies in connection with the proposed business combination is included in the proxy
statement that Seaport Global Acquisition has filed with the SEC.

No Offer or Solicitation
This communication shall neither constitute an offer to sell or the solicitation of an offer to buy any securities, nor shall there be any sale of securities in any jurisdiction in which the offer, solicitation or sale would be unlawful prior to the registration or qualification
under the securities laws of any such jurisdiction.

Confidentiality Notice and Undertaking
As used herein: "Evaluation Material" refers to this presentation and any other information regarding Seaport Global Acquisition or Redbox furnished or communicated to the recipient by or on behalf of Seaport Global Acquisition or Redbox, other than information
that is already public. The recipient acknowledges that Seaport Global Acquisition and Redbox consider the Evaluation Material to include confidential, sensitive and proprietary information and agrees that it shall keep the Evaluation Material confidential; provided
however that (i) it may make any disclosure of such information to which Seaport Global Acquisition or Redbox gives its prior written consent and (ii) any of such information may be disclosed to it, its affiliates and their respective partners, directors, officers,
employees, agents, advisors and other representatives (collectively, "Representatives") (it being understood that such Representatives shall be informed by it of the confidential nature of such information and shall be directed by the recipient to treat such information
in accordance with the terms of this notice and undertaking). The recipient agrees to be responsible for any breach of this notice and undertaking that results from the actions or omissions of its Representatives. The recipient shall be permitted to disclose the
Evaluation Material in the event that it is required by law or regulation or requested by any governmental agency or other regulatory authority (including any self-regulatory organization) or in connection with any legal proceedings. The recipient agrees that it will
notify Seaport Global Acquisition and Redbox as soon as practical in the event of any such disclosure (other than at the request of a regulatory authority), unless such notification shall be prohibited by applicable law or legal process. The recipient acknowledges and
agrees that Seaport Global Acquisition and Redbox and their respective affiliates shall not have any liability related to the unauthorized misuse of this presentation or any related marketing materials by any recipient or any of its Representatives.

Forward-Looking Statements
This communication includes certain statements that are not historical facts but are forward-looking statements for purposes of the safe harbor provisions under the United States Private Securities Litigation Reform Act of 1995. Forward-looking statements generally
are accompanied by words such as “believe,” “may,” “will,” “estimate,” “continue,” “anticipate,” “intend,” “expect,” “should,” “would,” “plan,” “predict,” “potential,” “seem,” “seek,” “future,” “outlook,” and similar expressions that predict or indicate future
events or trends or that are not statements of historical matters. All statements, other than statements of present or historical fact included in this communication, regarding Seaport Global Acquisition’s proposed business combination with Redbox, Seaport Global
Acquisition’s ability to consummate the transaction, the benefits of the transaction and the combined company’s future financial performance, as well as the combined company’s strategy, future operations, estimated financial position, estimated revenues and losses,
projected costs, prospects, plans and objectives of management are forward-looking statements. These statements are based on various assumptions, whether or not identified in this communication, and on the current expectations of the respective management of
Seaport Global Acquisition and Redbox and are not predictions of actual performance. These forward-looking statements are provided for illustrative purposes only and are not intended to serve as, and must not be relied on as, a guarantee, an assurance, a prediction
or a definitive statement of fact or probability. Actual events and circumstances are difficult or impossible to predict and will differ from assumptions. Many actual events and circumstances are beyond the control of Seaport Global Acquisition or Redbox. Potential
risks and uncertainties that could cause the actual results to differ materially from those expressed or implied by forward-looking statements include, but are not limited to, changes in domestic and foreign business, market, financial, political and legal conditions; the
inability of the parties to successfully or timely consummate the business combination, including the risk that any regulatory approvals are not obtained, are delayed or are subject to unanticipated conditions that could adversely affect the combined company or the
expected benefits of the business combination or that the approval of the stockholders of Seaport Global Acquisition or Redbox is not obtained; failure to realize the anticipated benefits of business combination; risk relating to the uncertainty of the projected financial
information with respect to Redbox; the amount of redemption requests made by Seaport Global Acquisition’s stockholders; the overall level of consumer demand for Redbox’s products; general economic conditions and other factors affecting consumer confidence,
preferences, and behavior; disruption and volatility in the global currency, capital, and credit markets; the financial strength of Redbox’s customers; Redbox’s ability to implement its business and growth strategy; changes in governmental regulation, Redbox’s
exposure to litigation claims and other loss contingencies; disruptions and other impacts to Redbox’s business, as a result of the COVID-19 pandemic and government actions and restrictive measures implemented in response, and as a result of the proposed
transaction; Redbox’s ability to retain and expand customer relationships; competitive pressures from many sources, including those using other distribution channels, having more experience, larger or more appealing inventory, better financing, and better
relationships with those in the physical and streaming movie and television industries; developments in the home video distribution market as newer technologies and distribution channels compete for market share, and Redbox experiences a secular decline in the
physical rental market; the impact of decreased quantity and quality of movie content availability for physical and digital distribution due to changes in quantity of new releases by studios, movie content failing to appeal to consumers’ tastes, increased focus on
digital sales and rentals, and other general industry-related factors; the termination, non-renewal or renegotiation on materially adverse terms of Redbox’s contracts or relationships with one or more of its significant retailers or studios; Redbox’s inability to obtain
licenses to digital movie or television content for home entertainment viewing; Redbox’s reliance upon a number of partners to make its digital service available on their devices; unforeseen costs and potential liability in connection with content Redbox acquires,
produces, licenses and/or distributes through its service; the impact of the COVID-19 pandemic on Redbox’s business, results of operations and financial condition, its suppliers and customers and on the global economy; the impact that global climate change trends
may have on Redbox and its suppliers and customers; Redbox’s ability to protect patents, trademarks and other intellectual property rights; any breaches of, or interruptions in, Seaport Global Acquisition’s information systems; fluctuations in the price, availability
and quality of electricity and other raw materials and contracted products as well as foreign currency fluctuations; changes in tax laws and liabilities, tariffs, legal, regulatory, political and economic risks.

More information on potential factors that could affect Seaport Global Acquisition’s or Redbox’s financial results is included from time to time in Seaport Global Acquisition’s public reports filed with the SEC, including its Annual Report on Form 10-K, Quarterly
Reports on Form 10-Q, and Current Reports on Form 8-K as well as the preliminary proxy statement that Seaport Global Acquisition has filed and the definitive proxy statements that Seaport Global Acquisition intends to file with the SEC in connection with Seaport
Global Acquisition’s solicitation of proxies for the meeting of stockholders to be held to approve, among other things, the proposed business combination. If any of these risks materialize or Seaport Global Acquisition’s or Redbox’s assumptions prove incorrect, actual
results could differ materially from the results implied by these forward-looking statements. There may be additional risks that neither Seaport Global Acquisition nor Redbox presently know, or that Seaport Global Acquisition and Redbox currently believe are
immaterial, that could also cause actual results to differ from those contained in the forward-looking statements. In addition, forward-looking statements reflect Seaport Global Acquisition’s and Redbox’s expectations, plans or forecasts of future events and views as
of the date of this communication. Seaport Global Acquisition and Redbox anticipate that subsequent events and developments will cause their assessments to change. However, while Seaport Global Acquisition and Redbox may elect to update these forward-looking
statements at some point in the future, Seaport Global Acquisition and Redbox specifically disclaim any obligation to do so, except as required by law. These forward-looking statements should not be relied upon as representing Seaport Global Acquisition’s or
Redbox’s assessments as of any date subsequent to the date of this communication. Accordingly, undue reliance should not be placed upon the forward-looking statements.

                                                                                                                                           –2–
Redbox Universe at a Glance
      OUR VISION
       Redbox provides quality
       home entertainment                                                                                          40 million                       39 million

       for everyone
                                                                                                                    C U S TO ME R S              L O YA L TY ME MB E R S

                                                                                                                    400 million                     46 million+
                                                                                                                     EST W EEKLY                       E MA I L
                                                                                                                         R E TA I L                 SUBSCRIBERS
                                                                                                                   I MP R E S S I O N S ( 1 )

                                                                  OUR MISSION                                       600 million+                    43 million+
                                                                       Redbox makes it
                                                                                                                    MO N TH L Y ME D I A                APP
                                                                                                                    I MP R E S S I O N S ( 2 )       DOW NLOADS

                                                                       ridiculously cheap
                                                                       and easy
                                                                       for consumers to get the home
                                                                                                                      6 million                     7 million+
                                                                       entertainment they want most                     S MS
                                                                                                                    SUBSCRIBERS
                                                                                                                                                   S O C I A L ME D I A
                                                                                                                                                       REACH (3)

(1)   Based on estimated foot traffic at our retail locations. Sources: Retailer Reported Traffic, Placer
(2)   Based on estimates and partner analytics. Sources: Google, LiveIntent, Vistar, Magnite
(3)   Total combined followers across Facebook, Instagram, and Twitter                                      –3–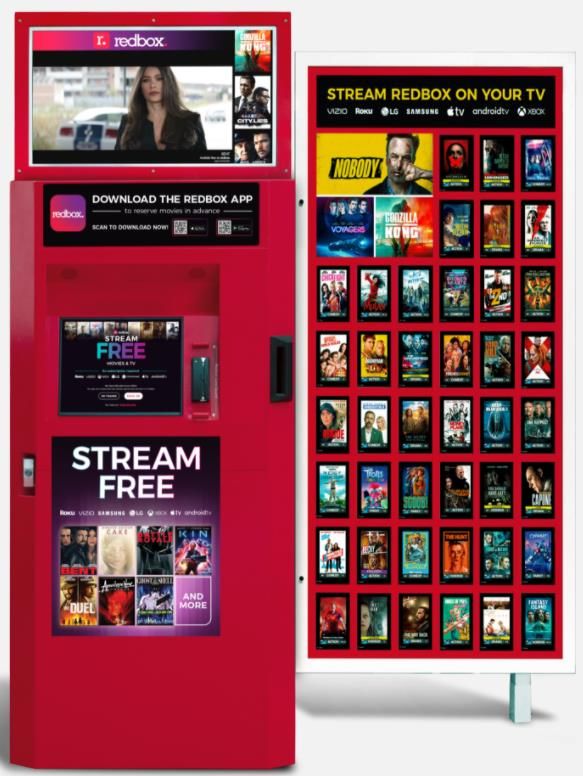
Transformation Provides More Choice Than Any Competitor

 Redbox is undergoing a
 radical transformation from a legacy DVD rental business to a multi-faceted
                       digital entertainment company
                             that spans multiple entertainment windows and business models

                    PVOD /         Physical Disc         Transactional
    Theatrical                                                           SVOD / Premium         Ad-
                 Electronic Sell     Rental &              Video On
     Release                                                                Channels         Supported
                 Through (EST)      Purchase               Demand

                 Single Sign On            Single Payment                 In-App Streaming

                                                   –4–
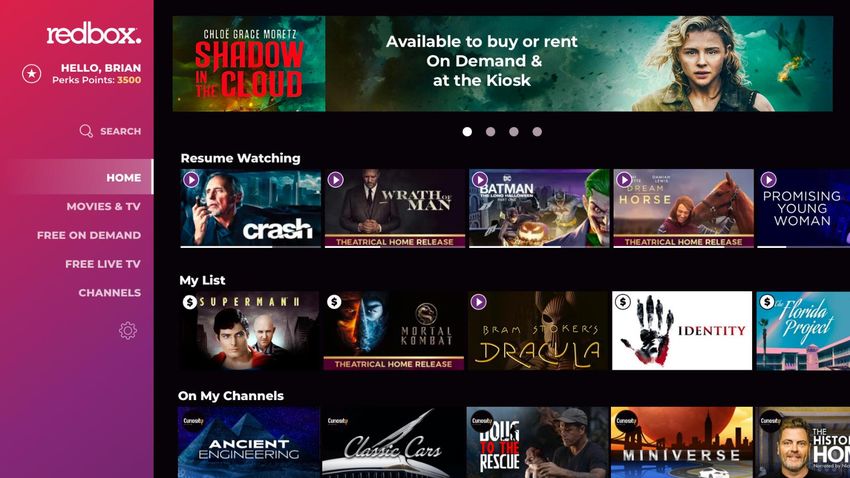
Redbox Provides a Single App Experience

                                                                                                        (1)     (1)   (1)   (1)             (1)

                                                                                                                                  Coming 2021

Note:   The display of these trademarks, service marks and trade names is for illustrative purposes only.
        Redbox does not currently have agreements in place with these companies but intends to pursue them.
                                                                                                              –5–
Differentiated Customer Base That is Still Migrating to Streaming

                                 Value Conscious
                                                                                                        Adoption Opportunity
                                  Movies Lovers

      • 71% of customers identify as “Deal                                                         Household Penetration for Pay TV vs Non-Pay TV(4)

                Hunters”(1)
                                                                                                  80%

      • 58% of customers are heavily engaged in                                                   70%
                                                                                                         70.0%

                                                                                                                    64.1%
                loyalty/rewards programs(1)
                                                                                                                                59.1%
                                                                                                  60%                                    54.8%
      •         Users consume significantly more movies than                                                                                         51.5%
                Average US Broadband Household                                                    50%
                                                                                                                                                                        51.4%

                                                                                                                                                                        48.6%
                                                                                                                                                     48.5%

                     - 72% more movies in theatres                                    (2)         40%
                                                                                                                                40.9%
                                                                                                                                         45.2%

                                                                                                                    35.9%

                     - 2x more movie rentals
                                                                                                  30%
                                                                                (2)                      30.0%

                                                                                                  20%
      •         Users spend more on Cable TV than Average                                                2019       2020        2021      2022        2023           2024

                Entertainment Consumer(3)                                                                        MVPD + vMVPD           Online Only + Over the Air

                               70% of customers are late adopters of new technology(1)

(1)       Source: Redbox Customer Panel; 2019 Psychographic Profiling Survey
(2)       Source: Interpret's New Media Measure syndicated study Q3'18 (Age 13-65)
(3)       Source: MasterCard Data Warehouse; Apr’19-Mar’20 Study
(4)       Source: SNL Kagan – April 2020                                                    –6–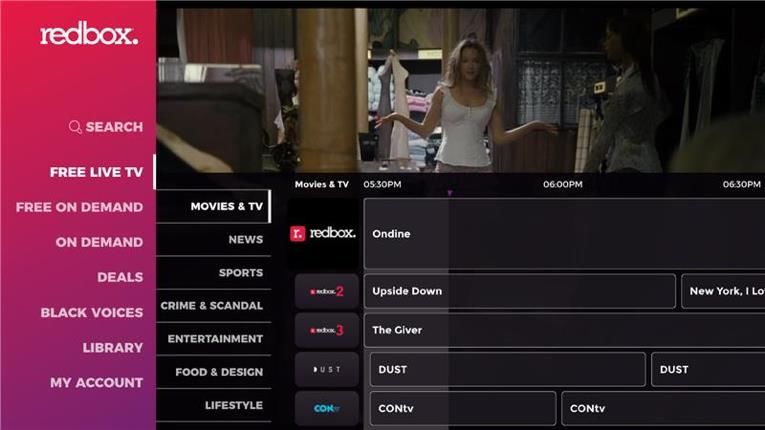
Digital Transformation is Building on a Strong Foundation

  1                                                                          6Bn+
      Established brand and market leader in home entertainment
                                                                        Lifetime Rents

  2                                                                       40MM
      Large and highly differentiated customer base
                                                                      Annual Customers

  3                                                                        46MM
       Huge marketing reach and scaled loyalty program
                                                                      E-mail Subscribers

  4                                                                      2.5x Digital
      Rapid digital transformation proven by business trends
                                                                        Growth in 2020

  5                                                                     $44Bn TAM
      Digital plays in both massive and fast-growing AVOD and SVOD
                                                                     AVOD & SVOD (2021E)

                                            –7–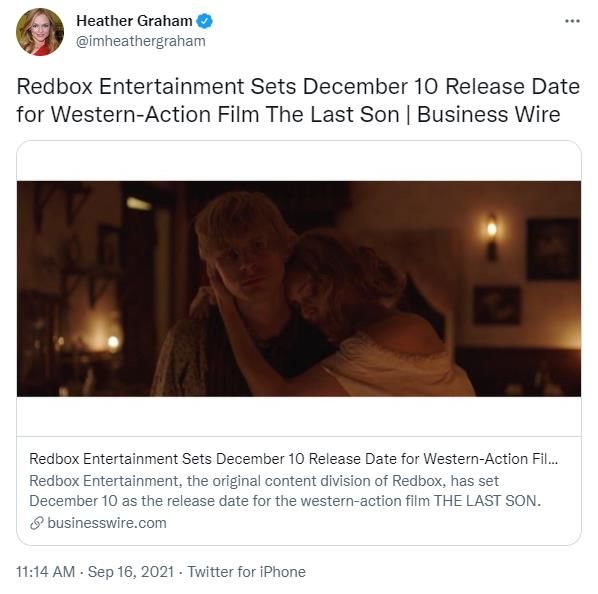
Expanding Digital Offerings Increases TAM & Customer Value Potential

                                                                         Customer Value of Multi-Product Customers
                                                                                  Physical Rents   PRM     TVOD        Digital Products

                                                                                                                               Range of Opportunity from Launching Ad-
                                                                                                                                 Supported & SVOD Channel Products
                 $350

                                                                                                                                                                 $295
                 $300

                 $250
                                                                                                                                      $215
                 $200

                 $150

                 $100                                                                                          $17
                                                                                                               $14
                                                                                        $13
                  $50
                                                                                                               $72
                                                                                        $58
                                              $22
                   $-
                                                                                                     Physical Rents,            Physical Rents & Sell-    Physical Rents & Sell-
                                          Physical                            Physical Rents &
                                                                                                     Sell-Through, &           Through, TVOD, + New      Through, TVOD, + New
                                          Rents(1)                             Sell-Through(1)
                                                                                                          TVOD(1)                 Digital Products(2)       Digital Products(2)

(1)   Physical Rents & Sell-through, TVOD are based on actual multi-product Redbox customers
(2)   Includes a combination of TVOD, SVOD subscriptions, and AVOD hours watched
                                                                                                         –8–
Converting a Small Percentage of Existing Customers to Consistent Multi-Product
Users Leads to $800MM to $1Bn+ in Annual Revenue from this Cohort Alone

       Range of Revenue of Opportunity from Consistent, Multi-Product Customers

     Total Redbox Customers                                                               40,000,000

                                                              x $215 customer value
                                                              $860MM-$1.3Bn

     10-15% Conversion Rate           4,000,000 – 6,000,000

                                                              x $295 customer value
                                                              $1.2Bn-$1.8Bn

                  Revenue opportunity is in addition to single-product customer revenue
                             (e.g. Legacy Only or TVOD Only or AVOD Only)

                                                       –9–
Digital Transformation Underway
On Demand Free Live TV Free On Demand Premium / SVOD
Transactional PVOD/ VOD/
EST
Ad-Supported Linear Ad-Supported Moves Channels
Channels & TV
3rd Party SVOD Channel
Dec 2017 Subscriptions
Feb 2020
Dec 2020
Q2 2022
14MM+ lifetime
1MM+ MAU since
transactions 2K+ AVOD titles and
inception 62K+ bundles
growing
3MM+ total purchased in
9MM+ unique devices Showtime market test
customers 960% YoY growth in
in last 12 months
ad-supported hours
129% CAGR of TVOD Increased customer
100+ channels as of June ’21
Revenue(1) acquisition & retention
through Redbox
3 Redbox channels
loyalty and
promotions
(1) Representative of TVOD Annual Revenue CAGR from 2018 to 2020
– 10 –Digital Projections
The digital transformation builds atop a solid foundation of digital
experiences already available with Redbox. The investment in Free On Demand and build out
of SVOD Channels will drive an expected 113% CAGR between 2020 and 2023. Growth rates
in 2020 and 2021 impacted by fewer new title releases
On Demand Revenue Projection
$ in millions
$384
$193
$40 $55
$20
2019A 2020A 2021E 2022E 2023E
+ + +
Digital
Business
Segment
Transactional VOD Ad-Supported (AVOD & FLTV) SVOD / Premium Channels Media Network
– 11 –Kiosk is a Valuable Marketing Asset
Redbox Kiosk Network
• Kiosks generate • Kiosk has numerous
• ~40K kiosks in front of 400MM+ estimated marketing placements,
high traffic storefronts weekly retail including video, that also
impressions market our digital products
– 12 –Massive DOOH Opportunity to Monetize Kiosk Network
4,000 digital video screens being installed across
prime retail placements in 2021 to enhance in-
store marketing capabilities, with opportunity to
expand more broadly across kiosk network
$5.6Bn(1) SSP & DSP
2020 DOOH Growth Provide
TAM in US New Opportunities
>$70MM Annual Revenue
Opportunity
across 40K kiosks, with strategic opportunity
to build out a broader retail network, rolling
up additional retail placements in digital out
of home (DOOH)
(1) 2020, Research & Markets – “Digital OOH – Global Market and Trajectory & Analytics”
– 13 –Redbox Entertainment Drives Higher Margins
Redbox Entertainment
creates a distinct
competitive
advantage and
incremental margin
21 26 36+
Titles Released More Titles Targeted
to Date(1) Committed(1) Releases per
Year
Transactional Physical Rental Premium Pay/ SVOD AVOD
Revenue is generated through multiple release channels and will range
depending on title
(1) Title counts as of 7/15/2021
– 14 –Valuable & Diversified Legacy Business
The legacy business is expected to return to a pre-pandemic level of physical title releases in
2022 and beyond. Further diversification of legacy revenues through Redbox
Entertainment and the Service business will also add to topline revenue.
Legacy Business Revenue Projection
$ in millions
COVID Impacted(1)
$809
$712 $728
$506
$345
(3)
2019A 2020A 2021E 2022E 2023E
Theatrical
140 68 59 140-150(2) 140-150(2)
Title Count
Legacy Business
Segment
+ +
Kiosk Business Service Business
(1) 2020A and 2021E experienced ~50% reduction in theatrical releases compared to 2019A
(2) 2022E and 2023E title counts are estimated and subject to change
(3) 2019A financials exclude Games Business results for comparability. Games Business was wound down in Dec 2019 – 15 –Performance at the Kiosk
Global markets are still in the process of re-opening and large titles that depend on global
audience may continue to shift
With the return of theatrical exhibition at more normal levels, expect 140 – 150 releases in 2022
and 2023
Declining productivity per title can be offset by increasing revenue per rental
Metric 2019A 2020A 2021E 2022E 2023E
Title Count 140 68 59(1) 140 – 150(1)
Will range based on timing of releases and
Rentals (in millions) 250 146 title productivity
Avg. Rentals / Expect declines in title productivity; assumed
Title (in millions) 1.8 2.2 1.0-1.2 rents per title in 2022 and 2023
Avg. Revenue /
Rental $3.12 $3.12 Ability to optimize pricing
All Legacy Rental revenue a function of productivity
Revenue ($ in millions) $809 $506 & price optimization
(1) Expected title counts are subject to change
– 16 –Summary Financials 2019-2023
COVID Impacted Years
'20-'23
($ in millions) 2019A 2020A 2021E 2022E 2023E CAGR
Net Revenue:
Redbox Legacy $809 $506 $345 $712 $728 12.8%
Redbox Digital $20 $40 $55 $193 $384 113.0%
Total Net Revenue $829 $546 $400 $906 $1,112 26.7%
% Growth -20.7% -34.1% -26.8% 126.4% 22.8%
Gross Profit $498 $325 $241 $506 $565 20.2%
% Margin 60.1% 59.5% 60.1% 55.9% 50.8%
Total Operating Costs $323 $251 $219 $321 $332 9.8%
One-time Addbacks $21 $39 $19 $7 $3
Adj. EBITDA $196 $114 $40 $193 $237 27.6%
% Margin 23.6% 20.8% 10.1% 21.3% 21.3%
Capital Expenditures $33 $21 $14 $20 $15 -11.5%
Free Cash Flow $163 $93 $26 $173 $222 33.8%
% Conversion 83.2% 81.5% 64.9% 89.8% 93.8%
Notes: 2021E updated as of September 2021
Timing of investments from proceeds will impact when benefits are realized
Operating Costs exclude public company costs
Free Cash Flow is defined as Adjusted EBITDA less total capital expenditures
2019A financials exclude Games Business results for comparability. Games Business was wound down in Dec 2019
– 17 –Transaction Summary
Sources Uses
($ in millions)
Existing Redbox Shareholders Equity $328 55.3% Existing Redbox Shareholders Equity $328 55.3%
Rollover Rollover
Sponsor Promote(3) 36 6.1% Sponsor Promote(3) 36 6.1%
SPAC Cash in Trust(2) 145 24.5% Cash to Balance Sheet 109 18.4%
Cash at Closing 34 5.7% Debt Paydown 100 16.9%
PIPE Proceeds 50 8.4% Estimated Transaction Costs 20 3.4%
Total Sources $593 100.0% Total Uses $593 100.0%
Illustrative Pro Forma Valuation Illustrative Pro Forma Ownership(1)
($ in millions except share price)
Illustrative Share Price $10.00
Pro Forma Shares Outstanding(1) 55.7 25.8%
Implied Equity Value $557
Plus: Pre-Transaction Debt 344
58.8% 6.4%
Less: Debt Paydown (100)
9.0%
Less: Pro Forma Cash to Balance Sheet (109)
Implied Pro Forma Enterprise Value $693
Implied Pro Forma EV / ’22E Revenue 0.8x
Existing Redbox Shareholders SPAC Public Investors (2)
Implied Pro Forma EV / ’22E Adj. EBITDA 3.6x SPAC Sponsor Shares (3) PIPE Investors
(1) Excludes dilutive impact of 16.8mm warrants from SGAM’s public offering. All warrants have a strike price of $11.50 per share
(2) Assumes estimated cash held in trust at closing and no redemption of SGAM public shares
(3) SPAC Sponsor Shares include 3.6mm SGAM Founder Shares – 18 –Valuation Benchmarking
Digital Platform Peers Legacy Platform Peers
14.8x
EV / 2022E Revenue
7.2x
Median: 4.7x
4.9x 4.5x 4.3x 4.4x 4.3x
3.7x Median: 2.8x
3.0x 3.0x 2.6x 2.4x
1.8x 1.5x
0.8x
133.4x
Median: 29.7x
29.7x
EV / 2022E EBITDA
22.2x
17.5x
15.0x Median: 9.1x
10.7x 9.6x 8.6x 8.2x 8.1x 7.7x
3.6x
NM NA NA
Source: CapitalIQ as of 7/09/2021
Note: Redbox represents Adjusted EBITDA
– 19 –Lack of Content Impacts Q2 2020 through 2021 Results
The theatrical release slate was materially impacted by COVID in 2020 and 2021 driving
more than a 50% reduction in releases at Redbox. The slate is expected to improve in late 2021
and return to pre-pandemic levels with more consistency in 2022 and beyond. Timing of
releases is a large factor of rental volume in the year as titles released later in the year have
less time to be monetized within that specific period.
Quarterly Theatrical Title Count (1)
No
39 theatrical
37 36 releases
33 32
due to
26 COVID 26
closures
15
11
7 0 5
Q1 Q2 Q3 Q4
2019 2020 2021
(1) Future title counts are subject to change
– 20 –Recent Deals Showcase Progress of Digital Strategy
– 21 –Risk Factors • Redbox faces competitive pressures from many other sources, including those using other distribution channels, having more experience, larger or more appealing inventory, better financing, and better relationships with those in the physical and streaming movie and television industries. • The home video distribution market is rapidly evolving as newer technologies and distribution channels compete for market share, and we have experienced a secular decline in the physical rental market. • Decreased quantity and quality of movie content availability for physical and digital distribution due to changes in quantity of new releases by studios, movie content failing to appeal to consumers’ tastes, increased focus on digital sales and rentals, and other general industry-related factors, including financial disruptions, and labor conflicts may impact our revenue. • The termination, non-renewal or renegotiation on materially adverse terms of our contracts or relationships with one or more of our significant retailers or studios could seriously harm our business, financial condition and results of operations. • Our inability to obtain licenses to digital movie or television content for home entertainment viewing could adversely affect our business. • We rely upon a number of partners to make our digital service available on their devices. Their performance may, including any outages, could negatively impact our results. • We face risks, such as unforeseen costs and potential liability in connection with content we acquire, produce, license and/or distribute through our service. • If the technology we use in operating our business fails, is unavailable, or does not operate to expectations, our business and results of operation could be adversely impacted. • Demand for our products and services may be sensitive to pricing changes. • As our business expands to provide new products and services, and as we continue our efforts to enhance the Redbox customer experience, we are increasing the amount of consumer data that we collect, transfer, retain and use as part of our business. These activities are subject to laws and regulations, as well as industry standards, in the jurisdictions in which our products and services are or may be made available. • Our future operating results will depend significantly on our ability to continue to drive new and repeat use of our Redbox kiosks, continued development of digital offerings, our ability to develop and commercialize new products and services, such as third-party kiosk servicing line of business, and the costs incurred to do so. • Failure to adequately comply with privacy notices, information security policies, standards or legal requirements or to adequately safeguard against breaches of such policies, standards or requirements could adversely affect our operations and could damage our business, reputation, financial position and results of operations. • Any significant disruption in or unauthorized access to our computer systems or those of third parties that we utilize in our operations, including those relating to cybersecurity or arising from cyber-attacks, could result in a loss or degradation of service, unauthorized disclosure of data, including member and corporate information, or theft of intellectual property, including digital content assets, which could adversely impact our business. • The application of existing laws and regulations, changes in laws or enactment of new laws and regulations, that apply, or may in the future apply, to our current or future products or services, changes in governmental authorities’ interpretation of the application of various government regulations to our business, or the failure or inability to gain and retain required permits and approvals could materially and adversely affect our business. • Events outside of our control, including the economic environment, or business interruption created by natural disasters or global pandemics, including the ongoing impact of COVID-19, have negatively affected, and could continue to negatively affect, consumers’ use of our products and services. • The loss of personnel or the inability of replacements to quickly and successfully perform in their new roles could adversely affect our business. • Our ability to obtain additional funding in the future, if and as needed, through equity issuances or loans, or otherwise meet our current obligations to third parties, could be adversely affected if the economic environment continues to be difficult. • We have debt outstanding and may incur additional debt in the future, which may adversely affect our financial condition and future financial results. • If we are unable to meet our debt obligations, we could be forced to restructure or refinance such obligations, seek additional equity financing or sell assets, which we may not be able to do on satisfactory terms or at all. – 22 –
Acronym Definitions
ARPU – Average Revenue per User MVPD – Multichannel Video Programming
AVOD – Advertising Video On Demand Distributor
CPA – Cost Per Acquisition vMVPD – Virtual Multichannel Video
Programming Distributor
CRM – Customer Relationship Management
PIPE – Private Investment in Public Equity
DOOH – Digital Out Of Home Advertising
PRM – Previously Rented Movie
DSP – Demand-Side Platform
PVOD – Premium Video on Demand
EST – Electronic Sell Through
SSP – Supply-Side Platform
FLTV – Free Live TV
SVOD – Subscription Video on Demand
LOB – Line of Business
TAM – Total Addressable Market
LTD – Life-to-Date
TVOD – Transactional Video On Demand
MAU – Monthly Active Users
VOD – Video on Demand
– 23 –You can also read