EMEA Structured Finance Chart Book - UPDATE - S&P Global
←
→
Page content transcription
If your browser does not render page correctly, please read the page content below

EMEA Structured Finance            Andrew South
                                   Casper Andersen
                                                     Antonio Farina
                                                     Mathias Herzog

Chart Book
                                   Alastair Bigley   Volker Laeger
                                   Sandeep Chana

July 2021

                          UPDATE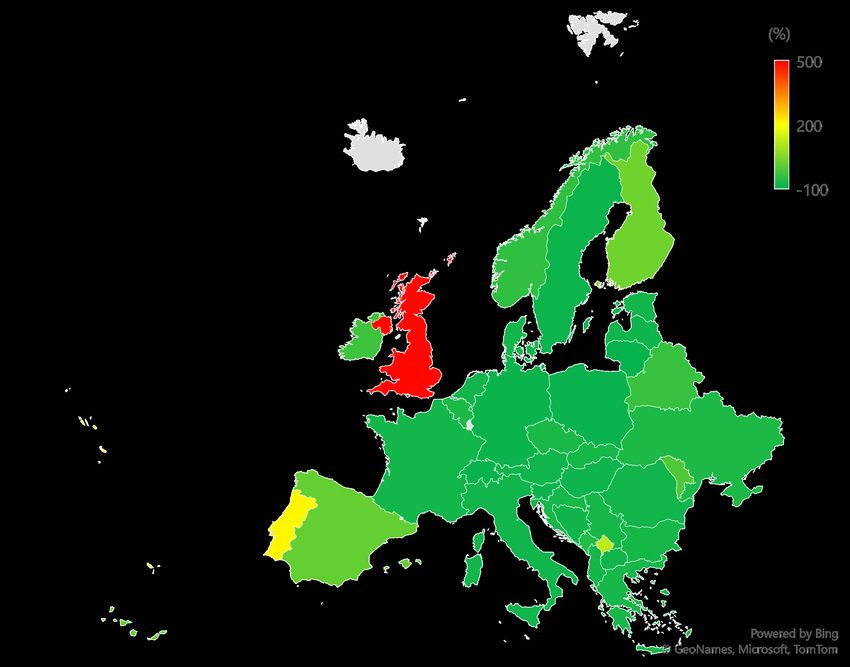
Highlights—News

– Issuance. Investor-placed securitization issuance was up 60% year-to-date at the end of June, to €52 billion. While 2020 may be a
  flattering basis for comparison, issuance this year is also almost on a par with the same point in 2018, when volumes eventually hit a
  post-2008 record by year-end. Strong growth in CLO refinancing and reset activity has added a further €35 billion to volumes. By contrast,
  European benchmark covered bond issuance was down by 38% in the first half of the year, at €40 billion. Continued high growth in bank
  deposits and ample availability of cheap central bank funding has reduced covered bond issuers’ wholesale funding needs.
– Rating actions. In June 2021, we only lowered one rating on a European structured finance security, while there were 17 upgrades spread
  among eight ABS and RMBS transactions. In the year to mid-2021, we have lowered only about 3% of our European structured finance
  ratings.
– Regulation. The European Banking Authority (EBA) has launched a consultation on sustainable securitizations. The regulator’s mandate
  resulted from recent updates to the Securitization Regulation. The EBA is looking for insights on current market practices and potential
  challenges to developing a sustainable securitization market; the business need, relevance, and potential content of an EU framework for
  the sector; and the potential risk profile of sustainable securitizations compared with similar “non-sustainable” transactions.
– Dutch buy-to-let RMBS. Recent issuance included the first Dutch buy-to-let (BTL) RMBS transaction to carry the EU’s “simple,
  transparent, and standardized” label: Domi 2021-1 B.V. The senior notes priced at the joint-tightest spread for a European BTL RMBS
  since 2008: +63 basis points. However, Dutch BTL lending faces increasing political risk, with some municipalities looking to prevent
  investors purchasing newly completed properties. This comes on top of a recent hike in stamp duty for BTL investors, who must now pay
  an 8% levy on purchases. Although private residential renting is not new in the Netherlands, the relatively high population density
  combined with low rates and increased demand from property investors has pushed property prices up 11.5% since June 2020, according
  to the Dutch Central Bank. This has put home ownership out of reach for some and turned BTL into a political issue. Measures announced
  so far would have a limited effect on existing BTL RMBS but signify growing political risk in the sector that will be worth monitoring.

                                                                                                                                               2
Highlights—Green Mortgages And Green RMBS: What Are The
Challenges?
Sustainable Finance Timelines
– As policymakers legislate toward long-term
climate-neutrality targets, more economic
activities are being viewed through a
sustainability lens, including residential
property ownership and financing.
– Green mortgages can take two forms: a
traditional loan financing the purchase of an
energy-efficient property, or a further
advance to fund energy-related home
improvements, such as solar panels,
insulation, or boiler upgrades.
– So far, there have several approaches to
green RMBS, including securitizations where
the collateral comprises green properties
exclusively or transactions where the
collateral is not green, but there is a
commitment to use the proceeds to originate
green mortgages over time.
Source: S&P Global Ratings. For more details, see “Credit FAQ: Green Mortgages And Green RMBS – What Are The Challenges?,” published June 28, 2021.
3Highlights—European RMBS Update
British Pound Sterling Five-Year Swap Rate Evolution
– High excess spread levels in recent U.K.
1.0
RMBS issuances may have peaked, as swap
0.9 rates increase and asset margins decline
due to increased competition.
0.8
– Loan-level analysis of U.K. mortgage lending
0.7
shows that origination standards were
0.6 generally maintained in 2020, with no
0.5 significant increase in risk layering.
%
0.4
– The Dutch BTL market is facing political
pressure, with sharp increases in stamp duty
0.3
for newly purchased investment properties.
0.2 – Generally, the European payment holiday and
0.1 government salary support schemes will
continue to mid-2021 and we do not expect
0.0
material RMBS collateral performance
Mar-20
Jul-20
Nov-20
Feb-20
Apr-20
Dec-20
May-20
Feb-21
Jun-20
Jan-20
Sep-20
Oct-20
Jan-21
Aug-20
movements in the short term.
Source: S&P Global Ratings. For more details, see “European RMBS Market Update Q1 2021,” published May 11, 2021.
4Highlights—U.K. Buy-To-Let Market Primer
Key Figures
– The U.K. BTL market, which turns 25 years
old this year, has developed significantly
since its inception, particularly relating to the
products on offer.
– In recent years, the performance of BTL
collateral has been positive, with total
arrears at less than 1% (with the majority of
delinquent loans in the early stages of
arrears).
– BTL RMBS transactions are more likely to
contain nuanced property types, such as
houses in multiple occupations (HMOs) or
multi-unit freehold blocks.
– As well as the usual methods of servicing
defaulted loans, BTL servicers can also use
the concept of "receiver of rent".
Source: S&P Global Ratings. For more details, see “S&P Global Ratings’ U.K. Buy-To-Let Market Primer,” published June 1, 2021.
5Highlights—Period Of Maximum Liquidity Stress May Have Passed
For U.K. Pub Corporate Securitizations
Available Sources Of Liquidity
Liquidity facility/reserve funds Cash accounts* – Following a third national lockdown in
350
England, the U.K. government allowed pubs
to re-open for indoor service from May 17.
300
– Over the next 12 to 24 months, we expect
250 earnings visibility to remain low as the sector
Available amount (Mil. £)
grapples with several issues, with full-year
200 revenue recovering to 2019 levels only by
2022.
150 – Our break-even analysis points to ratings
stability in the face of positive developments
100 that reduce the likelihood of future
nationwide lockdowns in England and put
50 the U.K. government in a position to take
further, non-regressive, steps toward easing
0 restrictions over the coming months.
Mitchells & Butlers Greene King Finance Unique Pub Finance Marston's Issuer PLC Spirit Issuer PLC
Finance PLC PLC Co PLC
Source: S&P Global Ratings. For more details, see “Period Of Maximum Liquidity Stress May Have Passed For U.K. Pub Corporate Securitizations,” published May 24, 2021.
6Highlights—Property In Transition: Zooming In On The Global Office
Reboot
Office Space Demand In Europe Is Below The Five-Year Average In All Major Markets
Paris London Berlin Madrid Barcelona – Given the growth in remote working, office
3000
landlords will face higher vacancy rates,
demands for greater environmental quality,
Total office take-up (000 square meters)
2500 and more flexible lease terms.
– Still, for key office markets globally, we
2000 expect recovery to a new normal.
– These trends are reflected in recovering
1500 investor appetite for office-related assets
including CMBS and REIT debt and equity,
while bank exposure to CRE debt remains
1000
broadly manageable.
– A prolonged recovery in office real estate
500
could hurt local government revenues, both
directly through lower property-related tax
0 income and more broadly through, for
2015 2016 2017 2018 2019 2020 5-year average
example, lower income from related
transportation sector income.
Source: S&P Global Ratings. For more details, see “Property In Transition: Zooming In On The Global Office Reboot,” published May 6, 2021.
7Contents
– Issuance 9
– Credit Performance 11
– Fundamentals 13
– RMBS 15
– ABS 18
– Structured Credit 21
– CMBS 24
– Covered Bonds 27
– Recent Research 30
8Issuance—Securitizations
1. Investor-Placed Securitization Issuance 2. 2021 YTD Investor-Placed Securitization Issuance, By Sector
(Bil. €) Year to date Rest of year YTD deal count (right scale) (Bil. €) 2.1
U.K. RMBS
120 120 15.3 Dutch RMBS
100 100 Securitization 13.8
Other RMBS
80 80 issuance in H1 2021
German ABS
was up by 60% on
60 60 the previous year U.K. ABS
40 40 Other ABS
20 20 3.7
CLO
0 0 6.7
3.7 CMBS
2013 2014 2015 2016 2017 2018 2019 2020 2021 1.8 4.7
3. Cumulative Investor-Placed Securitization Issuance 4. CLO Refinancing And Reset Issuance
(Bil. €) 2019 2020 2021 (Bil. €) New issue Refi/reset
120 40
100
30
80
60 20
40
10
20
0 0
Jan Feb Mar Apr May Jun Jul Aug Sep Oct Nov Dec 2013 2014 2015 2016 2017 2018 2019 2020 2021 YTD
1-3. Year-to-date (YTD) figures as of end-June each year. Excludes CLO refinancings and resets. Source: S&P Global Ratings. 4. Source: S&P Global Ratings, S&P LCD.
9Issuance—Covered Bonds
1. Benchmark Covered Bond Issuance 2. 2021 YTD Benchmark Covered Bond Issuance, By Country
(Bil. €) Year to date Rest of year YTD deal count (right scale) (Bil. €) 5.3 France
150 150 1.0 12.3 Germany
Covered bond 1.5 Norway
issuance in H1 2021
100 100 2.0 U.K.
was down by 38%
on the previous year 2.2 Italy
50 50 Netherlands
5.5 Sweden
0 0
10.3 Other
2013 2014 2015 2016 2017 2018 2019 2020 2021
3. Cumulative Benchmark Covered Bond Issuance 4. Change In YTD Issuance, 2021 Vs. 2020, By Country
(Bil. €) 2019 2020 2021 Norway
140 Sweden
120 Italy
100 Netherlands
Germany
80
Spain
60
Other
40
U.K.
20
France
0
Jan Feb Mar Apr May Jun Jul Aug Sep Oct Nov Dec (Bil. €) (12) (10) (8) (6) (4) (2) 0 2 4
1-4. Year-to-date (YTD) figures as of end-June each year. Source: S&P Global Ratings.
10Credit Performance—Long-Term Ratings Drift
Rating Action Count, 12-Month Rolling 12-Month Trailing Average Change In Credit Quality
(000) Upgrade Downgrade* Default (Notches) ABS CMBS RMBS SC Overall
2 1
1
0
0
1 (1)
2 Recent downward
ratings migration has
(2)
mostly been confined
3 to the CMBS sector
4 (3)
2012 2013 2014 2015 2016 2017 2018 2019 2020 2021 2012 2013 2014 2015 2016 2017 2018 2019 2020 2021
* Excluding defaults. Excludes covered bonds. Source: S&P Global Ratings. As of end-March 2021. SC--Structured credit. Securities whose ratings migrated to 'NR' over the period
are classified based on their rating prior to 'NR'. Source: S&P Global Ratings.
11Credit Performance—Ratings Heatmaps
Distribution Of Ratings And 12-Month Transitions CreditWatch Placements And Resolutions, Last 12 Months
Upgrades Downgrades CCC/CC B BB BBB A AA AAA Downgraded Affirmed Remain on CreditWatch negative
100%
RMBS Structured Credit ABS CLO
Other SC
75% Buy-to-let RMBS
Other ABS
50% Corp. Sec.
Repack
Prime RMBS
25%
Auto
CMBS
0% Nonconforming RMBS
CLO
Other SC
conforming
Other RMBS
Repack
Prime
Auto
Other ABS
BTL
Corp. Sec.
CMBS
Non-
Other RMBS
0 5 10 15
BTL--Buy-to-let. SC--Structured credit. Based on rating transitions over the previous 12 months as of SC--Structured credit. Classified CreditWatch negative actions over the 12 months to end-June 2021
end-June 2021. Excludes confidential ratings and covered bonds. Source: S&P Global Ratings. based on subsequent resolution. Source: S&P Global Ratings.
12Fundamentals—Issuance Drivers
12-Month Lending & Deposit Growth, Eurozone Real Economy Eurozone Credit Institutions’ Use Of Central Bank Funding
Loans Deposits LTRO MRO
12 2.5
Rates of both deposit and loan Eurozone financial institutions’
10 book growth are beginning to use of term funding from central
normalize for eurozone banks, 2.0 banks has ticked higher once
although the gap still suggests again
8 limited wholesale funding needs
1.5
6
(Tril. €)
(%)
4
1.0
2
0.5
0
(2) 0.0
2010 2011 2012 2013 2014 2015 2016 2017 2018 2019 2020 2021 2010 2011 2012 2013 2014 2015 2016 2017 2018 2019 2020 2021
Real economy includes households and nonfinancial corporates. Source: European Central Bank. LTRO—Long-term refinancing operations. MRO—Main refinancing operations. Source: European Central
Bank.
13Fundamentals—COVID-19 And Related Restrictions
1. Monthly Growth/(Decline) In New Cases, June 2021 2. Daily New Cases Vs. Vaccine Rollout
U.S. U.K. European Union South America Asia
New cases per million
1,000
800
600
400
The U.K. and Portugal are 200
currently outliers in Europe, 0
seeing renewed growth in 0 10 20 30 40 50 60 70
COVID-19 case numbers
Share of population that received at least one vaccine dose (%)
Traffic to recreational sites is
3. Retail And Recreation Mobility almost back to pre-pandemic levels
U.K. Germany France Italy Spain
20
0
(20)
(40)
%
(60)
(80)
(100)
Mar-20
Jul-20
Nov-20
Apr-20
Dec-20
Mar-21
Jul-21
May-20
Feb-21
Apr-21
May-21
Jun-20
Jun-21
Sep-20
Oct-20
Jan-21
Aug-20
1. Based on seven-day new case counts. Source: Our World In Data. 2. Latest data as of July 6, 2021. Source: Our World In Data, S&P Global Ratings. 3. Change in seven-day trailing average vs. Feb. 2020 benchmark. Latest
data as of July 3, 2021. Source: Google LLC “Google COVID-19 Community Mobility Reports”.
14RMBS Alastair Bigley Senior Director +44 20 7176 3245 alastair.bigley@spglobal.com
RMBS—Issuance
Investor-Placed RMBS Issuance                                                                           2021 YTD Investor-Placed RMBS Issuance, By Subsector

 (Bil. €)                              Year to date      Rest of year                                                          (Bil. €)    0.6 0.4
                                                                                                                                       2.7
 40
                                                                                                                                                                             U.K.
 30                                                                                                                                                                          Netherlands
                                                                                                                                3.7                                          Ireland
 20
                                                          26.3                                                                                                               France
 10         22.2                                                    23.6                         22.8
                                       15.2     18.6                          17.6                                                                          15.3             Spain
                    12.6     12.6                                                        12.8
   0
            2012    2013     2014      2015     2016      2017      2018     2019        2020    2021

Cumulative Investor-Placed RMBS Issuance                                                                RMBS Issuance Mix, By Originator Type

 (Bil. €)                               2019           2020        2021                                                                 Non-bank     Bank

 40                                                                                                      100%

 30                                                                                                       80%
                                                                                                          60%
 20
                                                                                                          40%
 10                                                                                                       20%
   0                                                                                                       0%
            Jan    Feb     Mar   Apr     May      Jun     Jul     Aug      Sep     Oct     Nov    Dec           2012   2013   2014    2015   2016    2017    2018   2019   2020     2021

Year to date (YTD) figures as of end-June each year. Source: S&P Global Ratings.

                                                                                                                                                                                           16
RMBS—Rating Actions & Performance Metrics
1. Monthly Rating Actions Count, Last 24 Months 2. Cumulative Rating Actions Count, Last 12 Months
Default Downgrade CreditWatch negative Upgrade Prime Nonconforming BTL Other RMBS
100
80
Upgrade 191 12 2 4
60
40
20 CreditWatch Neg. 1 0 5 0
0
20 Downgrade 7 3 1 1
Jul-19
Nov-19
Dec-19
Mar-20
Jul-20
Nov-20
Feb-20
Apr-20
Dec-20
Mar-21
May-20
Feb-21
Apr-21
May-21
Jun-20
Jun-21
Sep-19
Oct-19
Jan-20
Sep-20
Oct-20
Jan-21
Aug-19
Aug-20
Default 1 0 0 0
3. Average Total Arrears Rate 4. Latest Annualized House Price Growth
U.K. prime U.K. BTL Italy
(%) Netherlands
Netherlands Spain U.K. nonconforming
8 14 U.K.
6 13 Ireland
4 12
Italy
2 11
Spain
0 10
Jun-17 Dec-17 Jun-18 Dec-18 Jun-19 Dec-19 Jun-20 Dec-20 (%) 0 2 4 6 8 10 12 14
1. Excludes confidential ratings. Source: S&P Global Ratings. 2. BTL--Buy-to-let. Excludes confidential ratings. Source: S&P Global Ratings. 3. Source: S&P Global Ratings. 4. To May 2021. Source: National statistical
offices, Nationwide (U.K.).
17ABS
Volker Laeger
Senior Director
+49 69 3399 9302
volker.laeger@spglobal.comABS—Issuance
Investor-Placed ABS Issuance 2021 YTD Investor-Placed ABS Issuance, By Subsector
(€ bil.) Year to date Rest of year (€ bil.)
40 3.7 German auto
4.1
French auto
30
U.K. auto
20 Other auto
0.4
10 U.K. cards
14.6 16.1 12.5 16.4 13.2
8.1 9.6 8.6 7.4 8.3 1.3 Other
0
2.7
2012 2013 2014 2015 2016 2017 2018 2019 2020 2021 1.1
Cumulative Investor-Placed ABS Issuance ABS Issuance Mix, By Tranche Rating Category Count
(€ bil.) 2019 2020 2021 B and below BB BBB A AA AAA
30 100%
25 80%
20
60%
15
40%
10
5 20%
0 0%
Jan Feb Mar Apr May Jun Jul Aug Sep Oct Nov Dec 2012 2013 2014 2015 2016 2017 2018 2019 2020 2021
Year to date (YTD) figures as of end-June each year. Source: S&P Global Ratings.
19ABS—Rating Actions & Performance Metrics
1. Monthly Rating Actions Count, Last 24 Months 2. Cumulative Rating Actions Count, Last 12 Months
Default Downgrade CreditWatch negative Upgrade Auto/
Credit cards Corp. sec. Other ABS
consumer
20
10
Upgrade 24 5 3 9
0
10
20 CreditWatch Neg. 4 0 2 0
30
40 Downgrade 0 0 6 0
Jul-19
Nov-19
Nov-20
Dec-19
Mar-20
Jul-20
Feb-20
Apr-20
Dec-20
Mar-21
May-20
Feb-21
Apr-21
May-21
Jun-20
Jun-21
Sep-19
Oct-19
Jan-20
Sep-20
Oct-20
Jan-21
Aug-19
Aug-20
Default 0 0 0 0
3. ABS 30+ Day Arrears Rate Indices 4. Used Car Price Index
German auto U.K. auto All auto U.K. Spain Italy Germany France
2.5 110
2.0 108
1.5 106
104
%
1.0 102
0.5 100
0.0 98
Jul-17
Nov-17
Mar-18
Jul-18
Nov-18
Mar-19
Jul-19
Nov-19
Mar-20
Jul-20
Nov-20
Mar-21
Mar-20
Jul-20
Nov-20
Dec-20
Mar-21
May-18
May-19
May-20
May-21
Feb-20
Apr-20
May-20
Feb-21
Apr-21
May-21
Jun-20
Jun-21
Sep-17
Jan-18
Sep-18
Jan-19
Sep-19
Jan-20
Sep-20
Jan-21
Sep-20
Oct-20
Jan-21
Aug-20
1. Excludes confidential ratings. Source: S&P Global Ratings. 2. Excludes confidential ratings. Source: S&P Global Ratings. 3. Source: S&P Global Ratings. 4. Source: Residual Value Intelligence, Autovista Group.
20Structured Credit
Sandeep Chana
Director
+44 20 7176 3923
sandeep.chana@spglobal.comCLO—Issuance
1. Investor-Placed CLO New Issuance 2. Investor-Placed CLO Refi/Reset Issuance
(Bil. €) Year to date Rest of year (Bil. €) Year to date Rest of year
35 40
30
25 30
20
20
15 34.5
10 10
13.3 14.7 13.8 14.2
5 6.9 7.6 7.2 8.4 10.1 9.9
0 0
2012 2013 2014 2015 2016 2017 2018 2019 2020 2021 2012 2013 2014 2015 2016 2017 2018 2019 2020 2021
3. Cumulative Investor-Placed CLO New Issuance 4. Monthly European Leveraged Finance Origination Volumes
(Bil. €) 2019 2020 2021 (Bil. €) Bonds Loans
35 30
30 25
25 20
20
15
15
10
10
5 5
0 0
Jan Feb Mar Apr May Jun Jul Aug Sep Oct Nov Dec 2019 2020 2021
1. Year-to-date (YTD) figures as of end-June each year. Source: S&P Global Ratings. 2. Source: S&P LCD. 3. Source: S&P Global Ratings. 4. Three-month rolling average. Loan figures are institutional only. Source: S&P LCD,
S&P Global Ratings.
22CLO & Structured Credit—Rating Actions & Performance Metrics
1. Monthly Rating Actions Count, Last 24 Months 2. Cumulative Rating Actions Count, Last 12 Months
Default Downgrade CreditWatch negative Upgrade CLO SME Repack Other SC
20
10 Upgrade 8 1 15 0
0
10 CreditWatch Neg. 14 5 2 0
20
30 Downgrade 27 4 5 1
Jul-19
Nov-19
Nov-20
Dec-19
Mar-20
Jul-20
Feb-20
Apr-20
Dec-20
Mar-21
May-20
Feb-21
Apr-21
May-21
Jun-20
Jun-21
Sep-19
Oct-19
Jan-20
Sep-20
Oct-20
Jan-21
Aug-19
Aug-20
Default 0 0 0 3
3. European CLO Exposure To ‘CCC’ Category Corporate Obligors 4. Speculative-Grade Corporate Default Rate
16 U.S. Europe
14
12 14
10 12
8 10
%
6 8
%
4 6
2 4
0 2
0
Mar-20
Jul-20
Nov-20
Apr-20
Dec-20
Mar-21
May-20
Feb-21
Apr-21
May-21
Jun-20
Sep-20
Oct-20
Jan-21
Aug-20
2008
2009
2010
2011
2012
2013
2014
2015
2016
2017
2018
2019
2020
2021
2022
1. Excludes confidential ratings. Source: S&P Global Ratings. 2. SC—Structured Credit. Excludes confidential ratings. Source: S&P Global Ratings. 3. Solid line is the median, with each band representing a decile, from 10th
to 90th percentiles. Estimates based on portfolios from latest available trustee reports, with ratings updated. Source: S&P Global Ratings. 4. Dashed lines represent forecasts. Source: S&P Global Ratings.
23CMBS Mathias Herzog Director +49 69 3399 9112 mathias.herzog@spglobal.com
CMBS—Issuance
Investor-Placed CMBS Issuance                                                                                     2021 YTD Investor-Placed CMBS Issuance, By Country

 (Bil. €)                                Year to date     Rest of year                                                                             (Bil. €)        0.1

 10                                                                                                                                                     0.3
                                                                                                                                                                                  0.6
                                                                                                                                                                                                    U.K.
  8
                                                                                                                                                                                                    Netherlands
  6                                                                                                                                                                                                 Germany
  4                                                                                                                                                                                                 Pan-European
                     5.5                                                                                                                              0.5
  2                                                                                                                                                                                                 Spain
            1.3                          2.3                        2.0         2.0                 2.1
  0                                                                                         1.1
                                                                                                                                                                            0.6
            2012     2013        2014    2015    2016     2017    2018      2019            2020    2021

Cumulative Investor-Placed CMBS Issuance                                                                          Primary Spreads On European CMBS Issuance

 (Bil. €)                                 2019          2020      2021                                              (bps)                 GBP - AAA           EUR - AAA   GBP - BBB     EUR - BBB

 5                                                                                                                 500
 4                                                                                                                 400
 3                                                                                                                 300
 2                                                                                                                 200
 1                                                                                                                 100
 0                                                                                                                    0
       Jan         Feb     Mar     Apr    May    Jun      Jul    Aug      Sep         Oct     Nov    Dec              Jan-19 Apr-19 Jul-19 Oct-19 Feb-20 May-20 Aug-20 Nov-20 Mar-21 Jun-21

Year-to-date (YTD) figures as of end-June each year. Sterling spreads are over three-month LIBOR prior to 2020 and subsequently over SONIA. Source: S&P Global Ratings.

                                                                                                                                                                                                                  25
CMBS—Rating Actions
1. Monthly Rating Actions Count, Last 24 Months 2. Cumulative Rating Actions Count, Last 12 Months
Default Downgrade CreditWatch negative Upgrade Hotel Retail Mixed Other CMBS
10
Upgrade 0 4 0 0
5 CreditWatch Neg. 0 0 0 0
Downgrade 6 24 14 4
0
Default 0 3 0 0
5
3. European CMBS Loans In Special Servicing
Overall loan count % in special servicing (right scale) %
10
140 70
120 60
100 50
15 80 40
60 30
40 20
20 10
20 0 0
Jul-19
Nov-19
Nov-20
Dec-19
Mar-20
Jul-20
Feb-20
Apr-20
Dec-20
Mar-21
May-20
Feb-21
Apr-21
May-21
Jun-20
Jun-21
Sep-19
Oct-19
Jan-20
Sep-20
Oct-20
Jan-21
Aug-19
Aug-20
Mar-17
Dec-17
Mar-18
Dec-18
Mar-19
Dec-19
Mar-20
Dec-20
Mar-21
Jun-17
Jun-18
Jun-19
Jun-20
Sep-17
Sep-18
Sep-19
Sep-20
1. Excludes confidential ratings. Source: S&P Global Ratings. 2. Excludes confidential ratings. Source: S&P Global Ratings. 3. Based on loans backing European CMBS rated by S&P Global Ratings. Source: S&P Global
Ratings.
26Covered Bonds
Antonio Farina Casper Andersen
Senior Director Senior Director
+34 91 788 7226 +49 69 3399 9208
antonio.farina@spglobal.com casper.andersen@spglobal.comIssuance—Covered Bonds
Benchmark Covered Bond Issuance 2021 YTD Benchmark Covered Bond Issuance, By Country
(Bil. €) Year to date Rest of year YTD deal count (right scale) (Bil. €) 5.3 France
150 150 1.0 12.3 Germany
1.5 Norway
100 100 2.0 U.K.
2.2 Italy
50 50 Netherlands
5.5 Sweden
0 0
10.3 Other
2013 2014 2015 2016 2017 2018 2019 2020 2021
Cumulative Benchmark Covered Bond Issuance Change In YTD Issuance, 2021 Vs. 2020, By Country
(Bil. €) 2019 2020 2021 Norway
140 Sweden
120 Italy
100 Netherlands
Germany
80
Spain
60
Other
40
U.K.
20
France
0
Jan Feb Mar Apr May Jun Jul Aug Sep Oct Nov Dec (Bil. €) (12) (10) (8) (6) (4) (2) 0 2 4
Year-to-date (YTD) figures as of end-June each year. Source: S&P Global Ratings.
28Covered Bonds—Rating Actions & Performance Metrics
1. Monthly Rating Actions Count, Last 24 Months 2. Cumulative Rating Actions Count, Last 12 Months
Downgrade Outlook negative Outlook positive Upgrade Central &
Northern Southern
Eastern Other CB
Europe Europe
8 Europe
6
4 Upgrade 0 2 1 0
2
0
2 Outlook Positive 0 0 0 0
4
6 Outlook Negative 0 4 0 0
Jul-19
Nov-19
Nov-20
Dec-19
Mar-20
Jul-20
Feb-20
Apr-20
Dec-20
Mar-21
May-20
Feb-21
Apr-21
May-21
Jun-20
Jun-21
Sep-19
Oct-19
Jan-20
Sep-20
Oct-20
Jan-21
Aug-19
Aug-20
Downgrade 0 0 0 0
3. Average Notches Of Uplift 4. Average Overcollateralization
Notches uplift Unused notches uplift Available Required for current rating
10 100
8 80
6 60
%
4 40
2 20
0 0
Nether-
Sweden
Ireland
Norway
Belgium
Spain
Austria
France
Italy
U.K.
Finland
Denmark
Germany
Nether-
Sweden
Ireland
Norway
Belgium
Spain
Austria
France
Italy
U.K.
Finland
Denmark
Germany
lands
lands
1. & 2. Based on count of issuers with covered bond rating actions in the time period. Excludes confidential ratings. CB—Covered Bonds. Source: S&P Global Ratings. 3. As of Q2 2021. Source: S&P Global Ratings. 4. As of Q2
2021. The scale is capped at 100%. Programs in Spain have an average available overcollateralization exceeding 250%. Source: S&P Global Ratings.
29Recent Research (1)
For similar information on North American Structured Finance, please download the most recent edition of our U.S. And Canada Structured
Finance Surveillance Chart Book.
– Covered Bonds Must Adjust To A New Reality After COVID-19, June 30, 2021
– Global Covered Bond Insights Q2 2021, June 30, 2021
– Credit FAQ: Green Mortgages And Green RMBS – What Are The Challenges?, June 28, 2021
– European Auto ABS Index Report Q1 2021, June 22, 2021
– European And U.K. Credit Card ABS Index Report Q1 2021, June 22, 2021
– European RMBS Index Report Q1 2021, June 16, 2021
– Data Requirements And Criteria Application For EMEA Nonperforming And Reperforming Structured Finance Transactions, June 15, 2021
– Global Structured Finance: Charting The Recovery From COVID-19, June 14, 2021
– Austrian Covered Bonds Harmonization Proposal Merges Three Laws Into One, June 10, 2021
– S&P Global Ratings’ U.K. Buy-To-Let Market Primer, June 1, 2021
– Period Of Maximum Liquidity Stress May Have Passed For U.K. Pub Corporate Securitizations, May 24, 2021
– LIBOR Transition: Laws Won’t Eliminate All Uncertainty, May 14, 2021
Source: S&P Global Ratings.
30Recent Research (2)
– European RMBS Market Update Q1 2021, May 11, 2021
– European CMBS Monitor Q1 2021, April 29, 2021
– The ESG Pulse: A Spotlight on Structured Finance, April 28 ,2021
– European RMBS Index Report Q4 2020, April 14, 2021
– U.K. Pubs, Shaken And Stirred, Look To Recover After A Cocktail Of Headwinds, April 8, 2021
– Global Covered Bond Insights Q1 2021, April 8, 2021
– Global Covered Bond Characteristics And Rating Summary Q1 2021, April 8, 2021
– ESG Industry Report Cards For Structured Finance Published, March 31, 2021
– European And U.K. Credit Card ABS Index Report Q4 2020, March 11, 2021
– European Auto ABS Index Report Q4 2020, March 11, 2021
– Covered Bonds In New Markets: Expect Only A Gradual Recovery, March 8, 2021
– As European Hotels Grapple With Prolonged Restrictions, Are Operators And Landlords Sharing The Pain?, Feb. 24, 2021
– How The Geographic Footprints Of U.K. Pub Corporate Securitizations May Influence Their Performance, Feb. 8, 2021
– European RMBS Outlook 2021, Jan. 25, 2021
– European Structured Finance Outlook 2021: In Short Supply, Jan. 20, 2021
Source: S&P Global Ratings.
31Copyright © 2021 by Standard & Poor’s Financial Services LLC. All rights reserved.
No content (including ratings, credit-related analyses and data, valuations, model, software or other application or output therefrom) or any part thereof (Content) may be modified, reverse engineered, reproduced or distributed in any form by any
means, or stored in a database or retrieval system, without the prior written permission of Standard & Poor's Financial Services LLC or its affiliates (collectively, S&P). The Content shall not be used for any unlawful or unauthorized purposes. S&P
and any third-party providers, as well as their directors, officers, shareholders, employees or agents (collectively S&P Parties) do not guarantee the accuracy, completeness, timeliness or availability of the Content. S&P Parties are not responsible
for any errors or omissions (negligent or otherwise), regardless of the cause, for the results obtained from the use of the Content, or for the security or maintenance of any data input by the user. The Content is provided on an "as is" basis. S&P
PARTIES DISCLAIM ANY AND ALL EXPRESS OR IMPLIED WARRANTIES, INCLUDING, BUT NOT LIMITED TO, ANY WARRANTIES OF MERCHANTABILITY OR FITNESS FOR A PARTICULAR PURPOSE OR USE, FREEDOM FROM BUGS, SOFTWARE ERRORS
OR DEFECTS, THAT THE CONTENT'S FUNCTIONING WILL BE UNINTERRUPTED, OR THAT THE CONTENT WILL OPERATE WITH ANY SOFTWARE OR HARDWARE CONFIGURATION. In no event shall S&P Parties be liable to any party for any direct,
indirect, incidental, exemplary, compensatory, punitive, special or consequential damages, costs, expenses, legal fees, or losses (including, without limitation, lost income or lost profits and opportunity costs or losses caused by negligence) in
connection with any use of the Content even if advised of the possibility of such damages.
Credit-related and other analyses, including ratings, and statements in the Content are statements of opinion as of the date they are expressed and not statements of fact. S&P's opinions, analyses, and rating acknowledgment decisions
(described below) are not recommendations to purchase, hold, or sell any securities or to make any investment decisions, and do not address the suitability of any security. S&P assumes no obligation to update the Content following publication in
any form or format. The Content should not be relied on and is not a substitute for the skill, judgment and experience of the user, its management, employees, advisors and/or clients when making investment and other business decisions. S&P
does not act as a fiduciary or an investment advisor except where registered as such. While S&P has obtained information from sources it believes to be reliable, S&P does not perform an audit and undertakes no duty of due diligence or
independent verification of any information it receives. Rating-related publications may be published for a variety of reasons that are not necessarily dependent on action by rating committees, including, but not limited to, the publication of a
periodic update on a credit rating and related analyses.
To the extent that regulatory authorities allow a rating agency to acknowledge in one jurisdiction a rating issued in another jurisdiction for certain regulatory purposes, S&P reserves the right to assign, withdraw, or suspend such acknowledgement
at any time and in its sole discretion. S&P Parties disclaim any duty whatsoever arising out of the assignment, withdrawal, or suspension of an acknowledgment as well as any liability for any damage alleged to have been suffered on account
thereof.
S&P keeps certain activities of its business units separate from each other in order to preserve the independence and objectivity of their respective activities. As a result, certain business units of S&P may have information that is not available to
other S&P business units. S&P has established policies and procedures to maintain the confidentiality of certain nonpublic information received in connection with each analytical process.
S&P may receive compensation for its ratings and certain analyses, normally from issuers or underwriters of securities or from obligors. S&P reserves the right to disseminate its opinions and analyses. S&P's public ratings and analyses are made
available on its Web sites, www.standardandpoors.com (free of charge), and www.spcapitaliq.com (subscription) and may be distributed through other means, including via S&P publications and third-party redistributors. Additional information
about our ratings fees is available at www.standardandpoors.com/usratingsfees.
Australia: S&P Global Ratings Australia Pty Ltd holds Australian financial services license number 337565 under the Corporations Act 2001. S&P Global Ratings' credit ratings and related research are not intended for and must not be distributed to
any person in Australia other than a wholesale client (as defined in Chapter 7 of the Corporations Act).
STANDARD & POOR'S, S&P and RATINGSDIRECT are registered trademarks of Standard & Poor's Financial Services LLC.
spglobal.com/ratings
32You can also read