The state of U.S. consumers, audio, and media
                   April 3, 2020
←
→
Page content transcription
If your browser does not render page correctly, please read the page content below

The state of U.S. consumers, audio, and media
April 3, 2020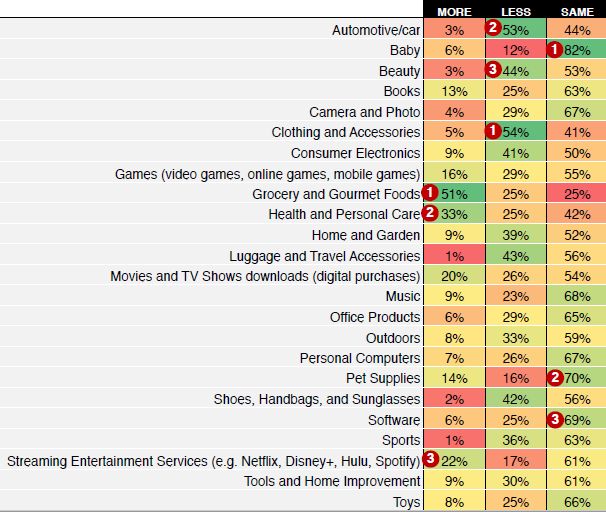
Overview                            Agenda
The Coronavirus outbreak has        •   Consumer behavior/sentiment
shifted American consumer           •   State of AM/FM radio
behavior and media                  •   Nielsen COVID-19 flash study
consumption habits.                 •   Ad-supported audio by location
AM/FM radio is several weeks        •   Nielsen data release schedule
away from early reads on            •   Other media consumption
listening data from Nielsen meter        • Streaming
markets.                                 • Pandora/Spotify
This deck captures responses to          • Podcasts
questions we received from               • TV viewing
agencies and advertisers seeking    •   Advertisers: Sentiment and
insights on the state of American       recommendations
                                    •   Advertiser Perceptions study of
media and audio.
                                        brands and agencies
Consumer behavior/sentiment
Daily tracker: Consumer sentiment and media use
  Nuvoodoo National
                            3/14   3/15   3/16   3/17   3/18   3/19   3/20   3/21   3/22   3/23   3/24   3/25   3/26   3/27   3/28   3/29   3/30   3/31   4/1   4/2
  Study: Persons 16-54
I am extremely
concerned about
Coronavirus, I have         25%    25%    24%    34%    35%    37%    38%    40%    40%    44%    44%    45%    50%    47%    46%    47%    48%    50%    48%   50%
significantly altered my
regular activities
I am concerned, but
going about life with a     35     37     37     34     32     33     30     33     31     31     31     28     26     27     29     27     29     27     27    26
few precautions
I am moderately
concerned, but not          30     27     30     24     26     22     23     21     21     18     19     20     17     18     19     19     17     16     18    17
panicked
Not concerned/unaware       11     10      9      8      8      7      8      7      8      7      7      8      8      7      6      7      6      7      7     6
Using media more since
                            69     70     70     77     78     81     82     79     79     82     83     85     85     83     82     81     82     83     84    85
the Coronavirus outbreak
Using radio more since
                            26     24     24     28     31     32     30     27     24     25     30     29     32     33     29     27     28     30     28    30
the Coronavirus outbreak
Using radio for
information on
                            36     34     33     34     35     35     36     36     34     30     32     30     33     36     32     30     31     33     30    33
Coronavirus cases in your
immediate area

Source: Nuvoodoo National Study, Persons 16-54, N = 73,685
Which best describes your current
work situation?
Other,
6%
Still going
At home; to work
outside my
One-third of
I was not
formerly working home, 19%
outside the home,
Americans are 17%
working from home At home,
no longer Working
working from
my regular home, 33%
job, 25%
Source: Nuvoodoo National Study, Sample size = 26,226; 3/26-4/2/20Consumers expect virus decline will take one to six months
30 days or less 10%
How long will it take for the 1 to 3 months 39%
U.S. Coronavirus outbreak to
start declining? 3 to 6 months 35%
Close to 50% of people 6 to 9 months 8%
expect to see the start of
decline within 3 moths, with 9 to 12 months 2%
nearly 85% expecting to see
a decline within 6 months. 12 months or longer 2%
I don't feel like
4%
I could predict
Source: Luth research national study, N=307 weighted to demographics of the U.S. population, March 25, 202061% say consumer spending will resume within six months
Timelines for virus starting to decline vs. spending returning to normal
How long will it take
you to get back to Outbreak decline Spending returning to normal
your normal
spending before the 39%
35%
Coronavirus out
break? 28%
People have a less 21%
optimistic timeframe 14%
12%
for returning to their 10%
8% 8% 8% 8%
7%
normal spending 4%
2%
habits than they do
for the decline of the 30 days or 1 to 3 3 to 6 6 to 9 9 to 12 12 months I don't feel
outbreak. less months months months months or longer like I could
predict
Source: Luth research national study, N=307 weighted to demographics of the U.S. population, March 25, 2020Consumers are spending more on grocery, health &
personal care, and entertainment
In which categories are you
currently spending more, less, or
the same?
Grocery, health & personal care,
and entertainment (including
streaming services, movies, and
games) are the strongest growth
categories this week.
On the other hand, clothing &
accessories, automotive, and
beauty continue to decline.
Source: Luth research national study, N=307 weighted to demographics of the U.S. population, March 25, 2020Americans want uplifting news coverage
% of total U.S. who say they would like to see more of the following in news coverage
54% 55%
50%
43%
36%
32%
6% 7% 20%
None of these Other Opportuinities Topics Investigative Tips on how to Local Positive stories Recovery
for unrelated to resports/ stay healthy updates rates
volunteering Coronavirus analysis on
local
government
strategies
Source: GlobalWebIndex, Coronavirus Research, fielded March 25-30, 2020;
Survey among 2,218 (U.S.) Internet users ages 16-64Americans want to connect with their favorite music artists
% of total U.S. who say they’d like to see the following from music
artists/bands during the Coronavirus disruption
Updates on how they are personally dealing with the pandemic 33%
None of these 31%
Livestreams of virtual performances/gigs 29%
Daily hangouts, live chats/interaction with artists 23%
Artists performing duets via social media 23%
Virtual listening parties 21%
Lessons/tutorials showing how they make their music 19%
Opportunity to collaborate on a new piece of music 14%
Livestreams of virtual DJ sets 12%
Source: GlobalWebIndex, Coronavirus Research, fielded March 25-30, 2020;
Survey among 2,218 (U.S.) Internet users ages 16-64Sports: Americans want exclusive content, interaction
with athletes, and archive/repeats
% of total U.S. who say they’d be interested in seeing the following from
their favorite league/team in light of current disruptions
Exclusive content /behind the scenes videos 20%
Live chat/interaction with athletes 19%
Old cont ent (e.g. archive/repeats) 18%
Livestream of sports on social media 17%
Mobile games 16%
Console games 16%
Esport tournaments (organized multiplayer video game competitions) 14%
Special offers (e.g. free access to subscription content) 14%
Highlights 14%
Gameplay livestreams (e.g . on Twit ch) 13%
I'm not interested in sport s content at the moment 11%
Alt ernative sports (e.g. virtual horse racing/marble racing) 10%
I'm not interested in sport s generally 3%
Other 3%
Source: GlobalWebIndex, Coronavirus Research, fielded March 25-30, 2020;
Survey among 2,218 (U.S.) Internet users ages 16-64The state of AM/FM radio
“Radio in every form –
                                broadcast, streaming audio, and
“Triton Digital Reports         podcasts – remains a trusted and
Growth in News/Talk             relied upon medium for news
Format’s Share of               and entertainment in the United
                                States.
Streaming Amid
COVID-19 Disruption”            Despite the dislocation of many
John Rosso                      workers, this data shows the
President of Market             remarkable stability of the
Development at Triton Digital   medium, as well as the
March 24, 2020                  importance of radio in delivering
                                information in a time of crisis.”
Nielsen conducted an online
survey to determine the impact
the Coronavirus outbreak has
had on AM/FM radio listening.
The survey took place between
Flash survey: March 20th and March 22nd
among a sample of 1,000 adults
AM/FM radio 18+ in the United States.
and COVID-19 As effects of the outbreak
continue to evolve, the results
serve as a snapshot of listener
sentiment in time.Audio listening has increased since the start of the outbreak
Q: Because of the COVID-19 (Coronavirus) outbreak, do you find yourself listening to audio…
AM/FM radio listening: % of adults 18+ % of adults 18+ who answered ‘listening more’
At home 26%
55%
17% 28% Mobile 19%
About
Less More
the same Podcasts 14%
Computer 12%
83% of Americans are listening to
AM/FM radio more or about the same Smart speaker 10%
Source: Custom Nielsen study conducted March 20-22 via an online survey,
based on a weighted sample of 1000 adults 18+AM/FM radio hosts connect in times of crisis
Q: Listening to my favorite radio hosts during the COVID-19 (Coronavirus) restrictions…
% of adults 18+ who answered agree
Makes me feel more informed about
things I need to know 53%
Helps me know about what stores are
open and where I can shop 46%
Makes me feel more connected to my
community 46%
Makes me feel less alone 44%
Makes me feel less stressed 40%
Makes me feel less
concerned/panicked 37%
Source: Custom Nielsen study conducted March 20-22 via an online survey,
based on a weighted sample of 1000 adults 18+AM/FM radio is a trusted source of information
Q: Do you agree or disagree with the statements about radio and COVID-19 (Coronavirus)…
% of adults 18+ who answered agree
I trust radio to give me timely
information
60%
Radio is a good source of information 59%
I trust radio to give me accurate
information
56%
I trust the information I get from my
favorite radio hosts
53%
Source: Custom Nielsen study conducted March 20-22 via an online survey,
based on a weighted sample of 1000 adults 18+Consumers are seeking out AM/FM radio on new platforms
Q: Because of the COVID-19 (Coronavirus) outbreak, and associated restrictions…
% among adults 18+
I've looked for new ways to listen to my
favorite radio station/personality/program 27%
I've used Google or other search engines to
find my favorite radio 26%
station/personality/program
I've sought out new Podcasts to get more
information 13%
I've recently purchased a smart speaker to
listen to streaming radio 6%
Source: Custom Nielsen study conducted March 20-22 via an online survey,
based on a weighted sample of 1000 adults 18+Younger listeners are seeking out new ways to
listen to AM/FM radio
Q: Because of the COVID-19 (Coronavirus) outbreak, and associated restrictions…
% who agree by demo
I've used Google or other search engines to find I've looked for new ways to listen to my favorite
my favorite radio station/personality/program radio station/personality/program
39% 38% 41%
36% 34%
29%
13% 10%
18-24 25-34 35-54 55+ 18-24 25-34 35-54 55+
Source: Custom Nielsen study conducted March 20-22 via an online survey,
based on a weighted sample of 1000 adults 18+AM/FM radio listeners are ready to shop
Q: Which of the following activities do you plan to do in the coming week?
Adults 18+ Daily AM/FM radio listeners
72% 69%
53%
43% 40% 47%
41% 38%
21% 17%
15% 12%
Shop for home Shop for alcoholic Go to a Get take-out food Get gas for my car Shop for groceries
improvement beverages pharmacy/drug from a local
goods store restaurant
Source: Custom Nielsen study conducted March 20-22 via an online survey,
based on a weighted sample of 1000 adults 18+Nielsen: AM/FM radio is crucial during the
Coronavirus outbreak
Trusted source Increased listening Personality connection
Q: Do you agree or disagree with the Q: Listening to my favorite radio hosts during
statements about radio and COVID-19 the COVID-19 (Coronavirus) restrictions…
(Coronavirus)… % of adults 18+ who answered agree
83%
% of adults 18+ who answered agree
Makes me feel more
I trust radio to give me informed about things 53%
timely information 60% I need to know
of Americans say Helps me know about
Radio is a good source
of information 59% they are listening what stores are open
and where I can shop
46%
to AM/FM radio
Makes me feel more
I trust radio to give me
accurate information 56% more or about connected to my 46%
community
I trust the information I the same
get from my favorite 53% Makes me feel less
44%
radio hosts alone
Source: Custom Nielsen study conducted March 20-22 via an online survey,
based on a weighted sample of 1000 adults 18+Americans are listening to more AM/FM radio since the
outbreak, especially those with a higher income
% who say they have started consuming or are consuming more AM/FM radio since the outbreak
28%
26%
23% 23%
17%
15%
U.S. total Gen Z Gen Y Gen X Boomers Higher income
(16-23) (24-37) (38-56) (57-64
Source: GlobalWebIndex, Coronavirus Research, fielded March 25-30, 2020;
Survey among 2,218 (U.S.) and 1,726 (UK) Internet users ages 16-64AM/FM radio listeners working from home/working outside the home are
listening to radio the same or more since the Coronavirus outbreak
Radio use vs. work status since the Coronavirus outbreak
Listening less Listening to radio the same amount Listening to radio more
Still going to work outside my home 12% 54% 34%
Working from home 19% 47% 33%
At home, no longer working my regular job 22% 49% 29%
Source: Nuvoodoo National Study, Percentage of Radio Listeners, Sample size = 20,245; 3/26-4/2/2057% of AM/FM radio listeners are listening to news and
information stations more since the Coronavirus outbreak
Since the COVID-19 outbreak, are you listening to these types of radio stations more/less?
Listening less Listening the same amount Listening more
News & information 10% 33% 57%
Talk (hosts/interviews) 19% 48% 34%
Music (same stations as always) 13% 48% 39%
Music (different/new stations) 18% 50% 32%
Source: Nuvoodoo National Study, Percentage of Radio Listeners, Sample size = 6,487; 3/26-4/2/20If more people are at home, what’s AM/FM radio’s typical share
of ad-supported audio at home?
Share of time spent with ad-supported audio at home vs. at work
Ad- Ad- Ad-
AM/FM radio supported supported supported Podcasts
SiriusXM Pandora Spotify
At work 68% 3% 13% 6% 10%
At home 75% 1% 10% 5% 8%
In car 88% 6% 2% 2% 3%
Source: Edison Research, “Share of Ear,” Q1-Q4 2019. Ad-supported audience shares. Persons 18+96% of homes can listen to AM/FM radio
% of total U.S. population, persons 12+
8% 20%
68% own a radio own a
own a
smart
smartphone (but
speaker
(but no no radio or smart
radio) speaker)
96%
Source: Edison Research/Triton Digital, Infinite Dial January/February 2020 1502 respondentsWhat proportion of AM/FM radio listening occurs
“over the air” and via the stream?
Persons 18+ share of AM/FM radio time spent by location
AM/FM radio over-the-air listening AM/FM radio streaming listening
Total 92% 8%
Car/truck 99% 1%
Work 87% 13%
Home 86% 14%
How to read: Among persons 18+, over-the-air listening accounts for 86% of all time spent with
AM/FM radio at home.
Source: Edison Research, “Share of Ear,” Q1-Q4 2019. Persons 18+AM/FM radio is #1 in smart speaker share of time spent
Share of listening on the smart speaker device among persons 18+
AM/FM radio 23%
Amazon Music 16%
Pandora 11%
Other streaming audio 11%
AM/FM radio share
Owned music 11% of listening on the
Podcasts Spotify 9% smart speaker is
44%
represent a
small share of
smart speakers
SiriusXM 6%
time spent Podcasts 5%
bigger than
Audiobooks 4% Amazon Music
Music videos on YouTube 3%
How to read: Among persons 18+, 23% of listening on the smart speaker in Q4 2019 is to AM/FM radio.
Source: Edison Research, “Share of Ear,” Q1-Q4 2019. Persons 18+Other media consumption
Audio streaming consumption patterns by device have
              remained stable since the first week of Coronavirus

                               Share of total U.S. radio station streaming by device

                     Mobile device                Smart speaker   Desktop/laptop        Other

          3/13-3/19                                   51%            21%               25%      3%

            3/6-3/12                              49%               21%                27%      3%

Source: Triton Digital, Webcast Metrics, March 2020
Streaming shares: News/Talk stations see +14% increase
during the first week of Coronavirus concerns
Share of total U.S. radio station streaming by format
News/Talk Sports Music
3/13-3/19 33% 8% 59%
3/6-3/12 29% 8% 64%
Source: Triton Digital, Webcast Metrics, March 2020What’s happening with Pandora and Spotify? • Spotify streams down: Music Business Worldwide reports a week-on- week fall of 11.4% globally for Spotify’s cumulative Top 200 chart streams for week ending March 19th. • Pandora down: Rolling Stone Magazine reports: “according to numbers from Alpha Data, the data analytics provider that powers the Rolling Stone Charts, streams in the United States actually fell last week… during the week of March 13th through March 19th — the week restaurants and bars across the nation closed and more Americans self-quarantined — streams dropped 7.6 percent, to under 20.1 billion. Programmed streams on services like Pandora dropped 9% to just under 3.5 billion, while on-demand streams (audio and video) dropped 7.3 percent to 16.6 billion.”
Podcasts: one in five Gen Y are listening
                           more since the outbreak
     % who say they have started consuming or are consuming more podcasts since the outbreak

                                                   20%
                                                                                             15%
            13%
                                11%                                    10%
                                                                                 4%
          U.S. total            Gen Z              Gen Y              Gen X     Boomers   Higher income
                               (16-23)             (24-37)            (38-56)    (57-64

Source: GlobalWebIndex, Coronavirus Research, fielded March 25-30, 2020;
Survey among 2,218 (U.S.) and 1,726 (UK) Internet users ages 16-64
Podtrac reports modest reduction in podcast
downloads and audiences
U.S. weekly downloads and audience: All Podtrac measured shows, week-over-week growth (%)
Source: Podtrac weekly podcast data 2020Anything new about audio I should know?
• Edison Infinite Dial 2020 released last Thursday:
Podcasting
• Podcasting continues to soar: Versus last year, ever listened is up 51% to 55%, listened last month
grows 32 to 37%, and listened last week increases 22% to 24%. Monthly podcast audience now 104M.
• Biggest story? Monthly female podcast audiences rise dramatically 29% to 36%, a 24% increase. Male
monthly podcast audiences grow 36% to 39%, an 8% increase. Female audience growth is 3X men.
• Podcast weekly time spent holds at 6 ½ hours a week. Average podcasts listened per week = 6.
Smart speakers
• Smart speaker ownership up from 23% to 27% of Americans. Average number of smart speaker
devices owned increases from 2 to 2.2 per home.
• Smart speakers bring radio back into the home, 68% of homes have a radio, 8% of homes have a
smart speaker but no radio.
Pandora collapse: Weekly audience drops 22% to18%, Spotify up 20% to 22%. Pandora 12-34s are down
28%.
Amazon Music grows weekly audience 9% to 10%, Alexa powers Amazon Music’s growth.
Source: Edison Research/Triton Digital, Infinite Dial January/February 2020 1502 respondentsMillennial 18-34 year-over-year TV use: Most growth has come
from video game consoles and Internet-connected devices
Year-over-year % difference in use, persons 18-34
Internet-connected Week of 3/16/20 vs. 3/18/19
devices include
Apple TV, Roku, +75%
Google Chromecast,
Amazon Fire TV,
smartphones,
computer/laptops
+35%
0%
-10% -9%
DVD playback Time-shifting Live TV Video game Internet-
console use connected
device use
Source: Nielsen National Panel, AA%; Internet-connected Device: Devices connected to the TV that are used to stream
content such as Apple TV, Roku, Google Chromecast, Amazon Fire TV, smartphone, computer/laptops, etc. It is inclusive
of Smart TV apps when used to represent device usage.Persons 25-54 year-over-year TV use: Video game console and
Internet-connected device use has grown significantly
Year-over-year % difference in use, persons 25-54
Internet-connected Week of 3/16/20 vs. 3/18/19
devices include
Apple TV, Roku,
Google Chromecast,
Amazon Fire TV, +78%
smartphones,
computer/laptops
+38%
+7% +7% +15%
Time-shifting Live TV DVD playback Video game Internet-
console use connected
device use
Source: Nielsen National Panel, AA%; Internet-connected Device: Devices connected to the TV that are used to stream
content such as Apple TV, Roku, Google Chromecast, Amazon Fire TV, smartphone, computer/laptops, etc. It is inclusive
of Smart TV apps when used to represent device usage.Nielsen national TV viewing and device usage:
Year-over-year 3/16/20 vs. 3/18/19
Year-over-year P2+ P 18-34 P25-54 P55+
Week Week Week Week Week Week
Week of Week of
Viewing source of of % diff of of % diff 3/18/19 3/16/20 % diff of of % diff
3/18/19 3/16/20 3/18/19 3/16/20 3/18/19 3/16/20
Live TV 13.8 15.2 10% 7.0 6.9 0% 12.1 12.9 7% 24.2 27.2 12%
Time-shifting 2.0 2.3 13% 1.0 0.9 -9% 2.0 2.1 7% 3.2 3.9 22%
DVD playback 0.3 0.4 11% 0.3 0.2 -10% 0.3 0.4 15% 0.3 0.3 -1%
Video game
1.1 1.6 43% 2.1 2.8 35% 1.2 1.6 38% 0.1 0.2 37%
console use
Internet-connected
2.5 4.5 84% 3.1 5.5 75% 3.0 5.3 78% 1.5 2.8 81%
device use
Total use of TV 19.7 24.0 22% 13.5 16.4 22% 18.6 22.4 21% 29.4 34.4 17%
Source: Nielsen National Panel, AA%; Internet-connected Device: Devices connected to the TV that are used to stream
content such as Apple TV, Roku, Google Chromecast, Amazon Fire TV, smartphone, computer/laptops, etc. It is inclusive
of Smart TV apps when used to represent device usage.Top 10 streaming apps in the U.S.
ranked by time spent in app
January-March 2020
YouTube Kids tops Netflix, YouTube Kids
Disney+, and Hulu as the Netflix
streaming app with greatest YouTube
time spent this year Disney+
Hulu
Apptopia | Braze: “YouTube
Amazon Prime Video
Kids is a time-passing,
Tubi
educating, give-me-a-break
Roku
savior for parents.”
Pluto TV
CBS All Access
Source: Apptopia | Braze, 2020: The Year of StreamingAdvertisers: Sentiment and recommendations
Advertiser Perceptions study of brands and media agencies

   Last week (March 16-20), Advertiser Perceptions surveyed national media agencies and brands
   on the impact of the Coronavirus on marketing plans. The full study was released Wednesday,
   March 25th. Key findings:

   •   Advertisers are modifying ad budgets in the short term — not slashing them. Nearly 9 in 10 US
       marketer and agency professionals reported a disruption to their ongoing advertising efforts
       as a result of COVID-19, but only a third said they have completely cancelled a campaign.
       Advertisers expect the worst of the effects to be felt in Q2 2020, but this is likely to be felt for
       several quarters as two-thirds also expect the Coronavirus to result in reduced ad spending in
       2021.

   •   Advertising remains important; immediate focus is on provable outcomes. 60% of advertisers
       agree that just as in other economic downturns, brands that maintain advertising during this
       period will fare better when the economy improves. 65% of advertising decision-makers
       believe the Coronavirus will cause advertisers to focus ad spending on media that could
       drive direct sales outcomes.

Source: Advertiser Perceptions March 16-20, 2020 study of media agencies and brands
Advertiser Perceptions study of brands and media agencies
• Canceled live sports media dollars have been put in limbo, but more
advertisers are working with media partners to re-assign investment than pulling
that money back. TV was one of the media most likely to be pulled, canceled,
or paused - underlying these cuts were the cuts to live and sports programming
- more than two in five advertisers had programming cancelled or moved to
repeats. Fully one-third of advertisers had planned to advertise on TV around
the NCAA tournament.
• Marketers need all the help they can get from partners during this period.
Agencies are a lifeline - just 27% believe the COVID-19 outbreak will result in
further in-housing of media buying. Advertisers are looking for media brands to
"be a good partner" during these challenging times.
Source: Advertiser Perceptions March 16-20, 2020 study of media agencies and brandsHanover Research: While businesses are concerned about decreases in
sales, demand, and productivity, they are waiting to make decisions
Concern is high There is a delay on response planning
80% of organizations are concerned about Opportunity: Use client wait time to
impact on business advise them on how to proceed
Decrease in sales 45% Wait to see trajectory of
impact
30%
Decreased demand 39%
Decreased productivity 35% No plan has been devised 26%
Supply chain disruptions 28%
Revisit strategic plan 24%
Stock value decrease 24%
None of the above 13% Slow/halt investments 10%
Slowing investment 13%
Strategically increase
investments 6%
Decline in brand perceptions 6%
Other 1% Other 4%
Source: Hanover Research, COVID-19 Business Response Snapshot, Week of March 22-28Seven marketing strategies for an uncertain economy
1. Ensure your share of voice exceeds your share of market.
2. Continue to advertise: According to WARC/Millward Brown, it can take up to 5
years for brands to recover from “going dark”.
3. Optimize your creative. Test ads for more memorable brand effects. Superior
creative can generate outsized lifts o ROI and sales effect.
4. Shift more resources to brand building versus sales activation.
5. Place a greater emphasis on emotional campaigns to build your brand more
strongly.
6. Shift budget to AM/FM radio to grow reach even if total budgets are reduced.
7. Focus on, and keep in touch with, the customer, a brand’s biggest asset.
For full report on these strategies, go to https://www.westwoodone.com/blog/Creative recommendations: Advertising during a pandemic
Magid Research, a leading media and marketing research firm with significant expertise on creative
execution, advises the following:
• Core research findings around authenticity, consumer-centricity, and emotional engagement hold,
but marketers should be sure to highlight their compassion, flexibility, and reliability, as well.
• Show compassion and empathy for your customers and community members.
• COVID-19 (coronavirus) has affected local consumers and businesses equally. Show empathy and
understanding of the outbreak’s effects on your community and customers/clients.
• Be sensitive to apprehensive consumers; focus advertising around their needs. Being there for them
aids in building deeper relationships.
• Demonstrate that you are cooperating to help the community recover as quickly and effectively as
possible through your policies/guidelines, whether you do business in person or are able to direct
consumers online. This lends authenticity to your business approach – looking out for the customer is
a number one priority
Source: Magid COVID-19 Advertising Advisory 2020Creative recommendations: Advertising during a pandemic
• Position your business as supportive and exercising the necessary
precautions. For example, “When you need us, we’re here for you. Call
us, text, visit us online or in-store, and know that we continue to take
every recommended health/hygiene effort at our locations to keep
you safe.” How do you answer the question, “What can we do for you,
the consumer?”
• Provide common sense tips and information related to your business on
your website and in your social media posts. There is an opportunity to
strengthen brand loyalty by doing by doing the right thing when you
have the expertise/services/products they need.
• For Magid’s specific creative recommendations for auto dealers, retail,
financial, home, and legal categories please consult the appendix.
Source: Magid COVID-19 Advertising Advisory 2020Thank You
The intellectual property included in the this presentation is property of CUMULUS MEDIA, including Westwood One, and may not be used
without permission. Any details are subject to change. 2020 CUMULUS MEDIA, Inc.Appendix
Auto dealer creative recommendations

  For auto dealer creative, Magid has the following advice:
  • Consider how to reframe your online capabilities and how to let customers know they can
    spend less time in the dealership/on the lot while social distancing recommendations are in
    place.
  • Most automotive advertisers offer their customers online capabilities – buying or even just
    starting paperwork online. This capability lends itself to your messaging: “Shop online, and
    spend less time on the lot by starting your paperwork online/doing it all online.”
  • If delivery is part of your repertoire of services, reframe it in your copy as something you offer so
    consumers don’t have to venture to the lot/can avoid contact during this time.
  • If your dealership doesn’t focus on online paperwork, are you willing to work with customers
    over the phone? Make sure you highlight how you’re making the buying process simple and
    safe during the pandemic.
  • Now is an important time to focus on financing. We know 0% resonates with consumers - if
    that’s an option, use it in your messaging.

Source: Magid COVID-19 Advertising Advisory 2020
Financial and retail creative recommendations
Financial services: Consider how to reframe your commitment to local community members.
• Now is the time to reinforce your customer service and online services. For those who may be
struggling financially as a result of COVID-19, remember to keep your contact details available so
your customers/members/clients feel they have someone in their corner during this challenging
situation.
• Encourage customers/members/clients to reach out via phone and online to talk about options
they have regarding their products and/or investments.
Retail: Consider how to reframe your online capabilities and customer safety in stores.
• Most retailers have online capabilities – even if that simply means browsing. Online purchasing
messages might be even more important during this time. If e-commerce isn’t a strength, focus
your message around efforts you’re taking to limit consumers’ time in the store - curb-side delivery,
home delivery, appointment windows, etc. ensuring they only have limited, if any, contact to
mitigate health risks.
Source: Magid COVID-19 Advertising Advisory 2020Retail creative recommendations (continued)
• Online/email consultations are a great option - offer these through your social media and/or other
advertising, and ask for dimensions and photos to get started for free. Also consider offering video
conferencing to show off inventory to potential customers.
• Financing messages may be increasingly important while some families’ immediate needs may
outweigh their ability to pay cash for products. Is free delivery an option? Consider offering it as part
of your goodwill gesture to your customers.
• Messages about hygiene, availability of sanitizer, hand washing stations, etc. will also remain
important.
• Consider delivery messaging, too. How are our products delivered? Are products protected? Do you
recommend any extra washing of hands or letting products air out, for example? What are the
hygiene practices of the warehouses where your products may come from (or your own if you have
one or several)?
• Consumers will expect you to have these answers, so even if this doesn’t fit in your copy for
traditional advertising, make sure you’re answering it via social media or your website.
Source: Magid COVID-19 Advertising Advisory 2020Home and legal services creative recommendations
Home services: Reinforce the health and safety guidelines your techs take and how this is applicable to your
customers’ home/property.
• Now is the time to focus on expectations for consumers when a tech visits the home. Make mention of your
cleaning processes and how you’re looking out for your customers.
• Financing may become increasingly important as a promotion, as clients will still have needs but may be on
stricter budgets.
Legal services: Reinforce your commitment to your clients and community. messaging to reinforce social distancing
without any blip in service to clients.
• Are you keeping your offices cleaned/sanitized? Are you willing to do online/video consultations for new clients?
Tell them.
• Remind them there are so many ways to get in touch, you’re still there for them, and their circumstances still
matter, even as the world focuses mainly on COVID-19.
• Reassuring your clients and potential clients is key. This is especially true for clients who may be relying on
settlements in the current economic environment.
Source: Magid COVID-19 Advertising Advisory 2020You can also read