It doesn't happen here - The reality of child poverty in the UK - By Neera Sharma with a commentary by Donald Hirsch
←
→
Page content transcription
If your browser does not render page correctly, please read the page content below
It doesn’t
   happen here
The reality of child poverty in the UK

By Neera Sharma with a
commentary by Donald Hirsch

A member of the Campaign to End Child Poverty
‘Living in freezing
temperatures’, ‘mothers
surviving without food to
feed their children’, and
‘scraping for pennies to buy
warm clothes’.
These aren’t tales from
Dr Barnardo’s time.
This is 2007.
Contents
Page
  2    Acknowledgements
  3    Foreword
  4    Executive summary
  8    Section one: Commentary by Donald Hirsch
 16    Section two: Poor children in black and minority ethnic groups
 22    Section three: Poor children in working families
 28    Section four: Lone-parent families
 35    Section five: Families affected by disability
 41    Section six: Poverty in large families
 46    Section seven: Other vulnerable groups
 57    Section eight: Conclusion
 58    Appendix 1: Recommendations
 61    Appendix 2: Methodological note on projections
 62    References
 63    Notes
Acknowledgements
    Barnardo’s is grateful for the help and advice of Donald Hirsch, Lisa Harker, Dr Paul Dornan,
    Child Poverty Action Group, Kate Bell, One Parent Families and Christine Lenehan, Council
    for Disabled Children.  We would also like to thank Mike Brewer and James Browne from the
    Institute for Fiscal Studies for updating and extending the financial modelling on which this
    report draws.

    Many thanks to Julian Walker, Sandra Anderson, Paul Carr, Caroline Day, Meg Fassam-Wright,
    Sharon Gibson, Owen Gill, Jane Glover, Susie Harding, Barbara Healy, Julie Healy,
    Dustin Hutchinson, Kate Ketcher, Mary Lynn, Andrea Marie, Karen McInnes, Dr Tony
    Newman, Eleanor Peters, Nicola Smith and Cheryl White at Barnardo’s. The editing was
    done by Sylvia Potter.

    Our greatest debt of gratitude is to all the families across the UK who told us about their
    experiences of bringing up children on a low income.

    All names in case studies have been changed to protect their identities. Photos are of models.

    Published by Barnardo’s
    Tanners Lane
    Barkingside
    Ilford
    Essex IG6 1QG

    Barnardo’s Registered Charity Numbers 216250 and SC037605

    © Barnardo’s 2007
    All rights reserved. No part of this guide, including images, may be reproduced, stored on
    an unauthorised retrieval system, or transmitted in any form or by any means without prior
    permission of the publisher.

    ISBN 978-1-904659-05-1

    8878/KK/07

    It doesn’t happen here
Foreword
                    This Government’s 1999 pledge to end child poverty in a generation was its
                    boldest, most exciting and potentially most far-reaching social goal.
                    Barnardo’s congratulates the Government on investments such as Sure Start
                    and Tax Credits which have helped to lift 600,000 children out of poverty in
                    the last eight years. That was a remarkable achievement, and a tremendous
                    start. But progress has now stalled.
                    3.8 million children in the UK still live in poverty. In his commentary, Donald
Hirsch shows that – without additional investment – the Government is likely to miss its target
of halving child poverty by 2010 not by just a few thousand, but by 900,000. So we can expect
almost a million more children in poverty in 2010 than we anticipated in 1999.
And this, in the fifth richest nation in the world.
Barnardo’s witnesses every day the impact on children and families of living in grinding poverty.
Children missing out on what most would consider essentials – a good diet, a warm home,
school trips, books, birthday treats. Children suffering bullying, isolation and a deep poverty of
ambition. These effects can last a lifetime – children growing up in poverty have worse health,
worse exam results and, very frequently, will end their adult lives still in poverty.  A child born in
the 1970s was less likely to escape poverty than a child born in the 1950s. Child poverty now
can be a life sentence: that is why investment to reduce it is so vital.
Bringing up children without sufficient money is cruelly difficult for parents who see their children
going without so much which other children take for granted. Those we spoke to for this report
spoke clearly of their anxiety, frustration and hopelessness.  As one of our Mums, Heather, says:
‘You don’t expect life to get any better, you just struggle all the time. You think this is life.’
But things can get better.  And they must. The Institute for Fiscal Studies calculates that an
additional £3.8 billion, two thirds of 1 per cent of this year’s public spending and less than half
the £9 billion paid in City bonuses last year, is needed to halve child poverty in a decade. If
Government chooses not to make this investment, we all suffer. Growing inequalities threaten to
undermine the fabric of society.  And allowing cycles of poverty to continue will bring not just
moral but economic costs – a recent US study estimated that children growing up poor cost
the US economy $500 billion a year, or nearly 4 per cent of GDP. Barnardo’s and the Campaign
to End Child Poverty believe there is a similar economic imperative to reduce child poverty
here. And the moral case is self evident: a rich society such as ours is shamed if it chooses not to
make the investment necessary to give poor children a brighter future.
Shortly we shall have a new Prime Minister. Gordon Brown’s determination to forge a fairer,
more inclusive society is not in doubt. He has a unique opportunity. His actions as Prime Minister
could make the United Kingdom a better place for our children.

Martin Narey
Chief Executive, Barnardo’s and Chair of End Child Poverty
Executive summary
    Introduction                                     had incomes far lower, and in most cases
                                                     well below the Government’s own poverty
    In March 1999 the Prime Minister made a          line.3 For example, Heather,4 a lone parent
    historic and ambitious pledge to end child       with three children, is living on benefits
    poverty within a generation. There are now       of £210.44 a week,5 or £40.56 below the
    600,000 fewer children living in poverty         Government’s own poverty line.6 And Jill,7
    than eight years ago, for whom quality of life   aged 17, lives on her own and is putting
    and future opportunities are improving. But      herself through college on £75 a week.
    far too many children are still left behind.
                                                     Poverty does not only affect children whose
    The lives of 3.8 million children in the UK
                                                     parents are out of work. More than half of
    – I in 3 – are blighted by poverty.1 Child
                                                     poor children in the UK live in families with
    poverty in the UK is double what it was
                                                     at least one earner.8 Ending child poverty
    in 1979 and is well above the European
                                                     requires redistribution through the tax and
    average. After a slow but steady fall in child
                                                     benefits system to provide an adequate
    poverty from the late 1990s, progress now        safety net and to make work pay. It also
    appears to have stalled and on current           requires long-term solutions to address the
    policies there seems little prospect of the      causes of poverty.
    Government meeting its milestone target of
    halving child poverty by 2010.                   Details of poverty figures and projections
                                                     can be found in Appendix 2.
    This report looks at the lives of the poorest
    children, based on interviews with over 40       Keeping the child poverty promise
    families with whom Barnardo’s works in
    different parts of the UK. The interviews        By investing an extra £3.8 billion
    demonstrate the reality of life for those        Keeping its promise to halve child poverty
    most deeply mired in poverty. These include      by 2010 will require the Government to
    children in black and minority ethnic            spend a total of £3.8 billion more by 2010
    families, those in families struggling on low    than currently planned. On current
    wages, lone parent families, families affected   policies, there is little prospect of the 2010
    by disability and large families. The report     target being hit.
    also looks at other vulnerable groups,           What would the £3.8 billion
    including children in asylum-seeking families,   investment mean?
    children in poor housing and young people
                                                     With the additional £3.8 billion
    living independently.
                                                     investment there could be by 2010,
    The case studies illustrate the daily            (compared with 2004/05):
    grinding struggle that low-income families
                                                     n   320,000 fewer poor children in
    face in providing a decent childhood for
                                                         lone-parent families.
    their children.
                                                     n   90,000 fewer poor children in two-parent
                                                         families where one parent works full-time
    The problem: inadequate                              and the other parent does not work.
    incomes and low wages                            n   240,000 fewer poor children in families
    In 2005/06 a couple with two children living         with a disabled adult.
    in the UK spent on average £642 a week.2         n   50,000 fewer poor Pakistani and
    The families interviewed for this report             Bangladeshi children.

    It doesn’t happen here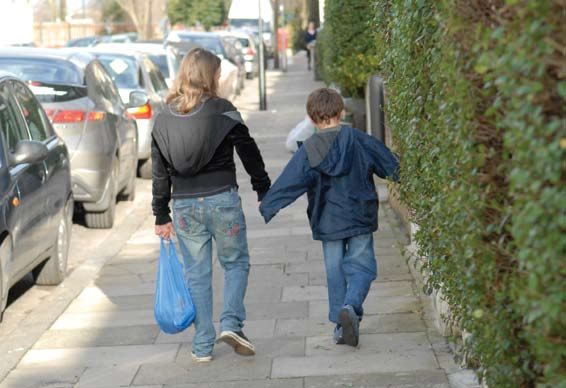
Without the additional £3.8 billion                 prospects for the most vulnerable children
investment there could be by 2010                   with and without the extra £3.8 billion
(compared with 2004/05):                            spending (Figure 1).
n   70,000 more poor children in two-parent
                                                    Figure 1: Projections of child poverty risks to 2010
    families where one parent works full-time
    and the other parent does not work.
n   40,000 more Pakistani and Bangladeshi                      2004/5 poverty rate
                                                               2010 on present policies
    children living in poverty.
                                                               2010 with £3.8 billion investment
n   30,000 more poor children in                         80%

    lone-parent families.                                70%
                                                         60%
In his commentary in this report, Donald                 50%
Hirsch reminds us that ‘the battle to reduce             40%
child poverty has reached a critical juncture’.          30%
The key drivers for the fall in child poverty            20%
to date – more generous tax credits and                  10%
benefits and welfare to work policies, will              0%
see diminishing returns. This is both because

                                                                                rki ,
                                                                                    ng

                                                                                  ren

                                                                                     ld

                                                                                   ian

                                                                                      lt

                                                                                  tish

                                                                                   ent

                                                                                    en

                                                                                       i

                                                                                   ing
                                                                           wo ner

                                                                                  esh
                                                                                  du
                                                                                 chi

                                                                               ildr
                                                                              Ind

                                                                             ork
                                                                             par
                                                                             hild

                                                                             Bri
                                                                       ot ar

                                                                                a

                                                                                d
                                                                           gla
the families lifted out of poverty thus far are

                                                                            ed
                                                                  en ee

                                                                             h
                                                                          ed

                                                                        n-w
                                                                         3c

                                                                         4c
                                                                         ck

                                                                         ne
                                                                        abl

                                                                       Ban
                                                               on ll tim

                                                                      abl

                                                                     bla

                                                                     Lo

                                                                    no
                                                                   Dis
likely to have been the easiest to help and

                                                                   ni/
                                                                 Dis

                                                                 or

                                                               ent
                                                                 u

                                                              ista
                                                              ef

                                                             ck

                                                           par
because the current system for increasing

                                                          Pak
                                                    On

                                                         Bla

                                                        ne
benefits and tax credits allows benefit

                                                     Lo
incomes to fall relative to average earnings.
To meet the Goverment’s target to halve             The first two bars for each group show
child poverty (defined before housing costs)        that for most groups of children the risk of
the number of children in poverty needs to          poverty will change relatively little between
fall from 3.4 million in 1999 to 1.7 million in     2004/05 and 2010 under present policies.
2010. It is currently 2.8 million and needs to      A stark exception, however, is children from
fall by a further 1.1 million.  The Institute for   Pakistani and Bangladeshi families, whose
Fiscal Studies (IFS) has estimated that the         already high risk of poverty is very likely to
additional £1 billion spending on tax credits       increase. The most recent poverty figures
announced in the 2007 Budget will reduce            published in March 20079 seem to show
child poverty by a further 200,000 by 2010.         that poverty for this group is rising, and
This will mean the Government missing its           the IFS projections suggest that this will
target by some 900,000 children.                    continue, with about two-thirds in poverty
On the basis of further estimates by the IFS,       by 2010.
which take account of changes in the 2007           By giving wider help to families
budget, the 2010 target could be achieved           By investing an additional £3.8 billion in
by increasing the child element of child tax        benefits and tax credits the Government
credit by a further £11 a week at 2007              could meet the 2010 target. But a wider
prices and giving families an extra £20 per         range of policy responses is necessary to
week for the third and subsequent children          tackle the root causes of child poverty – to
through the family element of the child tax         remove barriers to work, to ensure that
credit. This would mean the Government              work pays and to ensure that children in
spending £3.8 billion more in 2010 than             poverty now are equipped to escape their
currently planned.                                  parents’ fate and avoid bringing up their
What does this mean for individual groups           own children in poverty.
of children? A further breakdown of the
estimates from the IFS shows the

Executive summary 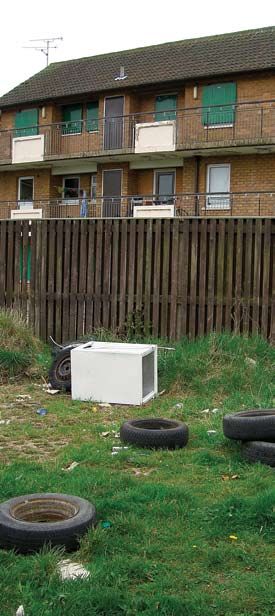
Employment – the case studies show                 raises doubts about the sustainability
    that most parents wanted to work and               of such provision, particularly in poorer
    saw this as a way out of poverty, but              communities. As start-up funding tapers off,
    experienced real barriers to getting a job         nurseries are increasingly charging market
    and staying in it. The lack of ‘soft’ skills and   rates, reducing staff numbers and offering
    qualifications keeps many parents, especially      full-time places instead of part-time ones.12
    lone parents, out of the labour market.            Some may even have to close.
    However, work is not a guaranteed route            The case studies show how the lack of
    out of poverty and Section 3 shows how             appropriate and affordable childcare
    low wages and the high costs of childcare          continues to be a barrier for parents
    mean that parents like Wilson are often no         who want to go back to work. Help with
    better off in work than on benefits.               childcare costs is available through the
    The Government is right to focus on                tax credit system13 but the high costs of
    work as the best route out of poverty.             childcare, especially for families with disabled
    But at present getting a job too often             children or those caring for more than two
    means moving from workless poverty to              children, have the effect of either keeping
    working poverty. As the recent report of           families out of the labour market or leaving
    the Equalities Commission10 made clear,            them no better off in work.
    women and many ethnic minorities still face
    structural disadvantage in the labour market.      Poverty in school holidays – for the
    Employers need to take their responsibilities      majority of children in the UK, school
    more seriously to enable working                   holidays mean holidays away from home
    parents to combine work with parenting             and exciting events and trips. For families
    responsibilities. And to achieve the high skill,   on a low income like the ones interviewed
    high productivity workforce necessary for          for this report, they mean extra hardship
    the UK to compete in the global economy,           – costs on essentials like food go up but
    parents who have been most disengaged              income doesn’t. Holidays become a time of
    from the labour market need targeted help          ‘survival’.14 Compensating families for the
    to get and to progress in work.                    loss of free school meals in holidays would
                                                       help ease the financial pressure and enable
    Childcare – all four UK governments                families to provide some sort of positive
    have made a significant investment in              experiences during holidays, such as a trip
    expanding high quality childcare, particularly     to the cinema or a day out, and build on the
    in disadvantaged communities, through              government’s initiative to offer two weeks
    programmes such as Sure Start Local (now           of part-time holiday provision for children
    children’s centres) and the Neighbourhood          eligible for free school meals.15
    Nurseries Initiative. This has enabled many
    poorer parents to access childcare and to          Fuel poverty16 – a 91 per cent increase in
    return to work – 92 per cent of parents            the retail price of gas since 2003 and a 60
    using neighbourhood nurseries said that            per cent increase in electricity prices have
    this helped them to work, with 22 per              seen a dramatic escalation in the numbers
    cent saying they could not have worked             of households living in fuel poverty. In
    otherwise. The impact was greatest on              2005/06 housing fuel and power accounted
    disadvantaged groups, including lone parents       for almost one fifth of spending in the UK
    and those with no or low qualifications.11         by households at the bottom of the income
    Sure Start Children’s Centres and                  distribution compared to one fourteenth
    Neighbourhood Nurseries benefited from             for those in the top fifth.17
    start-up funding, enabling them to offer           It is estimated that 3.5 million households
    subsidised or even free places to the most         in the UK are living in fuel poverty.18,19
    disadvantaged families. New research               This is exemplified by the families we

    It doesn’t happen here
interviewed, many of whom were struggling          customers are on the cheapest tariffs
with high fuel costs. They were paying more        and not penalised because of their method
because many used pre-payment meters               of payment.
(PPMs) to help with budgeting. Across the
main suppliers, gas PPM customers pay              Debt – many of the families interviewed
an average of £70 more per year than               were in debt, to the Social Fund, doorstep
customers on direct debit and electricity          lenders or friends and family. Many of these
customers an average of £103 more per              loans were to cover the costs of Christmas,
year. Some suppliers have recently cut             birthdays and essential household goods.
prices in response to the fall in wholesale        Lenders, including some reputable High
energy prices – but customers using PPMs           Street names, are charging between 160
have benefited less than others, or not            per cent and 800 per cent interest a year
at all.20  The poorest are being penalised         on loans, trapping families in a vicious cycle
for taking prudent steps to manage their           of debt.21  The Government must give
money so that they are able to pay for their       priority to ending the financial exclusion of
gas and electricity as they use it.                low-income families. This includes a radical
If all four UK governments are to eradicate        review of the Social Fund, which is failing to
fuel poverty for vulnerable groups by 2010         meet current levels of demand: with
and for everyone by 2016 they must work            reform it could promote the financial
with energy suppliers to ensure that all           inclusion of poor families. Banks also need
                                                   to play their part.

  The way forward
  Barnardo’s is asking the Government to keep its promise to millions of children to end
  child poverty within a generation. We call on the Westminster government, and where
  appropriate, the devolved governments of Northern Ireland, Scotland and Wales, to do
  the following:
  n   Invest £3.8 billion to meet the promise to halve child poverty by 201022 and in future
      increase benefits and tax credits in line with earnings to stop the incomes of the
      poorest families falling further behind.
  n   Establish a UK commission on ending child poverty, chaired by the Prime Minister
      or the Chancellor, which would deliver a road map setting out the investment and
      policies needed to hit the 2020 target.
  n   Aim all government funding and programmes at benefiting the poorest children
      the most.23
  n   Extend access to high quality childcare by ensuring adequate funding to sustain
      childcare provision in disadvantaged communities. Reliance on the market alone will
      not deliver for our poorest families.
  n   Tackle the additional hardship in school holidays by compensating families whose
      children get free school meals for the loss of these during the school holidays;24 and
      working with local authorities to ensure that affordable and age-appropriate holiday
      activities and childcare are available for all children.
  n   Tackle fuel poverty by working with the private sector to make sure that all customers
      are on the cheapest tariffs for utilities and are not penalised if they cannot take
      advantage of payment schemes such as direct debit.
  For a full set of recommendations see Appendix 1.

Executive summary 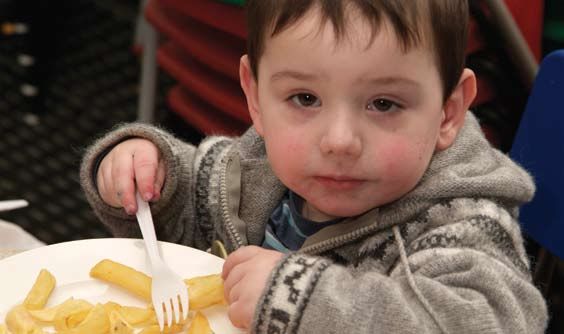
Section one
    Commentary
    by Donald Hirsch
                                                                          25

    A bold ambition and the                             a range of circumstances. It considers for
                                                        example what it is like to bring up a child
    individual lives that lie behind it                 with disabilities on a low income; what extra
    The Government’s target of ending child             stresses are faced by lone parents; what has
    poverty in a generation is its most ambitious       been the experience of poverty of children
    social goal. Eight years after the Prime            from different ethnic backgrounds; how it
    Minister made this pledge, the number of            feels to grow up in poor housing or with
    children living in families with low incomes        uncertain immigration status.
    has fallen substantially. However, there
                                                        Such categories often overlap, and it is
    remains a long way to go, and the latest
                                                        impossible to define a child’s experiences
    evidence seems to show that child poverty
                                                        simply by which ‘group’ they belong in:
    has now stopped falling. Analysis by the
                                                        everyone’s situation is unique. Nevertheless,
    Joseph Rowntree Foundation shows that
                                                        it is useful to consider the overall profile
    continued progress will be tough,
                                                        of individuals sharing certain characteristics
    requiring both a significant amount of
                                                        that increase the risk of facing poverty and
    extra public redistribution and a large
                                                        related hardships, alongside examples of
    improvement in the opportunity for parents
                                                        difficulties faced by individual families.
    to support their own families by getting
                                                        At the end of each chapter profiling
    decently paid jobs.26
                                                        groups in this way, this report looks at what
    One thing that is clear from this analysis          kinds of solutions would help families
    is that a solution based simply on a                within each group, including the particular
    mechanistic redistribution of resources to          families described.
    families whom the government calculates
                                                        Thus, by meeting the Roberts family
    to be poor, though essential, is not enough
                                                        (Section 5), we witness the pressures on
    on its own. A long-term, affordable strategy
                                                        parents who have to look after disabled
    needs to employ a range of measures
                                                        children. In this case, those pressures
    to help improve families’ lives and the
                                                        have had a devastating impact on the
    opportunities open to them. Access
                                                        family’s life, including loss of job and home.
    to training, qualifications, transport and
                                                        In considering solutions, we see how
    childcare for example can influence access
                                                        this tragedy might have been averted
    to jobs that in turn can help lift families out
                                                        through early intervention to give
    of poverty.
                                                        necessary support.
    In order to understand both the nature of
                                                        But not all of the families we meet in the
    the hardship that poverty is causing and the
                                                        pages that follow have ‘catastrophic’ lives.
    nature of the solutions needed to tackle it,
                                                        The everyday pressures experienced by
    we need to understand the experiences
                                                        a lone parent such as Heather (Section
    of families facing different kinds of difficulty.
                                                        4), who has never been able to take
    This report makes a contribution to that
                                                        her children on holiday and has suffered
    understanding, by looking at children in
                                                        from depression, reflect the situation

    It doesn’t happen here
of thousands of families throughout In 2005/06, 2.8 million children were in
the country, for whom lack of income poverty on this measure, before housing
contributes to steady, persistent hardship. costs are taken into account. But 3.8 million
Like many lone parents, she has made were in poverty when looking at how
unsuccessful efforts to re-enter the labour much income their families had left after
market. She might have benefited from deducting housing costs (‘after housing
greater support. costs’ or AHC).27 The after housing costs
Getting into employment is not, however, measure gives a better picture of the net
the whole story. Just over half of children disposable income that helps determine
on low incomes have at least one parent everyday standards of living, and is the
who works, and low pay remains a serious measure primarily used in this report.
problem. In Section 3 we hear how The level of child poverty has come down
Wilson, a single widower bringing up two in recent years, with 600,000 fewer children
young children, works full-time, but on the in poverty on both measures than when
minimum wage, and is plagued by debts and the government announced its target of
high childcare costs, and cannot afford to ending child poverty in early 1999. Yet it is
buy the things his children need. still double what it was in 1979 and remains
This report also tells stories showing how above the European average, and the recent
having a large family, living in poor housing reduction in poverty appears now to have
or being an asylum seeker can affect a come to a halt (see below). Some countries,
child’s experience of poverty. It relates particularly the Nordic countries, have child
particular experiences of families from poverty rates well under half those of the
minority ethnic groups and also briefly UK. Three factors in particular underpin our
considers the consequences of child high child poverty levels:
poverty for young adults. n The relatively large number of children
To set the scene for this discussion, the living with lone parents, who are less
remainder of this commentary gives a brief likely to work than in most countries. Half
overview of child poverty in the UK, of of children in poverty in the UK live with
efforts so far to tackle it and of what more lone parents.
needs to be done. n Wage inequalities in the UK that widened
greatly in the 1980s and remain high.
Why do 3.8 million children in the Low pay in the UK contributes to
poverty: just over half of children in
UK live below the poverty line? poverty have parents who work.
Poverty in the United Kingdom is n Relatively low levels of financial support
conventionally defined as having a for children and for out-of-work families.
household income below 60 per cent of the Targeted improvements in recent years
median; this is to some extent an arbitrary have not yet succeeded in containing
indicator of the complex phenomenon of child poverty to the same extent as
poverty, but is useful because it allows us government intervention in some
to monitor how the incidence of relatively other countries. For example, as shown
low income is changing, in total and for in Figure 2, child poverty measured
specific groups. A relative income measure before government redistribution in
encapsulates the widely shared view that Sweden is similar to the UK. However,
nobody should have a standard of living since Sweden’s benefits system is much
that falls too far below the contemporary more generous, fewer children than in
norm, and by implication that everyone in the UK end up in poverty once these
society should share in the fruits of steadily government transfers have been taken
growing prosperity. into account.
Commentary by Donald Hirsch Figure 2: Child poverty rates before and after cash benefits circa 2003
Source: Eurostat
50 Child poverty rate before transfers Child poverty rate after transfers
45
40
35
30
25
20
15
10
5
0
N ia
D way
Fin k
Sw d
C n
m s
H rg
Re ry
Au ic
Be ia
um
he ce
s
ia
Es n
G nia
Li any
Ire a
G d
e
ng d
m
Slo Po ly
Re gal
Tu c
ey
xe ru
nd
ni
i
ar
ec
e
ai
lan
lan
an
n
r
tv
Ita
bl
bl
do
u
ch ga
rk
N Fran
ed
st
va rtu
ve
Sp
to
ua
lgi
Lu yp
m
bo
m
pu
pu
rla
re
La
te Pol
or
ze un
Slo
en
th
er
Ki
et
k
d
ni
C
U
What does it mean to a child to things that others around them have. While
for some, poverty is a transitory experience,
be in poverty in the UK? for most of those who are poor at any one
Children in poverty in the UK lack many time, it is something they are used to. Over
things. Most obviously, their families lack two-thirds of those classified as poor at any
income. The children themselves lack access one time have been in poverty for at least
to various material things and activities that three of the past four years.
their friends take for granted. Perhaps most
importantly, many children in poverty lack Where and for whom are the
dignity and hope.
risks greatest?
The income threshold that defines poverty
varies according to family type. For example, Child poverty is not evenly distributed
a lone parent with two children aged 5 across the United Kingdom. Being a
and 14 would need £223 a week after member of a particular group, or living in a
housing costs to get above the poverty line; particular area, affects the risk that a child
a couple with children the same age would will be poor.
require £301 (in 2005/06). Being in a lone parent family, having no
No child in the UK can’t afford to eat. parent who works, being in a large family
But many have seriously depleted diets and being in certain ethnic groups all
and many suffer material deprivation. increase the risk.
For example, about 200,000 children At a geographical level, the relative risk
have parents who cannot afford to buy does not vary overall by much in the four
meat or fish every other day, and about constituent parts of the UK: differences in
150,000 who cannot afford to buy them a the headline figures for England, Scotland,
waterproof coat. Many more are unable to Wales and Northern Ireland are small. A
participate in those things that their more notable feature when comparing
friends take for granted. About two in these totals is that they have come down
five lone parents are unable to take their more rapidly in Wales and Scotland than
children on outings or buy them gifts to in England. In Wales, the child poverty risk
take to parties.28 has gone from being greater than the UK
Most importantly, many children grow up average to about the same, and in
persistently poor, having to go without Scotland from being around average to
slightly below.29
10 It doesn’t happen hereWithin English regions, there are families without work, and an increase in
considerable variations. In London, a child the levels of tax credits for people on low
is nearly twice as likely to be in poverty incomes, inside and outside work.
as in the rest of the South East. And the Much emphasis has been put on the impact
relative risks are far greater when looking of ‘welfare to work’ policies. These have
at particular local authorities and especially made a contribution, and in particular, the
wards and neighbourhoods.30 rise in the chance of a lone parent having a
job, from 45 per cent to 56 per cent under
Figure 3: Children at risk of poverty
the present Labour administration, is an
80% unprecedented shift. However, the fall in the
70% number of families without work accounted
for only a small proportion of the reduction
median income after housing costs
60%
Chance of having below 60%
in poverty between 1998/99 and 2004/05
50%
– on one estimate for only one child in six
40% who escaped poverty.32 Many families who
77%
30% 67%
have entered work struggle on low wages
50% 51%
52%
or work relatively few hours, and so have
20% 42% 47%
30% 32%
41% not in fact escaped poverty.
10%
0% Figure 4: Child poverty (millions, after housing costs)
e
nd
on
t*
ily
t
sh
n
i
d
sh
n
ag
do
ol
5.0
ul
re
fam
iti
gla
nd
de
eh
er
ad
on
Br
pa
Lo
En
gla
Av
us
in
rL
ed
ne
k
ho
an
st
ac
n
bl
ne
Lo
Ea
re
/B
bl
isa
n
In
ni
ild
gi
or
th
4.5
D
ta
ch
kin
or
kis
k
ac
N
r
e
wo
Pa
or
Bl
4.4
rm
y
4.3 4.3
od
4.2
ro
4.0
ob
u
4.1
N
4.0
Fo
3.9
3.8
Figure 3 shows a range of factors to do 3.5 3.7
3.6
with place and family characteristics that 2004 – 5 target
cause the risk of child poverty to be above 3.0
average. Obviously, when more than one 2.5
of these are combined, the effects are even
greater. The graph shows that not having a 2.0
working parent remains the most important
predictor of child poverty, and clearly in 1.5
neighbourhoods where large numbers of 1.0
families spend long periods on out-of-work
benefits, the risks are particularly acute. 0.5
0.0
What has brought child
97
8
9
0
1
02
03
04
05
6
9
9
0
0
/0
/
7/
8/
9/
0/
/
/
/
4/
poverty down?
96
01
02
03
05
9
9
9
0
0
19
19
19
19
20
20
20
20
20
20
The child poverty rate fell slowly but A much bigger factor has been the impact
steadily from the late 1990s until recently of tax credits, which have significantly
(see Figure 4). Such a long continuous fall reduced the chance of a child with a
in child poverty has not previously been working parent being poor, and modestly
witnessed in the nearly half a century since reduced the chance that a child with a non-
the relevant data on income distribution working parent is poor. The strongest effect
have been collected,31 and government is on the probability of a child with a lone
policies have contributed to this trend. parent who works part time being below
The two key drivers of this fall have been the poverty line: this fell from 45 per cent
a reduction of the number of children in to 27 per cent in the 1998–2004 period.33
Commentary by Donald Hirsch 11Central government policies play a crucial affect returns to work due to the loss
role, both by setting the structure of welfare of housing benefit) have contributed
to work measures and in determining considerably to high levels of child poverty
the amount of redistribution that takes – which uniquely among English regions
place through the tax credit and benefits have failed to come down in recent years.
system. However, policies and practices at Local authorities need to work closely with
all levels of government can play a part. Job partners in the public and private sectors
prospects depend on the strength of local to improve the ‘infrastructure’ that
economies, on opportunities for transport influences opportunities for parents to
and childcare that enable parents to work, work, and the flexibility for parents to
on action in local communities and in the balance their economic priorities with
long term on education and qualifications. domestic responsibilities.
Devolved administrations, regional bodies
and local government all have a part to play What more needs to be done?
in these policies. The battle to reduce child poverty has
It is beyond the scope of this report to reached a critical juncture. It became
enumerate all the actions that need to apparent in 2006 that under present
come together to create better-functioning policies, the steady fall in the child
communities that can contribute to ending poverty rate seen in recent years is likely
child poverty. However, two phenomena to come to an end.35 This analysis has
illustrate the degree to which it is not just a been corroborated by a flattening in the
task for the Westminster government. downward trend, evident in Figure 4,
previous page. The apparent small rise in
First, it is notable that in Scotland, Wales and
the child poverty total in the data released
Northern Ireland there have been elements
in March 2007 was disappointing. However,
of a distinctive approach to tackling child
the rise was not statistically significant,36 and
poverty. Scotland’s programme for ‘Closing
a single year’s data should be interpreted
the Opportunity Gap’ takes a six-pronged
with caution. But the figures are consistent
approach to reducing child poverty that is
with the hypothesis that, since the last big
heavily weighted towards ‘prevention’. In
hike in tax credits in 2003, the downward
particular, this programme aims to support
trend in child poverty has not continued.
sustained employment for at-risk groups,
a strategy now being taken up elsewhere A flattening out of child poverty at the
in the UK. In Wales, the relatively rapid present level would leave about twice as
fall in child poverty appears to coincide many children in poverty as there were
with the advent of the Welsh Assembly, a generation ago, at a level that is widely
which has aimed to target particular considered unacceptable.
communities, such as the Valleys, where Behind these projections are several
worklessness has been most concentrated, harsh realities:
thus taking a more geographically focused
approach. In Northern Ireland, there has n We still have a system for increasing
been a particular emphasis on reducing benefits and tax credits which allows the
worklessness rates overall, which are much incomes of people depending on them
higher than in the rest of the UK but have to fall relative to average earnings. More
been falling more quickly.34 generous upratings, which are needed
in the long term to tackle poverty
A second point to note is the importance effectively, imply considerable extra costs
of local conditions in affecting barriers to to the Exchequer compared with current
work. These are particularly important plans. Put another way, if the regular
in London, where difficulties in finding uprating method continues to give zero
affordable childcare and high rents (which
12 It doesn’t happen herereal growth in certain benefits, poverty This shows the need for a mix of policy
targets will become progressively harder responses to combat poverty. In the
to hit as median incomes rise in real medium term, it implies more redistribution
terms. The poorest families will fall further and better-resourced welfare to work
and further behind the affluent majority. programmes. In the longer term, it raises
n Continued progress in getting more wider issues about the factors that
people into jobs, in particular lone influence opportunities from one
parents, can have a positive impact, but generation to the next, most particularly
progress on this front will not be rapid. how to overcome severe inequalities in
In the medium term, on an optimistic outcomes in education for children from
scenario, the welfare to work effect on different social backgrounds.
child poverty will barely be enough to The sections in this report consider
offset the effect of not uprating benefits particular ways in which different
and tax credits as fast as the growth groups of children can be helped in the
in average earnings, referred to above. near future. To put these in context, it is
Moreover, a strategy of bringing more worth considering what the trend is likely
people into the labour market will only to be for disadvantaged groups under
be sustainable with intensive investment present projections.
in helping those who need support. As
has been suggested by the recent Freud What are the immediate
review,37 this will be hard to reconcile
with current cuts in the DWP budget. prospects for different groups
n In the long term, it will only be possible
of children?
to reduce child poverty at an acceptable The Joseph Rowntree Foundation’s (JRF)
public cost if increases in benefits/ assessment of future trends in child
tax credits through redistribution of poverty38 estimated in 2006 that it would
income are combined with improved be necessary to spend about £4 –5 billion
opportunities in work for the worst off. more on benefits and tax credits than
This means not just more people getting under present plans by 2010 to meet the
jobs, but an improvement in earnings that target of halving child poverty from its
helps reduce working poverty without 1998/99 level.39 Even taking into account
excessive dependence on tax credits. extra resources put into tax credits in the
Part of this depends on employers 2007 Budget, around £4 billion will still
taking a share of responsibility by ending be needed (see Box A overleaf). These
poverty wages. To some extent, the estimates assume that the government gets
tax credit regime allows employers to most of the way to meeting its 2010 target
pay staff poorly, in the knowledge that of increasing the lone parent employment
the government will supplement their rate to 70 per cent. Specifically, they assume
employees’ wages. a 67.5 per cent employment rate for lone
parents. This would require a rise of 11
n But it also requires the next generation
percentage points between 2006 and 2010,
of parents to get better qualifications, and
or nearly three percentage points a year.
hence depends on improved outcomes
This is three times as fast as the rate of
from the education system. It is also
increase over the past 14 years, and the
desirable to reduce the number of
assumptions made in the JRF’s modelling
people facing very high effective marginal
are thus already very optimistic about the
tax rates as they lose tax credits and
success of welfare to work policies.
benefits when income rises, a potential
disincentive to progressing in work and
earning more.
Commentary by Donald Hirsch 13Even with such optimism, the JRF argued
BOX A: in 2006 that without extra investment, the
fall in child poverty is likely to cease.43 This
The 2007 Budget and the analysis was confirmed by the 2005/06
2010 child poverty target poverty figures, published in March 2007,
In 2007, the Chancellor announced a which showed no further fall in poverty
number of measures to tackle child but rather the small, though statistically
poverty. The most significant was a insignificant, rise referred to above.44 As
rise of £3 a week above the normal set out in Box A, the increase in tax credits
increasing in line with earnings of the announced in the 2007 Budget should
child element of the child tax credit, start moving child poverty downwards
which goes to families on low incomes. again, but nowhere near enough to meet
This will cost £1 billion by 2009. the 2010 target. This will require at least
The Institute for Fiscal Studies (IFS) about £3.8 billion more to be allocated to
confirms the Chancellor’s estimate similar measures.
that this change in the 2007 Budget
What does this mean for individual groups?
will reduce child poverty by about
On the basis of further estimates supplied
200,000.40 Specifically, the IFS projected
by the Institute for Fiscal Studies, Figure 5a
in 2006 that child poverty in Great
looks at the prospects for children with
Britain41 would fall only marginally, from
various characteristics, with and without the
2.7 million in 2004/05 to 2.65 million
extra spending package suggested by the
in 2010/11 (using the government’s
Rowntree report. It should be emphasised
preferred poverty measure).42 Based
that these estimates are based on projecting
on the Budget increase, it now projects
risks for individuals based on existing
a more substantial fall, to 2.47 million.
characteristics and behaviours, and must be
But this would still be a long way above taken as indicators of what might be, not as
the target of 1.6 million in 2010, half firm predictions.
of what it was when the target of
ending child poverty was announced. Figure 5a: Projections of child poverty risks to 2010
For the extra 900,000 children to be
2004/5 poverty rate
taken out of poverty, a similar package
2010 on present policies
to that originally suggested by the 2010 with £3.8 billion investment
Joseph Rowntree Foundation would be 80%
needed. For example, the target could 70%
be achieved by increasing the child 60%
element of child tax credit by a further 50%
£11 a week in 2007 prices, and giving 40%
30%
families an extra £20 per week for
20%
third and subsequent children through
10%
the family element of the child tax 0%
credit. This would cost £3.8 billion, half
rki ,
ng
en
ld
ian
lt
tish
ent
ren
hi
ing
wo ner
adu
des
chi
r
Ind
ork
par
hild
hild
Bri
a billion less than the earlier estimate.
ot ar
gla
ed
en ee
d
n-w
3c
4c
k
ne
e
abl
Ban
lac
on ll tim
abl
Lo
If the extra £20 was channelled
no
Dis
rb
ni/
Dis
ent
u
ko
sta
ef
through child benefit for the third
par
i
c
Pak
On
Bla
ne
and subsequent children to help large
Lo
families, this would cost £4.2 billion,
compared to £4.7 billion in the
earlier projections.
14 It doesn’t happen hereThe first two bars for each group in Figure years? To do so, it will need to take some
5a show that for most groups of children, big decisions, as well as many smaller ones.
the risk of poverty will change relatively The big decisions involve coming up with
little between 2004/05 and 2010 under substantial extra resources, continuing and
present policies: the projected 8.5 per cent expanding the increases made in the 2007
fall overall, from 2,700,000 to 2,470,000, Budget. The many smaller actions involve
will not produce a significant change for all addressing the particular problems of the
groups: for some, the risk of poverty will groups described in this report, and
stay about the same. A stark exception, taking the measures necessary to address
however, is children in Pakistani and their needs. The stories of individual
Bangladeshi families, whose already high risk hardship, frustration and loss of dignity
of poverty is set to increase further, from that are related on the pages below
57 per cent to 65 per cent. Indeed, this remind us why a renewed commitment
rise is already shown in the most recent to tackling poverty is not just a desirable
poverty figures published in March 2007.45 policy move but a duty for all of us in a rich,
Pakistani and Bangladeshi families have a enlightened society.
low employment rate, have on average
more children than families overall and are Figure 5b: A reversal of fortunes? Poverty risks of
severely affected by the failure to uprate selected groups, 1998 – 2010
benefits in line with earnings.
Non-working lone parents
Figure 5a also shows that, by spending All lone parents
Single earner couple
a total of £3.8 billion a year more than 90%
presently planned, the prospects of 80%
vulnerable groups could be improved 70%
greatly by 2010. This amounts to an increase 60%
equivalent to less than 1 per cent of public 50%
spending (or 0.3 per cent of current GDP). 40%
To put these changes in context, Figure 5b 30%
looks at three examples of groups 20%
of children in terms of their changing 10%
prospects over the first decade of 0%
1998/9 2004/5 2010 on
government targets. All could see an end to present trends
the improvement of their fortunes under
present policies, even after the 2007 Budget.
For children of lone parents, this would not
involve giving up most of the gains seen
to date. In particular, the benefit of having
more lone parents in work would persist.
However, for a child of a single-earner
couple, about half of the (relatively small)
reduction in poverty risk since 1998/99
would be lost under this scenario.
This leaves the Government with a very
serious challenge. Whether or not it
meets its demanding targets, can it at least
maintain the momentum in tackling child
poverty that it has achieved in recent
Commentary by Donald Hirsch 15Section two
Poor children in
black and minority
ethnic groups
Poverty rates vary enormously according to the ethnicity of
the household. Sixty-seven per cent of children in Pakistani and
Bangladeshi families, 51 per cent of black and black British children
and 48 per cent of children in Chinese or other ethnic groups live
in poverty – compared with 27 per cent of white children.46 This
presents the government with a serious challenge – without targeted
policies, ethnicity will continue to determine children’s life chances.
The facts
Worklessness is one of the key drivers for the higher poverty rates for some ethnic
minority groups – while the UK has an overall employment rate of 75 per cent of
all working adults, this falls to only 60 per cent when looking solely at working age
individuals from ethnic minority populations.47
n Employment rates for women vary significantly – 72 per cent of white women are
economically active compared with just 27 per cent of Bangladeshi and 30 per cent
of Pakistani women.48
n Work it is not a guaranteed route out of poverty – 54 per cent of Pakistani and
Bangladeshi children in working households are in poverty compared to just 12 per
cent of white children.49 People of ethnic minorities do not, in general, get the jobs
that their qualification levels justify.50
n Education is another key driver for higher poverty rates – the achievement gap
between 16-year-old white pupils and their Pakistani and African-Caribbean
classmates has almost doubled since the late 1980s.51
16 It doesn’t happen hereCase study 152, 53
Anna – Barnardo’s Tuar Ceatha Project, Belfast
Anna is from mainland China and has discounted travel and affordable activities
two small daughters aged 5 and 9. such as swimming and after-school clubs.
The family received tax credits as her
husband worked part-time. When Anna Anna is one of the Chinese and
and her husband separated there was a Vietnamese families with young
mix-up on her income support and tax children who use Barnardo’s Tuar
credits and she is paying back £2,000 Ceatha (‘Rainbow’) service in Belfast.
from her weekly benefit of £180.75, Staff who themselves come from the
which includes disability living allowance. Chinese community and are trusted
Anna has limited English and really by the families, are able to guide
struggles with the letters regarding her them through the maze of health,
benefits. She spends £60 a week on education, benefits and employment
food and has very little left over for any services. They also provide help and
extras. She is unable to take her children friendly advice if families, who may
to any activities or on outings. The family be isolated and without the support
is isolated from family and friends. of relatives, face difficulties looking
after their children.
Anna used to work in a Chinese take-
away but has not worked since her first
child was born, as she has no childcare.
As her children are now at school she
would like to work in the mornings but
the barriers to this are her poor health
and limited English. She is, however,
attending a local Chinese community
group, where she is getting help with
her English.
Anna says that a number of things
could make a difference for her and
her daughters, for whom she has high
aspirations. She would like parenting
education to improve her parenting skills:
‘I don’t know how to help them to learn…
I know the family unit here is not in a
healthy way.’
Anna would also like help and advice
about her finances: help in finding a job
she could do in the mornings; advice on
Poor children in black and minority ethnic groups 17Case study 252, 53
Leah – Barnardo’s Priory Family Centre, Barnsley, Yorkshire
Leah is a lone parent with one are people doing drugs around here and
daughter Emily, who is 14 months old. don’t want to get caught up with them.’
Leah is of mixed race and her daughter Leah would like to be able to attend
has a white father. She is a recovered social activities for her and her
drug addict: child but generally cannot afford them.
‘There was a lot of drugs around in the She says:
area when I was growing up. I took it ‘Priory is the only place around where I
to make myself feel better because I’d can go and be like the other mums.We
been abused by a family friend and I was don’t have to pay to come here… only for
bullied all the time at school about race drinks if we have some spare money.’
– it’s mostly white around here. I wouldn’t
like my daughter to go through the same For Leah the future for herself and her
as me.’ daughter looks far from hopeful:
Leah does not work – her previous ‘I see our future as being bleak really.
drug addiction has resulted in her losing I don’t look forward because there’s
all confidence – but she would like to nothing to look forward to.We can’t afford
work when Emily goes to school. Due anything to change. Everything we get is
to the previous abuse she cannot only because someone else buys it for us.
trust anyone but her mum to take care I don’t think Emily will achieve what the
of Emily. other kids will because I can’t afford
Leah lives on benefits of £119.28 a college or university. Even if I do work,
week – the poverty line is £14554 – and what I bring in still won’t pay for that.’
she borrows from her mum and step
dad. Leah describes the impact of living
Leah and Emily both attend
on a low income:
Barnardo’s Priory Family Centre in
‘We only have a basic living. I can’t afford Barnsley. Mothers and fathers say
to do anything else.We don’t struggle it’s a friendly place where they are
for food because my mum helps us out. not judged when they speak to staff
I don’t ever save any money – there is about their problems. Leah can take
nothing left to save. I wish I could. time for herself, knowing that Emily
Emily misses out on lots of things. I can’t is happy at the nursery. This way
take her swimming or to playgroups or she can begin to improve her own
any activity as they will have to be paid self-confidence, and start to plan
for and I can’t afford it. I can’t take her ahead for herself and her daughter.
out to parks and things like that as there
18 It doesn’t happen here‘I can’t take her out to parks and things like that as there are people doing drugs around here and don’t want to get caught up with them.’
Towards the Government’s 2010                      inactive women of Pakistani and Bangladeshi
                                                        origin would like to work.57
     and 2020 poverty targets
                                                        The Government has established the
     Keeping the 2010 promise to halve                  Ethnic Minority Employment Task Force to
     child poverty by giving families an                address the main factors in ethnic minority
     adequate income                                    employment disadvantage. Other initiatives
                                                        such as Fair Cities, Partner’s Outreach and
     On present policies, by 2010 there are
                                                        the new City Pilots aim to close the ethnic
     projected to be:
                                                        minority employment gap.
     n    40,000 more Pakistani and Bangladeshi
                                                        Pilot projects such as those described above
          children in poverty than there were in
                                                        can have some positive impact at a local
          2004/05.
                                                        level, but it is very unlikely that these will
     n    10,000 more black or black British children   be sufficient to tackle structural barriers to
          in poverty than there were in 2004/05.        employment. To achieve this all
     With the £3.8 billion investment, by 2010          mainstream programmes, such as the
     there would be:                                    New Deals and Pathways to Work, would
                                                        benefit from increased investment in skills
     n    50,000 fewer children in Pakistani and        development. They must also be better
          Bangladeshi families in poverty compared      attuned to the needs of ethnic minority
          with 2004/05                                  families. Only 1.3 per cent of participants
     n    40,000 fewer children in black or black       on the New Deal for Disabled People are
          British families in poverty compared with     Pakistani or Bangladeshi.58
          2004/05
                                                        Early years childcare and education
     n    20,000 fewer children in Indian families in
          poverty compared with 2004/05.                The Government’s childcare agenda,
                                                        with the establishment of Sure Start
     Keeping the 2020 promise to end                    Children’s Centres in England, and related
     child poverty – by investing in                    programmes in Scotland, Wales and
     supporting families                                Northern Ireland, recognise the importance
     A range of other measures will also be             of early years provision.
     needed to help improve the prospects of            There is evidence that disadvantaged
     these groups. These are set out below.             children benefit significantly from good
                                                        quality pre-school experiences, especially
     Employment                                         where this promotes better intellectual
     On present policies, the gap between the           and social development.59  Yet children
     employment rate of the white and ethnic            from some ethnic minority groups are not
     minority population will take until 2105           accessing childcare provision – for example
     to close. If we are to address persistent          around 75 per cent of Asian children have
     disadvantage and lift ethnic minority              not accessed any form of formal childcare in
     children out of poverty, we must make              the last year, compared to only 54 per cent
     narrowing this gap quickly a priority.55           of white children.60

     Harker56 cautions against dismissing the           Early years and childcare programmes
     employment gap due to ‘cultural’ differences       must extend their reach to ethnic minority
     when there is clear evidence of the                families to encourage them to take up
     significant barriers that ethnic minority          nursery places and where necessary
     groups face in entering and progressing in         provide effective targeted support to
     work. Furthermore, there is evidence that          ensure that early disadvantage does not
     contrary to stereotype, many economically          result in long-term underachievment.

20       It doesn’t happen here
Educational underachievement children had been racially insulted.65
The achievement gap between 16-year- A number of initiatives have been
old white pupils and their Pakistani and introduced to help ethnic minority pupils
African-Caribbean classmates has roughly to overcome the barriers they face in
doubled since the 1980s.61 In some urban education. In particular the government’s
authorities, African Caribbean pupils are ‘Aiming High’ initiative has shown some
now entering compulsory schooling as the success both in raising the attainment of
highest achieving group based on baseline African Caribbean pupils and ensuring that
assessments but leaving as the group least race equality is firmly on the agenda. The
likely to gain five high GCSEs.62 Teaching and Learning 2020 Review Group
The explanations for educational has made a number of recommendations
underperformance are complex and on new forms of assessment and
include the concentration of certain personalised learning which the DfES is
ethnic minority groups in deprived areas.63 considering. Such initiatives, if adequately
Negative stereotypes about black pupils as funded and accessible to all children, could
‘threatening’ are common and black pupils have a positive impact on the education of
are three times more likely to be excluded ethnic minority children.
from school.64 Ethnic minority children More broadly, continued efforts are needed
continue to suffer racial abuse despite to reduce the exclusion rates of African-
attempts by schools to tackle racist bullying. Caribbean pupils and to tackle racism and
In one London borough, 29 per cent of bullying in schools.
The way forward and childcare provision, but children from
Employment – the ethnic minority some ethnic minority groups are still not
‘employment penalty’ must be ended to accessing this.
encourage and enable more parents to The DfES must work more pro-actively
enter the labour market in jobs that pay with early years and childcare providers
decent wages. to enable them to extend their reach
The DWP must urgently review why to ethnic minority families and where
welfare to work programmes are necessary provide targeted support
failing many black and ethnic minority including free or subsidised places for
parents and publish an action plan poorer families.
to address this. This should include a Educational under-achievement
measurable target for Jobcentre Plus – closing the achievement gap between
staff to increase participation in the New white pupils and their ethnic minority
Deals. It should also set out how the skill (particularly Pakistani and African-
levels of parents from black and ethnic Caribbean) classmates will be crucial in
minority communities will be improved breaking the cycle of poverty.
so that they can earn a decent wage The DfES must promote the personalised
– for example by investing in local adult learning agenda so that it supports
learning programmes, using initiatives children from black and minority ethnic
such as the new City Pilots. groups in their learning. The agenda
Early years and childcare – tackling should also be used to reduce the higher
early disadvantage will be key in breaking exclusion rates of some BME groups
the cycle of poverty. There is evidence pupils by intervening early, identifying
that disadvantaged children benefit problems, and supporting pupils and
significantly from good quality early years teachers.
Poor children in black and minority ethnic groups 21You can also read