It's about how we get it done - 2017 FACT BOOK - WW Grainger, Inc.
←
→
Page content transcription
If your browser does not render page correctly, please read the page content below

It’s about how
we get it done
         2017 FACT BOOK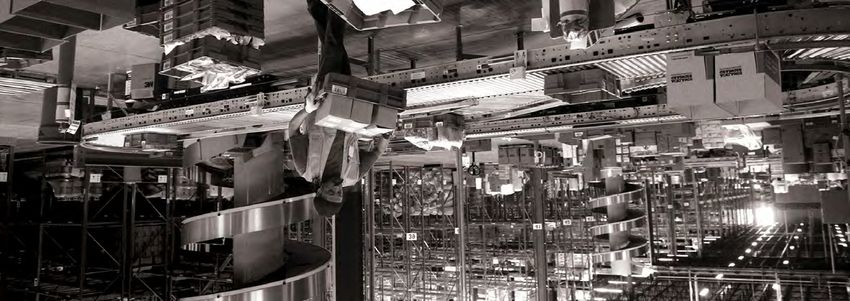
CONTENTS                                                                      W.W. Grainger, Inc. is a broad line, business-to-business distributor
                                                                              of maintenance, repair and operating (MRO) supplies and other
                                                                              related products and services. More than 3.2 million businesses and
At a Glance     . . . . . . . . . . . . . . . . . . . . . . . . . .       1
                                                                              institutions worldwide rely on Grainger for products such as safety
Strategy   . . . . . . . . . . . . . . . . . . . . . . . . . . . .        2
                                                                              gloves, ladders, motors and janitorial supplies, along with services
Creating Unique Value          . . . . . . . . . . . . . . . . . .        4
                                                                              like inventory management and technical support. These customers
U.S. Large     . . . . . . . . . . . . . . . . . . . . . . .              5
                                                                              represent a broad collection of industries including commercial,
U.S. Medium       . . . . . . . . . . . . . . . . . . . . . . . .         6
                                                                              government, healthcare and manufacturing. They place orders online,
Single Channel       . . . . . . . . . . . . . . . . . . . . . . . .      7   on mobile devices, through sales representatives, over the phone and
Canada     . . . . . . . . . . . . . . . . . . . . . . . . . . . . . .    8   at local branches. Approximately 5,000 suppliers provide Grainger
International     . . . . . . . . . . . . . . . . . . . . . . . . .       9   with more than 1.6 million products stocked in Grainger’s distribution
Creating an Effortless Customer Experience .                   . . .     10   centers (DCs) and branches worldwide. For more information on
Creating Shareholder Value .            . . . . . . . . . . . . . .      12   Grainger, visit www.grainger.com/investor.
Operating Responsibly .          . . . . . . . . . . . . . . . . .       14
Helping Each Other Grow and Succeed .                    . . . . . .     15
Financial Definitions and Reconciliations .                . . . . .     16
Consolidated Statements of Earnings                 . . . . . . . .      17
Consolidated Balance Sheets              . . . . . . . . . . . . .       18
Consolidated Statements of Cash Flows                    . . . . . .     19
Historical Financial Summary              . . . . . . . . . . . . .      20
Grainger Leadership Team              . . . . . . . . . . . . . . .      22
Board of Directors        . . . . . . . . . . . . . . . . . . . . . . 23      FORWARD-LOOKING STATEMENTS
Corporate Governance .           . . . . . . . . . . . . . . . . .       24   All statements in this Fact Book, other than those relating to historical facts, are “forward-looking statements.”
                                                                              These forward-looking statements are not guarantees of future performance and are subject to a number of
Company Information            . . . . . . . . . . . . . . . . . .       25
                                                                              assumptions, risks and uncertainties, many of which are beyond the company’s control, which could cause
                                                                              actual results to differ materially from such statements.

                                                                              These statements include, but are not limited to, statements about future strategic plans and future financial
                                                                              and operating results. Important factors that could cause actual results to differ materially from expectations
                                                                              include, among others: higher product costs or other expenses; a major loss of customers; loss or disruption
                                                                              of source of supply; increased competitive pricing pressures; failure to develop or implement new technologies
                                                                              or business strategies; the outcome of pending and future litigation or governmental or regulatory proceedings,
                                                                              including with respect to wage and hour, anti-bribery and corruption, environmental, advertising, privacy and
                                                                              cybersecurity matters; investigations, inquiries, audits and changes in laws and regulations; disruption of
                                                                              information technology or data security systems; general industry or market conditions; general global
                                                                              economic conditions; currency exchange rate fluctuations; market volatility; commodity price volatility;
                                                                              labor shortages; facilities disruptions or shutdowns; higher fuel costs or disruptions in transportation services;
                                                                              natural and other catastrophes; unanticipated weather conditions; loss of key members of management;
                                                                              Grainger’s ability to operate, integrate and leverage acquired businesses; changes in credit ratings; changes
                                                                              in effective tax rates and other factors, which can be found in the company’s filings with the Securities
                                                                              and Exchange Commission, including the company’s most recent periodic reports filed on Form 10-K and
                                                                              Form 10-Q, which are available on the company’s Investor Relations website.

                                                                              Caution should be taken not to place undue reliance on the company’s forward-looking statements and the
                                                                              company undertakes no obligation to publicly update any of its forward-looking statements, whether as a
                                                                              result of new information, future events or otherwise.
AT A GLANCE W.W. GRAINGER, INC.
(AS OF 12/31/16)

2016 SALES                                                                 2016 SALES
Customer Category                                                          Product Category

                                     Heavy Manufacturing 17%                                                 Safety and Security 18%       HVAC 5%
                                     Other 16%                                                               Material Handling 12%         Electrical 5%
                                     Government 14%                                                          Metalworking 12%              Lighting 4%
                                     Commercial 13%                                                          Cleaning and Maintenance 9%   Fluid Power 3%
                                     Light Manufacturing 13%                                                 Other 9%                      Power Tools 3%
                                     Contractor 9%                                                           Hand Tools 8%                 Power Transmission 2%
                                     Transportation 6%                                                       Pumps, Plumbing and           Specialty Brands 2%
                                     Retail/Wholesale 5%                                                       Test Equipment 7%           Motors 1%
                                     Natural Resources 4%
                                     Reseller 3%

GEOGRAPHIC OVERVIEW

                                                                   MRO MARKET             MARKET          BRANCHES        DISTRIBUTION       APPROXIMATE NUMBER
                                                                      SIZE 1              SHARE                             CENTERS          OF CUSTOMERS SERVED
                                                                                                                              (DCs)                 IN 2016

UNITED STATES                                                    > $125 billion         6 percent           2842               18                 1,890,000
Includes: Grainger Industrial Supply, E&R Industrial,
Imperial Supplies, Techni-Tool, Zoro U.S.3

CANADA                                                            > $11 billion         7 percent           151                 5                     65,000
Includes: Acklands–Grainger Inc., WFS Enterprises Inc.

LATIN AMERICA                                                     > $16 billion         1 percent            31                 3                     50,000
Colombia, Dominican Republic, Mexico, Panama,
Peru, Puerto Rico 4

JAPAN                                                             > $41 billion       ~ 2 percent            0                  3                   948,000
MonotaRO Co., Ltd.

ASIA                                                              > $93 billion       < 1 percent            0                  1                      9,000
China

EUROPE
Fabory: Belgium, Czech Republic, France, Hungary,                 > $34 billion       < 1 percent            70                 2                     80,000
The Netherlands, Poland, Portugal, Romania, Slovakia
Cromwell: United Kingdom5                                         > $16 billion         2 percent            62                 1                     57,000
Zoro Europe: Germany                                              > $30 billion       < 1 percent            0                  0                   180,000

TOTAL                                                          > $366 billion1         3 percent            598                33               > 3,200,000

1
    Estimated MRO market size where Grainger has operations. The total worldwide MRO market is approximately $550 billion.
2
    Comprised of 254 stand-alone branches, 28 onsite branches and 2 will-call express locations.
3
    For segment reporting, Zoro U.S. is reported in Other Businesses.
4
    Although Puerto Rico is a U.S. territory, the company manages this business as part of Latin America.
5
    Cromwell also has operations in Europe, Africa and Asia, representing approximately 12 percent of its revenue.

                                                                                                                          W.W. GRAINGER, INC. AND SUBSIDIARIES     1
STRATEGY

    I
              n the large and fragmented MRO industry, Grainger holds an                  Over the past three years, Grainger has invested heavily to configure its
              enviable position with its advantaged infrastructure, broad                 business to meet the evolving needs of its customers. With a robust IT
              product offering and deep customer relationships. MRO markets               infrastructure and supply chain in place, in 2016 the company established
have grown in line with gross domestic product (GDP) over the long term, but              strategic priorities for its five focus areas: U.S. Large, U.S. Medium, Single
growth has slowed during the past few years. This deceleration is a result                Channel, Canada and International (see below).
of a weak industrial environment driven by contraction in the energy sector.              As a result, Grainger is well-positioned to:
Despite these challenges, the global MRO market remains an attractive space               •   Create unique value for a broader set of customers, resulting in stronger
with ample opportunity for broad line distributors such as Grainger that are
                                                                                              volume growth across more customer types and existing geographies.
able to leverage scale positions in purchasing, supply chain and IT systems
                                                                                          •   Improve the customer experience through a competitively advantaged
to better serve customers.
                                                                                              product offer and delivery, an industry-leading digital experience and
Grainger participates in a $550 billion global market for MRO. The most                       market relevant pricing.
attractive markets for Grainger are those with high GDP per capita and a
                                                                                          •   Improve financial performance through revenue growth, operating
developed infrastructure. Consequently, Grainger’s strategy is to concentrate
                                                                                              margin expansion and strong free cash flow generation.
on growth in North America, Western Europe and Japan.

STRATEGIC PRIORITIES

                                                       U.S. LARGE                 U.S. MEDIUM             SINGLE CHANNEL                CANADA                 INTERNATIONAL

Create unique value for                               Grow spot-buy volume via relevant
different customers                                                                                                                    Return to
                                                        pricing and digital capabilities                     Continue              profitable growth            Optimize
                                                                                                              to build                                         portfolio for
                                                        Grow with                  Re-engage                   online                                           profitable
                                                     large, complex               medium-sized                 model                  Diversify the              growth
                                                       customers                   customers                                            business

Create an effortless
customer experience                                                                    Improve the end-to-end experience for customers

Reduce cost
                                                                                       Improve cost structure throughout the company

Help each other grow
and succeed                                                   Instill leadership behaviors and ensure focus on team member development and engagement

Be responsible stewards
                                                                                      Maintain highest standards of ethics and integrity

PRICING ACTIONS

     In late 2016, Grainger initiated pricing changes               U.S. LARGE:     Offer comprehensive pricing programs that support large customers consolidating their
     that will continue in 2017. These actions will result                          purchases. (See more on page 5.)
     in more competitive pricing, which will allow Grainger
                                                                    U.S. MEDIUM: Offer a subscription program, which includes better pricing with a freight offer,
     to attract new customers and increase penetration with
                                                                                 to grow with these customers. (See more on page 6.)
     existing customers, resulting in improved financial
     performance over the long term. Pricing initiatives            CANADA:         Introduce more relevant pricing for products not under contract to better compete in
     in 2017 include:                                                               the current market environment. (See more on page 8.)

2 W.W. GRAINGER, INC. AND SUBSIDIARIES
B
             usinesses and institutions today are intensely focused on              The shifts in buying behavior are even more pronounced when looking at
             becoming more productive. One of the primary methods for               the unique needs of customers of different sizes.
             driving better productivity has been reducing process cost.            •   Large customers value Grainger’s multichannel model and
Increasingly, businesses have shifted from ordering through traditional                 high-touch service.
channels, such as using phones or visiting branches, to online and onsite
                                                                                    •   Medium customers want competitive pricing and a relevant product offer.
channels including Grainger.com,® electronic purchasing platforms (EDI/ePro)
and inventory management systems. Grainger has anticipated and evolved              •   Small customers tend to purchase similarly to individual consumers.
with these changes in customer buying behavior. In 2016, more than                      They value a simple, web-based solution to quickly identify and buy items
65 percent of Grainger orders originated via a digital channel (including               at a competitive price.
Grainger.com, KeepStock® and EDI/ePro) and more than 85 percent of orders           Grainger uses a combination of multichannel and single channel online
were shipped directly to the customer or were made immediately available            business models to serve customers of all sizes.
through onsite services.

SERVING CUSTOMERS OF ALL SIZES

           CUSTOMER                  SALES FORCE                              ORDER ORIGINATION                                       ORDER FULFILLMENT

                                                                                              eProcurement
                                                          Online      Phone       KeepStock     (EDI/ePro)   Branch              DC         Branch      KeepStock

   LARGE
   • Complex needs
   • Multiple sites
   • Supplier consolidation
   • Increasing onsite fulfillment
                                       OUTSIDE
   • Relationship-driven

   MEDIUM
   • Fewer sites or a single site
   • Less-complex needs
   • Focus on product categories
     that are relevant to their
                                        INSIDE
     operations

   SMALL
   • Comfort with and preference
     for online buying                   N/A
   • Behavior similar to
     individual consumers
   • Transaction-driven

                                                                                                                             W.W. GRAINGER, INC. AND SUBSIDIARIES   3
CREATING UNIQUE VALUE

     Grainger is committed to providing unique value for different customer types across its five focus areas by tailoring its services and solutions
     by customer size, end market and geography.

  U.S. LARGE                                                                                                                   U.S. MEDIUM
  2016 REVENUE $6.1 BILLION                                                                                                    2016 REVENUE $0.9 BILLION
  Grainger’s strongest competitive advantage                                                                                   Grainger is committed to improving performance
  is with large, complex customers. Large                                                                                      with medium-sized customers. The company
  customers value Grainger’s multichannel                                                                                      developed new price, coverage and service
  approach, which has proven to help them                                                                                      offerings in 2016 to more effectively compete
  reduce their labor, product and inventory costs.                                                                             for medium customers that are not part of a
                                                                                                                               negotiated contract.

                                                                 SINGLE CHANNEL
                                                                 2016 REVENUE $1 BILLION
                                                                 Grainger has leveraged its eCommerce expertise
                                                                 and infrastructure to establish a model that
                                                                 will continue to be a driver of revenue and
                                                                 profitability. The company has single channel
                                                                 businesses in North America, Europe and Asia.

  CANADA                                                                                                                       INTERNATIONAL
  2016 REVENUE $0.7 BILLION                                                                                                    2016 REVENUE $0.8 BILLION
  Grainger is dedicated to returning its business                                                                              Grainger’s international portfolio includes
  in Canada to profitable growth. Heavily affected                                                                             businesses in Europe, Asia and Latin America.
  by disproportionate exposure to the oil and gas                                                                              Grainger has narrowed its international strategy
  sector, this multichannel business has been                                                                                  to focus on the highest return opportunities by
  challenged the past two years.                                                                                               investing in markets with high GDP per capita
                                                                                                                               and a developed infrastructure.

NOTE: TOTAL COMPANY 2016 REVENUE OF $10.1 BILLION ALSO INCLUDES SPECIALTY BRANDS SUCH AS E&R INDUSTRIAL, IMPERIAL SUPPLIES AND TECHNI-TOOL.

4 W.W. GRAINGER, INC. AND SUBSIDIARIES
U.S. LARGE

 W
              ith 2016 sales of $6.1 billion, the U.S. Large business                 U.S. BUSINESS
              represents approximately 60 percent of Grainger’s total
                                                                                           MRO Spend               Contract Customer            Noncontract Customer
              revenue. It is comprised of businesses and institutions with
multiple locations that centralize, or plan to centralize, the purchase of MRO.
In addition, single-site businesses with $60,000 or more in annual MRO                      > $60K                     U.S. LARGE                     U.S. LARGE

spend potential are also categorized as large customers. This market is
approximately $75 billion and Grainger has roughly an 8 percent share.
                                                                                           $10 – $60K                  U.S. LARGE                     U.S. MEDIUM
U.S. Large customers tend to be complex and require services at their
place of business. Grainger is well-positioned to serve their needs by offering
value-added services such as KeepStock® (see below). Large customers also                    < $10K                    U.S. LARGE                     U.S. MEDIUM
rely on Grainger’s broad product offering, high product availability, dedicated
sales representatives, eProcurement, branches, contact centers and technical
support to help them achieve their goals of saving time and money.

Actions in 2016                                                                       Initiatives in 2017
Grainger has taken several steps since late 2015 to further penetrate and             Grainger is growing share with U.S. Large customers. In 2017, the
grow with large customers. The company has vertically aligned its sales               company will build upon the work completed in 2016 to improve sales
force, and now 90 percent of sales representatives are organized by industry          force execution and expand new pricing programs. The new U.S. Large
segment (commercial, government, healthcare and manufacturing). This                  customer pricing programs support customers consolidating their
realignment enables the sales force to provide more customized, segment-              purchases. These programs have improved performance across both
specific focus, allowing for more relevant conversations and deeper customer          frequent and infrequent purchases and will position the company to
relationships. Grainger has also implemented a new customer relationship              continue to gain share going forward.
management (CRM) system to help sales representatives be more effective
and productive. The CRM tool helps Grainger better understand the activities
that drive revenue and profitability with customers. Grainger also expanded
its U.S. Large business development team to include sales representatives
who specifically target companies transitioning to a more centralized MRO
purchasing approach. Finally, Grainger piloted new pricing programs to
accelerate share gains with these customers.

DIFFERENTIATED SERVICE OFFERING

                 SALES FORCE                          KEEPSTOCK                                 EDI/EPRO                                       TECHNICAL SUPPORT

   The U.S. business has an outside     Grainger’s KeepStock inventory            For large customers with sophisticated        For customers who require a higher
   sales force of more than 3,000       management program allows large           electronic purchasing platforms, the          level of technical expertise, Grainger
   professionals who help large         customers to be more productive           U.S. business utilizes eProcurement,          sellers can leverage a network of
   businesses and institutions          through solutions including onsite        a technology that allows these                trained specialists. From safety to
   save time and money. Grainger        branches, vendor-managed                  systems to communicate directly with          metalworking, these specialists
   utilizes its outside sales force     inventory, customer-managed               Grainger.com.® The direct connection          consult with customers on specific
   to grow with large customers         inventory and vending machines.           ensures that the right assortment,            needs to provide tailored solutions.
   in the United States who typically   The KeepStock program currently           workflow and processes for that
   have more complex purchasing         provides services to nearly 23,000        customer are available. eProcurement
   requirements and value the           customers. Sales of product               also has the added benefit of being
   collaborative relationship.          through the KeepStock channel             Grainger’s lowest cost order origination
                                        were more than 10 percent of              channel. In 2016, approximately
                                        U.S. revenue in 2016.                     17 percent of revenue in the U.S.
                                                                                  was generated through eProcurement.

                                                                                                                                    W.W. GRAINGER, INC. AND SUBSIDIARIES   5
U.S. MEDIUM

   T
             he U.S. Medium business contributed roughly $900 million            offer for this highly profitable customer group centered on improved sales
             in sales in 2016 and represented approximately 9 percent            coverage and tailored marketing, enhanced merchandising and more
             of company revenue. The strategy for medium-sized customers         competitive pricing. In April 2016, Grainger began hiring sales associates
is focused on noncontract customers who spend between $10,000 and                at its new inside sales facility located in San Antonio, Texas. Inside sales
$60,000 per year on MRO, representing $600 million of the U.S. Medium            associates allow Grainger to make more frequent contact with a larger
business. The remaining $300 million consists of noncontract customers           number of medium customers at a lower cost per contact. By the end of
who spend less than $10,000 on MRO per year and purchase through the             2016, Grainger had approximately 200 inside sales associates calling on
Grainger brand. U.S. Medium participates in a roughly $50 billion market         roughly 100,000 medium customers. In 2017, Grainger plans to extend
($30 billion medium and $20 billion small), and Grainger has approximately       coverage to even more customers.
2 percent share.
                                                                                 An important part of the new approach with U.S. Medium customers is
In general, U.S. Medium customers do not require the same services               providing more market-relevant pricing. With the right marketing approach,
as U.S. Large customers and instead want a purchasing experience                 sales coverage and more competitive pricing, Grainger is able to grow
that gives them peace of mind that their immediate business problems             with medium customers. In 2016, Grainger introduced a subscription
will be solved. Grainger’s broad product offer and availability serves           program, which allows medium customers who qualify to receive more
their needs.                                                                     relevant pricing on industry-specific products along with a freight offer.
                                                                                 By late 2016, Grainger had roughly 20,000 customers on the subscription
Actions in 2016 and initiatives in 2017
                                                                                 program and intends to increase that number in 2017.
Today, Grainger has a dedicated team focused on U.S. Medium customers,
a group with an operating margin at 25 to 30 percent, which is above the         The company is encouraged by the early results with medium customers and
company average. Over the past year, Grainger has built a more relevant          expects to deliver improved performance with this customer group in 2017.

BUILDING THE MEDIUM CUSTOMER OFFER AND TEAM

                                   Q4 2015 and Q1 2016                        Q2 2016 and Q3 2016                             Q4 2016 and 2017

                                       Team Launch                            Inside Sales Start-up                              Offer Rollout

                       •   Formed offer and marketing team         •   Expanded sales coverage                   •   Begin tailored marketing offers
   Activity            •   Signed lease for inside sales center    •   Began contacting ~100,000 customers       •   Cover ~10,000 additional customers
                                                                       with inside sales

   Team Members                            < 20                                      < 200                                          ~230

6 W.W. GRAINGER, INC. AND SUBSIDIARIES
SINGLE CHANNEL

  G
             rainger is leading the way with the single channel model in the                        Zoro U.S.
             MRO industry. With operations in Europe, Asia and North America,                       Zoro U.S. launched in 2011 to serve the small business market in the
             these businesses focus on small customers but are attracting                           United States. Zoro U.S. offers small customers competitive pricing,
new customers of all sizes. The single channel businesses serve customers                           simplified transactions, an easy-to-use website and convenient payment
through a streamlined search and transactional experience, and the model                            options. The combination of an expansive product offering, a simplified
has proven successful across multiple countries. In 2016, single channel                            process, reliable delivery and both digital and traditional marketing
revenue grew by 35 percent to $1 billion, and the business acquired more                            strategies has helped Zoro U.S. rapidly expand its customer base.
than 1 million new customers. In addition to strong revenue growth, operating
                                                                                                    Zoro U.S. fulfills customer orders through the same supply chain used by
margin improved by more than 100 basis points in 2016. The single channel
                                                                                                    Grainger’s core U.S. business. Access to a preexisting distribution network
businesses are forecasted to reach roughly $2 billion in revenue by 2019 and
                                                                                                    is one advantage Zoro U.S. has that MonotaRO did not have at its founding.
are expected to expand operating margin over the same time period.
                                                                                                    As a result, Zoro U.S. has experienced faster growth and profitability than
MonotaRO                                                                                            MonotaRO did at comparable stages.
Grainger’s most mature single channel business, MonotaRO in Japan, began
in 2000 and has grown from a joint venture into a publicly traded company                           Today, Zoro U.S. continues to focus on small customers and, like many
with 2016 sales of $631 million. Grainger owns 51 percent of MonotaRO,                              other single channel businesses, is growing with a diverse set of customers.
which was built to serve small and medium customers within Japan’s                                  In 2016, Zoro U.S. had sales of $403 million, up 36 percent from 2015, and
$41 billion MRO market. With an operating margin of 13 percent and a                                its operating margin improved to 7.4 percent.
reported ROIC of more than 50 percent in 2016, MonotaRO illustrates the
                                                                                                    Cromwell Direct
potential of the single channel model.
                                                                                                    Leveraging the Cromwell business (see page 9), the Cromwell Direct website
Behind MonotaRO’s success is a robust customer segmentation and data                                (www.cromwell.co.uk) was launched in March 2016 to expand the online
analytics capability that helps conceive, develop and deploy customer                               model in the United Kingdom. Since the launch, site conversion has doubled,
offers. As a result, MonotaRO has created a loyal customer following.                               and the business has acquired tens of thousands of new customers. Cromwell
In 2016, MonotaRO added 450,000 new customers, fueling 21 percent                                   Direct showed promising sales results in its first partial year of operations,
revenue growth in local currency over the prior year.                                               and the momentum is expected to continue in 2017.

MonotaRO’s broad product line, including an assortment of approximately                             Zoro Europe
10 million SKUs with over 300,000 products stocked, an easy-to-use                                  Located in Düsseldorf, Germany, Zoro Europe was launched in 2014 as a
website and competitive pricing, makes the company’s offering attractive                            way to expand the single channel model in Europe. Today, the business
to small and medium businesses. To accommodate its strong growth,                                   offers customers an assortment of 400,000 products available through
MonotaRO will open a 590,000 square-foot DC in the Tokyo area in 2017.                              www.zoro.de.

SINGLE CHANNEL BUSINESS REVENUE
(Dollars in millions)

           MonotaRO          Zoro U.S.          Zoro Europe       Cromwell Direct

2,500

2,000

1,500

1,000

500

 0

        2009   2010   2011     2012      2013    2014     2015   2016   2017E       2018E   2019E

                                                                                                                                            W.W. GRAINGER, INC. AND SUBSIDIARIES   7
CANADA

  A
            cklands–Grainger Inc., is Grainger’s largest business outside                  Key improvements in 2017 include:
            the United States with revenues of more than $700 million.                     A new eCommerce experience Launched in the first quarter of 2017, the
            The original business was founded by Dudley Ackland more                       new acklandsgrainger.com website makes it easier for customers to transact
than 125 years ago and was acquired by Grainger in 1996.                                   business online. This new platform leverages Grainger’s eCommerce strength,
                                                                                           backed by the common North American infrastructure and technology.
Acklands–Grainger is at a transformational point in its history. As
Canada’s leading broad line distributor of industrial and safety supplies,                 Market-relevant pricing In 2017, Acklands–Grainger introduced more
Acklands–Grainger had reached the limit on its legacy systems and two-tier                 relevant pricing for products not under contract to better compete in the
distribution model. In addition, its decentralized operating model resulted in             current market environment.
inefficiencies and inconsistencies in customer service across the business.                A customer-centric stocked product assortment Historically,
Lastly, with a large portion of its business heavily skewed to oil and gas                 Acklands–Grainger made assortment decisions at the branch level. With
customers in western Canada, low energy and commodity prices in 2015                       the company’s new ERP system, these decisions are now centralized and
and 2016 had negatively affected business results.                                         scalable. The result is an improved stocked assortment resulting in a better
                                                                                           customer experience.
In 2016, the company began laying a strong, stable foundation to
position itself for long-term sustainable growth and profitability by                      Diversification While oil and gas customers remain a long-term strategic
addressing the following areas:                                                            priority, the company is focused on further diversifying its business and
                                                                                           growing in eastern Canada. In 2016, the company launched a pilot with
Strategy Developed and implemented a clear, customer-focused strategy
                                                                                           a tailored product offer and a sales force trained to serve a specific type
and reorganized business to improve execution and reduce cost.
                                                                                           of customer. The results were promising. Leveraging the experience of
Cost structure Centralized functions, closed branches and restructured                     Grainger’s U.S. business in product assortment, offer development and
the workforce.                                                                             customer service, Acklands–Grainger plans to further diversify its business
Systems Implemented and stabilized an enterprise resource planning                         by customer type and geography in 2017.
(ERP) system that replaced dozens of disparate legacy systems with a                       Going forward, it is expected that Acklands–Grainger will maintain its historic
common North American platform.                                                            strength with large natural resources customers in western Canada and
Distribution Launched direct-to-customer (DTC) shipping––moving                            establish lasting relationships with different types of customers, particularly
from 8 percent DTC to more than 50 percent in less than one year.                          in the areas of significant opportunity in Ontario and the eastern provinces.

REPOSITIONING THE BUSINESS FOR SUSTAINABLE GROWTH

                 2014--15–INVESTMENT                                           2016–STABILIZATION                                            2017–GROWTH
           • ERP system                                                    • DTC fulfillment path                                   •   Improved stocked assortment
           • Toronto DC                                                    • ERP transition                                         •   Diversified customer base
           • Warehouse management system                                   • Business restructuring                                 •   New eCommerce platform

                                                                   WILL POSITION ACKLANDS–GRAINGER TO:

     •   Leverage Grainger U.S. scale and expertise   •   Deliver a business less susceptible to market volatility   •   Grow share in high-opportunity areas of Canada

8 W.W. GRAINGER, INC. AND SUBSIDIARIES
INTERNATIONAL
G
rainger’s operations outside of
North America include businesses
in Europe, Asia and Latin America.
Revenue for Grainger’s international businesses
totaled $844 million in 2016. In 2017, Grainger is
focused on optimizing its international portfolio
to improve performance and is narrowing its
exposure to the highest return opportunities,
including markets with high GDP per capita
and a developed infrastructure. The primary
businesses in the portfolio include:
Cromwell
Cromwell, Grainger’s multichannel business
in the United Kingdom, offers a broad product Fabory ERP system, which provides better visibility into
line, a stable supply chain and a robust private With operations in nine countries in Europe, inventory management and greater operating
label assortment and has a solid base of more 70 branches and more than 200,000 fastener efficiency, the business grew 16 percent in local
than 70,000 industrial and manufacturing SKUs and other MRO products, Netherlands-based currency in 2016. In 2017, the company expects
customers worldwide. Cromwell was acquired Fabory is known as Europe’s specialist in quality to drive continued growth and market share
by Grainger in 2015 and is headquartered fasteners and fastener-related products and gains in Mexico through product line expansions,
in Leicester, England. In 2016 Cromwell services. Fabory has been restructured to position customer penetration and acquisition initiatives,
represented a little under half of the the business to better respond to changing improvements to eCommerce and investments in
international portfolio’s revenue. customer buying behaviors and improve its cost the KeepStock® inventory management system.
structure; however, sales declined for Fabory in
Through a DC reconfiguration, Cromwell China
2016 and the business reported an operating loss.
will double its capacity to grow in 2017. The Grainger has maintained a presence in China,
Priorities for 2017 are focused on returning the
reconfiguration will improve productivity levels the world’s second-largest economy, since
business to profitable growth by enhancing its
and the overall customer experience by updating 2006. This business serves the needs of both
eCommerce offer.
the way product is stored to improve order multinational companies and local businesses.
accuracy and increase the capacity for stocked Mexico In 2016, the business grew and was profitable
items. The investment will enhance Cromwell’s Grainger Mexico, a business with 18 branches, in local currency. Grainger is working to
ability to ship same-day and DTC, supporting 2 DCs and more than 300 salespeople, serves accelerate sales growth in China in 2017
traditional channels and Cromwell Direct, which the needs of local customers and Grainger’s through its focus on inside sales, product line
launched in 2016. Cromwell will also offer more accounts that have locations across North expansion and eCommerce to best serve the
tailored online pricing in 2017. America. Leveraging its first full year on an needs of customers.
LATIN AMERICA EXPORT
Grainger has a presence in five other Latin American countries: Colombia, Through its Export business, Grainger also offers products to customers in more than
Dominican Republic, Panama, Peru and Puerto Rico to serve the needs of 150 different countries. Export helps customers across the globe procure products
local customers. quickly and at a competitive price.
W.W. GRAINGER, INC. AND SUBSIDIARIES 9CREATING AN EFFORTLESS CUSTOMER EXPERIENCE (U.S. BUSINESS)
P
roviding great customer service is the foundation of Grainger’s standing as a distribution leader and a key lever in accelerating profitable
growth. As order origination and fulfillment trends shift, the company adapts its platform to provide a better end-to-end experience giving
Grainger an advantage over competitors.
ORDER ORIGINATION ORDER FULFILLMENT
Line Mix Line Growth (CAGR) Line Mix Line Growth (CAGR)
2016 2011–2016 2016 2011–2016
Online 29% 8% Ship DTC 66% 2%
Phone 22% -13% KeepStock 20% 24%
KeepStock® 20% 24% Pickup at Branch 14% -13%
EDI/ePRO 18% 16%
Branch 11% -7%
Phone Digital Channels: Online, EDI/ePro and KeepStock
Over the past five years, order origination has shifted from branches and Through Grainger.com, eProcurement connections and KeepStock,
phones to digital channels such as Grainger.com,® eProcurement (EDI/ePro) Grainger continues to develop features that promote a personalized,
and KeepStock. While phones are the company’s second-largest origination relevant, effortless experience for each customer. In 2016, more than
channel, customers continue to shift to digital channels. 65 percent of orders originated through a digital channel and approximately
57 percent of revenue in the United States came from such channels.
In response to this migration, Grainger has begun the process of
consolidating its 150 contact centers in the United States into three Grainger.com had more than 38 million visitors in 2016, an increase of
national contact centers in Janesville, Wisc.; Waterloo, Iowa; and Phoenix, 15 percent from 2015 and was ranked the eleventh largest eCommerce site
Ariz. This strategy will lead to more effective and cost-efficient customer in North America by Internet Retailer in 2016. To further increase digital
service. In addition, this consolidation will create the ability to deploy traffic in the United States, Grainger is focused on its customers’ journey
service changes faster and offer better training and more robust career from initial consideration to evaluation to purchase. The company created
paths for contact center team members. metrics to track each part of the journey and is leveraging a continuous
improvement approach to drive progress. One key focus area is the “search-
and-select” process. With approximately 1.9 million SKUs available online in
U.S. CONTACT CENTER NETWORK the United States, finding the right product quickly is critical for a successful
Current Future experience. In 2016 Grainger improved search terms and presentation for
products representing more than 30 percent of Grainger.com revenue and
150+ 3 will continue this work in 2017.
For large customers with complex needs, the KeepStock inventory
management system and eProcurement drive significant value. Together,
these two channels represent just under 40 percent of all U.S. orders.
GRAINGER GLOBAL SOURCING
Grainger’s private label products offer customers high-quality options at The engine behind much of the company’s private label offering is Grainger Global
generally lower price points, while providing Grainger with stronger gross profit Sourcing (GGS), which works with more than 700 suppliers in 33 countries to provide
margins. In 2016, private label products –– which include exclusive brands such as Grainger’s businesses with access to approximately 65,000 high-quality products.
Dayton,® Westward,® LumaPro® and Tough Guy® –– represented 17 percent of total In 2016, sales of product procured by the GGS operation exceeded $1 billion and
company sales. were just under 11 percent of total company sales.
10 W.W. GRAINGER, INC. AND SUBSIDIARIESU.S. BRANCH NETWORK CUSTOMER
NORTH AMERICAN DISTRIBUTION CENTERS1
Four distinct customer types visit Grainger branches each day:
ON-THE-GO EMERGENCIES
Broad geographic coverage makes Local inventory allows Grainger
it easier for on-the-go customers to provide same-day service for
to drop by any branch and get what customers’ emergency needs.
they need, when and where they
need it.
NEAR A BRANCH PRODUCT EXPERTISE
500,000 products Many customers prefer pickup Branch staff members are
~ 300,000 products at their nearby branch on the well-versed in Grainger products
~150,000 products same day versus having the and can provide technical or
1
product shipped. “search-and-select” support.
Excludes the DCs of
specialty businesses.
Supply Chain U.S. Branch Network
In today’s connected world, the need for a well-developed logistics Just as Grainger has seen dramatic shifts in how customers place orders,
infrastructure in mature markets like the United States is more important order fulfillment has experienced a significant transition as well. In 2016,
than ever. Over the past eight years, Grainger has invested heavily in more than 85 percent of Grainger’s U.S. orders were delivered directly to
its DC network to ensure optimum capacity, increased automation customers, which means less activity in the branches. Given this trend,
and standardization in response to the need for on-demand delivery Grainger conducted a market-by-market study to determine the right branch
of products, information and services (see order fulfillment chart). footprint for each local market and right-sized the network for the expected
Grainger has invested in new and improved DCs in California, Illinois level of demand. Grainger restructured its stand-alone branch network in
and New Jersey, and significantly expanded its DC in South Carolina. the United States from 411 branches in 2006 to 254 branches in 2016, a
In 2017, Grainger announced it had purchased land for a new DC in 40 percent reduction. At the end of 2016, the U.S. branch network was
Louisville, Ky. Construction of the facility is projected to be complete in profitably growing revenue. Grainger will continue to evaluate its branch
late 2020. network going forward to ensure it effectively services its customer base.
This robust and evolving global DC network allows Grainger to manage
more than 700,000 stocked SKUs in the United States and also ship U.S. BRANCH NETWORK2
411 419 422 406 385 355 353 353 345 306 254
most orders complete with next-day delivery. To increase the speed
at which products move through the supply chain, Grainger’s more
than 3,000 key product suppliers in the United States are measured
on consistent and reliable service. Availability, the percent of time
a product is in stock when and where the customer needs it, has
remained at very high levels even as Grainger increased its product
2006 2007 2008 2009 2010 2011 2012 2013 2014 2015 2016
line seven-fold, creating a strong service experience enabled by the
2
Reflects core U.S. business excluding acquisitions and specialty businesses
company’s supply chain.
PRODUCT PROCUREMENT OPTIMIZATION (PPO)
In 2015, Grainger began an initiative called Product Procurement Optimization (PPO). review the product assortment, realize cost savings, implement decisions faster
Grainger’s engineering and sourcing teams break down products to their individual than a traditional line review, have more productive supplier negotiations and
components, leading to a better understanding of what the manufactured product better manage costs of goods sold. The process also helps ensure the right
should cost. By deploying dedicated teams, the project has enabled Grainger to supplier mix to serve customers.
W.W. GRAINGER, INC. AND SUBSIDIARIES 11CREATING SHAREHOLDER VALUE
E
xcellent customer service, a focus that expansion. Historically, gross margin Another 78 stand-alone branches were closed
on market share gains, margin has been a greater contributor to operating in 2016. In late 2016, the company announced
expansion and a strong balance margin growth. But in a challenging industrial an 18-month plan to consolidate its contact
sheet all contribute to Grainger’s success. environment intensified by a lack of inflation and center network (see page 9), which will result in
Through the ups and downs of economic cycles, greater price transparency, Grainger’s emphasis additional cost savings going forward. Continuous
Grainger has generated strong cash flow and has centered on growth while reducing its cost improvement in DCs and the shift to eCommerce
delivered solid long-term returns to shareholders. structure. Over the next five years, Grainger also contribute to better expense leverage.
targets annual operating margin expansion, At the same time, the company is focused on
Margin
driven by mid-single-digit organic sales growth generating better returns for its investments,
Grainger manages its business for the long term.
and improved expense productivity. including supply chain infrastructure, IT systems
The company’s goal is to accelerate growth and
and sales force productivity in the United States
expand operating margin over the next five years. The company began taking action to improve its
as well as improving the profitability of smaller
However, the current economic environment has cost structure in 2015 by closing 81 stand-alone
businesses in the portfolio.
contributed to a change in the composition of branches and restructuring management layers.
SALES OPERATING MARGIN FREE CASH FLOW1
Dollars in billions Percent Millions
9.0 9.4 10.0 10.0 10.1 12.6 13.7 13.5 13.5* 12.5* 575 741 599 631 774
13.0
11.0
2012 2013 2014 2015 2016 2012 2013 2014 2015 2016 2012 2013 2014 2015 2016
EARNINGS PER SHARE – DILUTED ROIC2 CASH FLOW FROM OPERATIONS
Dollars Percent Dollars in millions
9.52 11.13 11.45 11.94* 11.58* 29.1 31.8 31.2 29.5* 25.8* 816 986 960 990 1,000
11.58
28.5
9.87
22.8
2012 2013 2014 2015 2016 2012 2013 2014 2015 2016 2012 2013 2014 2015 2016
* Lower number represents reported figure; upper number 1 See definition on page 16.
represents adjusted figure. For a reconciliation of non-GAAP 2 See definition on page 21.
measures see “Financial Definitions and Reconciliations”
on page 16.
12 W.W. GRAINGER, INC. AND SUBSIDIARIESCash flow Capital structure the debt issuance program. The $400 million
Grainger’s business model generates strong Grainger’s strong free cash flow generation allows in new long-term debt will be split evenly
cash flow through economic cycles. In 2016, it to maintain a liquidity position that provides between short-term debt reduction and share
the company reported cash flow from operations flexibility in funding working capital needs and repurchases. The remainder of the share
of $1 billion and free cash flow of $774 million. long-term cash requirements. In 2015, Grainger repurchases will be funded by cash from
Grainger began emphasizing the free cash flow announced plans to issue $1.8 billion in long-term operations. Grainger expects to repurchase
metric (see page 16) in late 2016 to provide a debt over the course of three years. Along with $600 million in stock in 2017, a reduction from
clearer picture of its cash generation capabilities $1.2 billion of internally generated cash from the $800 million announced in 2015.
given the expected decline in capital expenditures operations, the three-year plan called for $3 billion
and the anticipated increase in depreciation and in share repurchases. As a result, average share
amortization. Grainger’s priorities for uses of count decreased from 67.4 million at the end
cash are investment in the business, paying of 2014 to 58.8 million in 2016. In 2017, the
down debt, dividends and share repurchases. company plans to complete the third year of
CAPITAL DEPLOYMENT SHARES OUTSTANDING (at year end) CASH GENERATION/DEPLOYMENT (2012–2016)
Business investment is expected to subside Millions of shares Dollars in millions
in the coming years due to lower capital 69.5 68.9 67.4 62.0 58.8 Cash from Operations Uses of Cash
requirements. In prior years, the company
made significant investments to upgrade its 8,000
distribution center network, technology systems
and eCommerce platform to support the shift to 7,000
online purchasing. As less cash is required for
capital expenditures, more cash is freed up for
6,000
paying down debt, while funding dividends and
share repurchases. 2012 2013 2014 2015 2016
5,000 68 percent
In 2016, Grainger returned $1.1 billion in cash returned to
shareholders
to shareholders in the form of dividends and
share repurchases. The company repurchased DIVIDENDS PAID 4,000
approximately 3.6 million shares of stock for Dollars per share
$790 million and paid $303 million in dividends. 3.06 3.59 4.17 4.59 4.83
3,000
Grainger is proud of its 45-year track record of
increasing its dividend. The company is among
2,000
only 3 percent of S&P 500 companies that have
increased their dividend each year for more than
four decades. 1,000
2012 2013 2014 2015 2016
Dividends Acquisitions
Share Repurchases Capital Expenditures
W.W. GRAINGER, INC. AND SUBSIDIARIES 13OPERATING RESPONSIBLY
G
rainger’s Corporate Social Responsibility (CSR) program is a natural extension of the company’s core operating principles. At the heart of those
principles lies a commitment to customers, communities and team members. Grainger built its CSR strategy around four pillars that define its
values as a corporate citizen:
SUSTAINING OUR ENVIRONMENT
Grainger recognizes that environmental stewardship is a significant Recycling rates have improved
for 4 consecutive years in With more than 70,000 green
global issue, and the company is taking steps to more effectively
Grainger’s DCs. In 2016, In 2016, Grainger completed its inaugural product SKUs, Grainger’s 2016
manage its energy use and greenhouse gas (GHG) emissions.
85 percent CDP supply chain survey. CDP supply sales of green products exceeded
Grainger has participated in the CDP* since 2009, and in 2012 the of DC waste was recycled. chain partners reported a combined $550 million.
company became the first industrial distributor to publicly disclose 76 million metric tons of CO2 reduction
its carbon footprint. In 2016, Grainger earned a CDP score of “A-” resulting in more than $700 million
for the second consecutive year. in annual emissions reduction savings.
SERVING OUR COMMUNITIES
In 2016, more than 162 scholarships totaling
Grainger continues to positively influence the places its team members live
$2 million in contributions $324,000 were awarded to
and work. The company is proud to participate in the Grainger Community were awarded through the 86 community colleges in 2016
Grant Program (GCGP), sponsored by The Grainger Foundation, an Grainger Matching as part of the Grainger Tools for
independent, private foundation established in 1949 by William W. Grainger, Charitable Gifts Program. In 2016, Grainger committed to a Tomorrow® Scholarship Program
the company’s founder. In 2016, The Grainger Foundation made grants $1 million level of support for the in support of technical education.
American Red Cross during its
through the GCGP totaling $6.6 million, supporting more than 1,000 nonprofit
2017 fiscal year through its
organizations. In 2017, Grainger will look to share best practices and connect Annual Disaster Giving Program.
its partners with each other to increase effectiveness.
VALUING OUR PEOPLE
Grainger had 307 branches
Grainger employees completed with no Occupational Safety
Grainger succeeds when its team members thrive. In 2017, the a combined 22,000 hours of and Health Administration (OSHA)
company will continue to work to ensure global team members safety training in 2016. recordable event in 2016.
have the knowledge, training and support to perform their roles In 2016, Grainger had
safely and confidently. 2 locations with more than
1,000,000 hours worked
without a lost time accident (LTA).
OPERATING RESPONSIBLY
100 percent of new and
170 Certified Supplier Diversity businesses existing team members completed
offered more than 33,000 items to business ethics training in 2016.
Professionalism and integrity are the foundation of Grainger’s Grainger’s U.S. customers in 2016.
culture. In 2017, the company will continue to exhibit the highest 100 percent of U.S. and Grainger
standards of corporate governance and business ethics. Choice Suppliers and their subsuppliers
are expected to comply with the
company’s supplier code of ethics
as a condition of doing business.
* The CDP (formerly known as Carbon Disclosure Project) climate performance scoring methodology awards points for companies that highlight they are undertaking, or have undertaken,
“positive” climate change actions.
Within each of these four pillars, Grainger addresses issues that are material to the business and its stakeholders and most meaningful to the
company’s role in the industry, the marketplace and the environment. Please visit www.GraingerCSR.com for more information on Grainger’s
approach to Corporate Social Responsibility. While Grainger’s CSR commitments are global, the CSR report is primarily focused on the company’s
operations in the United States. These operations currently represent the majority of Grainger’s business, based on percentage of revenue, scope of
operations and number of employees. Where applicable, the specific geography is noted in the relevant footnotes to that data.
14 W.W. GRAINGER, INC. AND SUBSIDIARIESHELPING EACH OTHER GROW AND SUCCEED
In 2017, Grainger was again
named to Fortune’s annual list of the
World’s Most Admired Companies.
Among industry competitors in the
Wholesalers: Diversified category,
Grainger ranks No. 1 for the fourth
consecutive year.
“We attract, develop and retain top talent in “Our team members bring different skills,
every market we serve and leverage their perspectives and experiences to the table
diverse perspectives to grow the business to help customers keep their facilities
aggressively and profitably. When every team running and the people in them safe.
member knows that his or her voice is being In turn, Grainger is committed to fostering
heard and accomplishments are recognized, a workplace where dedicated, talented
we unlock the team’s full potential and the people can thrive.”
potential of the business.”
D.G. Macpherson, Chief Executive Officer
Joseph C. High, Senior Vice President and
Chief People Officer
F
or the past 90 years, Grainger has team members to engage in learning and inclusive collection of team members who
recognized that building a team development to serve customers in ways most voluntarily work together to advance the
with the right skills and a deep effective for them. company’s position in the global marketplace
commitment to service is foundational for by leveraging their unique perspectives and
Reward and recognize performance and
success. That is why Grainger has made it a skills. Grainger’s BRGs cover the following
results: Grainger understands that offering
priority to create a culture where the company employee populations:
competitive and comprehensive benefits is
and its team members can grow and thrive.
critical to attracting and retaining talented team • Administrative Business Partners
The company’s focus is to:
members. Key offerings of the company’s • African-Americans
Select and develop people who anticipate benefits package include competitive health • Asian Pacific Islanders
and create a great customer experience: benefits, a premier profit-sharing plan and • Equality Alliance
Grainger recruits talent from diverse educational assistance, a program providing • Generational
organizations and the best colleges and tuition reimbursement for courses or degree • Latino
universities. At the same time, Grainger programs that are job-related. • Veterans and Military Supporters
recognizes that sometimes the best • Women
Creating a great team member experience
candidates can be internal.
and an inclusive workplace: Grainger is Grainger’s team members are passionate about
Equip and energize team members to excel committed to cultivating a diverse workforce helping businesses and institutions keep their
amid change: Grainger will keep evolving as and an inclusive workplace where talented and facilities running and people safe. In turn Grainger
customer needs and purchasing preferences engaged people can bring their whole selves offers the stability of an established industry
change. To be successful, the company must to work. Grainger is committed to being a leader combined with interesting opportunities to
have team members who can adapt quickly. company where all individuals are respected, learn, grow and make a difference at customer
Grainger is committed to team members’ treated fairly, recognized for accomplishments, sites and in communities. Grainger’s team
professional and personal growth. From its provided work-life balance and given the members have helped it build a rich heritage of
onboarding and orientation programs to on-the- opportunity to excel. Grainger leverages its service for the past nine decades. Their
job development, formal classes and mentoring, people leaders and Business Resource Groups commitment will enable Grainger to deliver an
the company provides many opportunities for (BRGs) to help achieve this goal. BRGs are an effortless customer experience for years to come.
W.W. GRAINGER, INC. AND SUBSIDIARIES 15FINANCIAL DEFINITIONS AND RECONCILIATIONS
T
he company supplements GAAP financial information with Free cash flow
certain non-GAAP measures, including adjusted operating The company defines free cash flow as net cash flow provided by operating
earnings, adjusted net earnings, adjusted diluted earnings activities less purchase of property, plant and equipment plus proceeds
per share and free cash flow. from the sale of assets. The company believes free cash flow is meaningful
to investors as an indication of the company’s strength and ability to
Adjusted measures
generate cash.
Adjusted measures exclude items noted below that may not be indicative of
core operating results and provide a better baseline for analyzing trends in Twelve Months Ended
December 31,
the underlying business.
2016 2015
Twelve Months Ended Net cash provided by operating activities $1,002,976 $989,904
December 31,
Less:
2016 2015
Additions to property, building and equipment 284,249 373,868
Operating earnings reported $1,119,497 $1,300,320 Add:
Restructuring 39,613 45,351 Proceeds from the sale of assets 55,023 14,857
Other:
Free cash flow $÷«773,750 $630,893
Goodwill and intangible impairment 52,318 —
Unclaimed property contingency 36,375 —
Inventory reserve adjustment 9,847 —
GSA contingency 9,180 —
Subtotal 147,333 45,351
Operating earnings adjusted $1,266,830 $1,345,671
Twelve Months Ended
December 31,
2016 2015
Net earnings reported $605,928 $786,996
Restructuring 26,501 30,111
Other:
Goodwill and intangible impairment 52,318 —
Unclaimed property contingency 22,781 —
Inventory reserve adjustment 7,278 —
GSA contingency 5,750 —
Discrete tax items (9,378) (5,984)
Subtotal 105,250 24,127
Net earnings adjusted $711,178 $793,123
Twelve Months Ended
December 31,
2016 2015
Diluted earnings per share reported $÷9.87 $11.58
Adjustments, pretax 2.41 0.69
Tax effect (1) (0.55) (0.24)
Discrete tax items (0.15) (0.09)
Total, net of tax 1.71 0.36
Diluted earnings per share adjusted $11.58 $11.94
(1) The tax impact of adjustments is calculated based on the income tax rate in
each applicable jurisdiction.
16 W.W. GRAINGER, INC. AND SUBSIDIARIESCONSOLIDATED STATEMENTS OF EARNINGS
For the Years Ended December 31,
(In thousands of dollars, except for share and per share amounts) 2016 2015 2014
Net sales $10,137,204 $9,973,384 $9,964,953
Cost of merchandise sold 6,022,647 5,741,956 5,650,711
Gross profit 4,114,557 4,231,428 4,314,242
Warehousing, marketing and administrative expenses 2,995,060 2,931,108 2,967,125
Operating earnings 1,119,497 1,300,320 1,347,117
Other income and (expense):
Interest income 717 1,166 2,068
Interest expense (66,332) (33,571) (10,093)
Loss from equity method investment (31,193) (11,740) —
Other non-operating income 1,300 1,102 483
Other non-operating expense (4,931) (6,572) (5,189)
Total other expense (100,439) (49,615) (12,731)
Earnings before income taxes 1,019,058 1,250,705 1,334,386
Income taxes 386,220 465,531 522,090
Net earnings 632,838 785,174 812,296
Less: Net earnings attributable to noncontrolling interest 26,910 16,178 10,567
Net earnings attributable to W.W. Grainger, Inc. $÷÷«605,928 $÷«768,996 $÷«801,729
Earnings per share:
Basic $÷÷÷÷÷«9.94 $÷÷÷«11.69 $÷÷÷«11.59
Diluted $÷÷÷÷÷«9.87 $÷÷÷«11.58 $÷÷÷«11.45
Weighted average number of shares outstanding:
Basic 60,430,892 65,156,864 68,334,322
Diluted 60,839,930 65,765,121 69,205,744
Diluted Earnings Per Share:
Net earnings as reported $÷÷«605,928 $÷«768,996 $÷«801,729
Earnings allocated to participating securities (5,406) (7,515) (9,444)
Net earnings available to common shareholders $«÷««600,522 $«««761,481 $«««792,285
Weighted average shares adjusted for dilutive securities 60,839,930 65,765,121 69,205,744
Diluted earnings per share $÷÷÷÷ ÷9.87 $÷÷ ÷11.58 $÷÷÷«11.45
Segment Information
(In thousands of dollars) 2016 2015 2014
Sales
United States $7,870,105 $7,963,416 $7,926,075
Canada 733,829 890,530 1,075,754
Other Businesses 1,884,963 1,405,750 1,182,186
Intersegment sales (351,693) (286,312) (219,062)
Net sales to external customers $10,137,204 $9,973,384 $9,964,953
Operating earnings
United States $1,274,851 $1,371,626 $1,444,288
Canada (65,362) 27,368 87,583
Other Businesses 40,684 48,051 (37,806)
Unallocated expenses (130,676) (146,725) (146,948)
Operating earnings $1,119,497 $1,300,320 $1,347,117
W.W. GRAINGER, INC. AND SUBSIDIARIES 17You can also read