Journal of Transport & Health - University of ...
←
→
Page content transcription
If your browser does not render page correctly, please read the page content below
Journal of Transport & Health 6 (2017) 187–200

                                                            Contents lists available at ScienceDirect

                                                    Journal of Transport & Health
                                                  journal homepage: www.elsevier.com/locate/jth

The carbon savings and health co-benefits from the introduction of                                                                             MARK
mass rapid transit system in Greater Kuala Lumpur, Malaysia
                                  ⁎
Soo Chen Kwana,b, , Marko Tainioc,d, James Woodcockc, Rosnah Sutanb,
Jamal Hisham Hashima
a
  United Nations University-International Institute for Global Health, Kuala Lumpur, Malaysia
b
  Department of Community Health, National University of Malaysia, Kuala Lumpur, Malaysia
c
  MRC Epidemiology Unit, University of Cambridge, Cambridge, United Kingdom
d
  The Systems Research Institute (SRI), Polish Academy of Sciences, Warsaw, Poland

AR TI CLE I NF O                                           AB S T R A CT

Keywords:                                                  Introduction: Transportation is a convenient way to incorporate an active lifestyle, in addition to
Public transport                                           reducing environmental pollution. This study estimates the changes in carbon dioxide (CO2)
Mass rapid transit                                         emissions and the health co-benefits from two new mass rapid transit (MRT) lines in Greater
Carbon emissions                                           Kuala Lumpur, Malaysia.
Health co-benefits
                                                           Method: Changes in CO2 and air pollutant emissions were estimated from motor vehicle activity
                                                           based on the travel information collected from a survey. Health effects were estimated using a
                                                           comparative health risk assessment method. Exposure to air pollution was modelled based on the
                                                           reduction in ambient PM2.5 concentration. Traffic injury was estimated using a constant risk per
                                                           distance for each transport mode. Physical activity was modelled based on the amount of walking
                                                           to or from the stations. Health outcomes were calculated as changes in premature deaths and
                                                           disability adjusted life years (DALYs).
                                                           Results: The two MRT lines would reduce 337,800 t of CO2 equivalent per year from private
                                                           transportation. However, the use of motor vehicle in the station access-egress would offset 28%
                                                           of the total carbon savings. The ambient PM2.5 concentration would be reduced by 0.12 µg/m3,
                                                           preventing 5 deaths and 104 DALYs per year. Reduced traffic injuries would prevent 88 deaths
                                                           and 6300 DALYs per year, while increased walking would prevent 90 deaths and 3200 DALYs per
                                                           year. Sensitivity analysis revealed that travel distance, modal shift and station access-egress
                                                           distance could considerably change CO2 emission reduction, while relative risks of physical ac-
                                                           tivity could significantly affect attributable burden of diseases.
                                                           Conclusion: The two MRT lines would reduce 6% of CO2 equivalent emission from private motor
                                                           vehicles in Greater Kuala Lumpur and bring important health co-benefits to the population.
                                                           However, strategic planning around the MRT stations for access and egress is necessary to
                                                           achieve maximal benefits.

1. Introduction

    Cities are major contributors to global carbon emissions (UN-Habitat, 2011) but are also where the most effective carbon miti-
gation could be made (Dodman, 2009). As population increases in cities, transport carbon emission will be the fastest growing among

    ⁎
        Corresponding author at: United Nations University-International Institute for Global Health, Kuala Lumpur, Malaysia.
        E-mail address: sc.kwan@yahoo.com (S.C. Kwan).

http://dx.doi.org/10.1016/j.jth.2017.06.006
Received 5 January 2017; Received in revised form 9 June 2017; Accepted 12 June 2017
Available online 28 June 2017
2214-1405/ © 2017 The Authors. Published by Elsevier Ltd. This is an open access article under the CC BY license (http://creativecommons.org/licenses/BY/4.0/).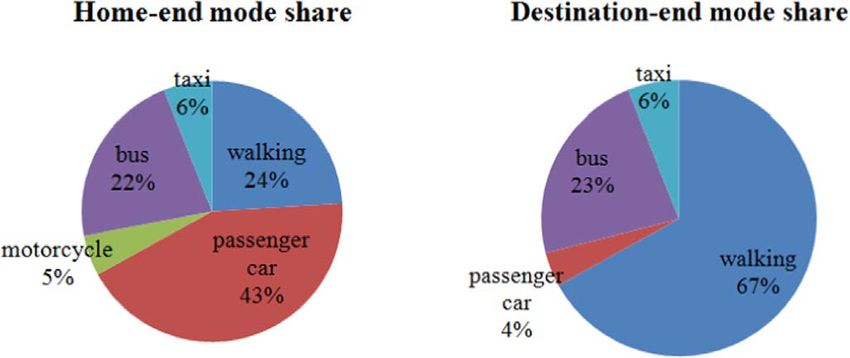
S.C. Kwan et al. Journal of Transport & Health 6 (2017) 187–200
the energy end-use sectors (Sims et al., 2014). The limited efficient transport choices in developing countries further spurred the rate
of emissions from motorization. Although cleaner fuels could help reduce transport emissions, increasing number of motor vehicles
has caused emissions to continue to rise (Schipper et al., 2009). Therefore, compared to road expansions which encourage motor-
ization, provision of public transport and other low carbon transport infrastructure could be the more effective way to reduce traffic
and prevent future emission lock-in.
Transit infrastructure can reduce carbon emissions by modal shift, congestion relief and land use multiplier (APTA, 2017). The
amount of reduction from modal shift depends on the transport activities (vehicle fleet and distance travelled), fuel efficiency (petrol,
diesel) and the local driving cycle (acceleration, starting, stopping) (Schipper et al., 2009; Tzirakis et al., 2006). Congestion relief
which entails increased speed reduces emissions as fuel efficiency improves. The land use multiplier is characterized by the devel-
opment of a denser land use pattern and more opportunities to live close to transit stops which then shortens trip distance and reduces
the use of private automobiles (APTA, 2017). On the other hand, the construction, maintenance and operation of transit system
utilize energy which can produce an amount of emissions depending on the source of power generation. The construction emissions
from carbon intensive process such as tunnelling would require a lifetime operation of transit infrastructure to compensate (ADB,
2017).
Previous transport health impact assessment studies have shown substantive public health co-benefits from the adoption of
alternative transport systems (Mueller et al., 2015; Shaw et al., 2014). Most health impact modelling and co-benefit studies have
emphasized active transport, especially cycling, with less focus on public transport policies (Rojas Rueda et al., 2013; Xia et al., 2015;
Woodcock et al., 2014). This could partly be because most studies were done in developed nations where the public transport
network is more established. In developing countries where vast urban land and transport planning is still underway, providing
evidence on public transport infrastructure may be more important so as to justify the financial allocations and commitments from
local governments.
The expansion of Greater Kuala Lumpur (GKL), also known as Klang Valley, in Malaysia has created a large conurbation area. The
GKL covers 2793 km2 with 6.3 million population in 2010, and is projected to reach 10 million population by 2020 (PEMANDU,
2012). It consists of ten local authorities which include part of the neighboring Selangor state. Its national economic importance is
clear, contributing 37% of the Gross Domestic Product of Malaysia (SPAD, 2013). The urban expansion has propelled the use of motor
vehicles to travel into the city. In view of this, the Kuala Lumpur City Hall is striving to increase public transport modal share from
21% to 40% by 2030 (SPAD, 2014; Eleventh Malaysia Plan, 2015). In the Greater Kuala Lumpur Land Public Transport Master Plan
(SPAD, 2013), urban rail will be the future spine of public transport network in the city. Currently, the GKL is served by two light rail
transit (LRT) lines and a monorail for the urban areas, and Keretapi Tanah Melayu (KTM) commuter train and airport express for the
suburban areas. The metro mass rapid transit (MRT) infrastructure is one of the largest transport infrastructure projects in Malaysia.
Three MRT lines costing RM80 billion (USD 20 billion) have been proposed for the integrated urban rail network. The first MRT line
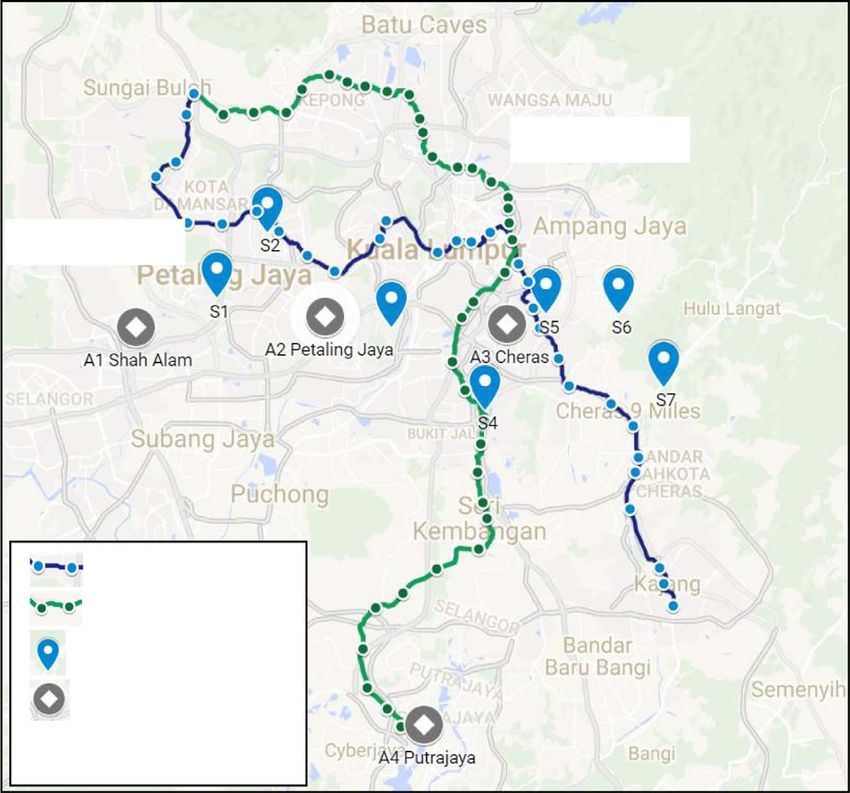
is 51 km and runs from the northwest to the southeast corridor (Sungai Buloh-Kajang (SBK)) of GKL with 31 stations (Fig. 1.). The
second MRT line will be 52 km and runs from the northeast to the southwest corridor (Sungai Buloh-Serdang-Putrajaya (SSP)) with
37 stations. The first line is estimated to fully open by 2017 and the second line by 2022. The third line is still being planned.
The aim of this study is to quantify the potential emission reduction and health co-benefits through modal shift from the two
upcoming MRT lines in GKL. We quantified the changes in CO2 equivalent and air pollutant emissions from the private motor vehicles
that would shift to the MRT system, and the subsequent changes in premature mortality and morbidity from air pollution, traffic
injuries and physical activity. This study differs from the preliminary results on mortality avoidance presented in Kwan et al. (2016)
as this study uses more recent emission factors and primary trip data from a travel survey in the calculations. Besides, we also
included the future MRT (SSP) and the contribution of private motor vehicle use in the access and egress of the MRT stations in the
estimation of total emissions and health co-benefits.
2. Method
2.1. Conceptual framework
A travel survey was conducted to collect data on existing travel characteristics of the local population. The travel data was then
fed into the calculation of emission savings and health co-benefits. Fig. 2. shows the conceptual framework for this study. The MRT
system is expected to cause modal shift from private motor vehicles and create induced trips. Induced trips are defined as the
additional trips travelled that would be made when travel conditions such as transport infrastructure improves (Cervero, 2003;
Gorham, 2009). The analysis further separated trips into the line haul and station access-egress. The line haul is the rail journey
distance from home stations to destination stations while the access-egress is the pathway to or from the station at the home-end or
destination-end. The calculation of impact from line haul excluded that of the induced trips because the induced trips would not be
replacing existing private motor vehicle trips. However, there would be additional access-egress trips generated from these induced
trips in the scenario with MRT. The access-egress pathway however was accounted for all trips. The overall changes in vehicle
kilometres travelled would cause changes in transport CO2 emissions, air pollutant emissions and road traffic exposure while station
access-egress provides increased opportunity for walking. Cycling was not modelled due to low baseline modal share and lack of safe
cycling infrastructure.
The health co-benefits included air pollution, traffic injuries and physical activity. This study adopted the comparative health risk
analysis method (Ezzati et al., 2004) as applied in the Integrated Transport and Health Impact Modelling (ITHIM) (Woodcock et al.,
2013, 2014; Woodcock et al., 2009). The air quality was assessed based on the change in ambient PM2.5 concentration from air
188
S.C. Kwan et al.                                                                                                  Journal of Transport & Health 6 (2017) 187–200

                                                                                               MRT (SSP)

                           MRT (SBK)

                                     MRT(SBK) line
                                     MRT(SSP) line
                                     Sampling location

                                     Continuous air
                                     quality monitoring
                                     stations

             Fig. 1. MRT lines, sampling locations of survey (S1-S7) and continuous air quality monitoring stations (A1-A4) in Greater Kuala Lumpur.

pollutant emissions. The baseline burden of disease data was retrieved from the Malaysian national data in the Global Burden of
Disease Study 2010 (GBD, 2013). The disease cause categories included in the health assessment were according to ITHIM as pre-
sented in Maizlish et al. (2011) (Table A.1). All the emissions and health co-benefits amount were calculated for 365 days per year.
We assumed no lag between the changes in air quality and physical activity, and health.

2.2. MRT ridership and modal shift

    The projected ridership for the two MRT lines were derived from the Environmental Impact Assessment (EIA) Report of the
respective MRT lines (EIA, 2011, 2015). For the first MRT (SBK) line, there would be 442,000 daily ridership in the opening year of

                                                                 Fig. 2. Conceptual framework.

                                                                              189
S.C. Kwan et al.                                                                                Journal of Transport & Health 6 (2017) 187–200

2017. From the ridership, there would be an expected modal shift of 66% from passenger cars, 33% from motorcycles and 1% from
buses. The second MRT (SSP) line would have 533,000 daily ridership at the full commencement in 2022. The amount of modal shift
for the MRT (SSP) line was not stated in its EIA report and was therefore assumed to be the same as the MRT (SBK) line. Due to the
small percentage of bus modal shift and data limitation, bus was not included in the modelling except for the sensitivity analysis.
Although the technical report for the ridership estimation could not be accessed, the figures were considered reasonable when
compared to the 190 km Delhi metro with 1.79 million ridership (Doll and Balaban, 2013). Besides, the EIA report had been reviewed
by the expert panel required for the approval by the Department of Environment (Department of Environment, 2007).

2.3. Travel data (survey)

    A cross sectional travel survey was conducted to get information on the existing travel pattern in the corridor of the MRT (SBK)
line only as the stations for the MRT (SSP) line have not been finalized then. The survey areas were chosen by systematically sampling
eight out of the 31 planned MRT (SBK) stations to get at least 60 respondents from each station. This was followed by a convenient
sampling of survey locations relative to the selected stations. The nearest local supermarkets to the stations were selected as survey
locations in order to reach out to the household residents in the vicinity who will be the potential users of the MRT (Fig. 1.). All the
respondents were above 18 years old and were approached through intercept method. Most of them (> 90%) were willing to accept
the interview on the spot. The study area consisted of residential, commercial, institutional and industrial areas along major road
networks (EIA, 2011). All the survey locations in this study were within 5 km from the MRT stations which were then under con-
struction. The survey was carried out between February 2015 and June 2015. All the travel data used in modelling were based on the
outcome from the survey.

2.4. Scenario

    Changes in CO2 and air pollutant emissions and health outcomes from the use of the MRT (SBK) and MRT (SSP) were compared
against a counterfactual baseline scenario without the MRT lines. The health impacts were estimated using comparative health risk
assessment as shown in Eq. (1) (Ezzati et al., 2004). We applied 15% induced trips which were deducted from the full ridership in the
modelling of emissions and traffic injuries for line haul. This figure was taken with reference to the Indian metro where 14–18% of its
users would not have travelled otherwise (Goel and Tiwari, 2015). Vehicle occupancy were1.6 person per car and 1.3 person per
motorcycle based on Malaysian sources (GEF, 2010).
                     n               n
                   ∑i = 1 Pi RRi − ∑i = 1 P′i RRi
        PAF =                 n
                           ∑i = 1 Pi RRi                                                                                                  (1)

    Pi = proportion of population at baseline exposure level, i
    P’i = proportion of population at counterfactual exposure level, i
    RRi = relative risk at exposure level, i
    n = number of exposure levels

    For trip distance, the median origin-destination distance of current motorised transport users was applied as line haul in the model
assuming that the trips would shift to the MRT. For access-egress, the modal share and the ratio of access-egress distance (for those
using motorised transport) relative to the origin-destination distance was obtained from the current rail users (LRT and KTM) from
the travel survey. The ratio of access-egress distance was based on the concept of interconnectivity ratio by Krygsman et al. (2004).
This ratio was then applied on the origin-destination distance of motor vehicle trips that would be replaced by the MRT line haul. All
users were assumed to walk an average of five minutes per trip either in the access or egress of stations regardless of modal share. This
was due to the large percentage of current riders accessing home-end rail stations by motorised transport and destination-end stations
by walking based on the travel survey.

2.5. Emissions of CO2 and air pollutants

    The emissions of CO2 and PM2.5 air pollutants from the private motor vehicles were calculated with Eq. (2). The magnitude of
transport activity in vehicle distance travelled was calculated based on data from the travel survey. The emission factors were derived
from a number of external sources which were mostly based in the United Kingdom specifically in the urban areas (Tables A.2 and
A.3). For carbon emissions, the amount of CO2, CH4 and N2O emissions were multiplied with their global warming potential (IPCC,
2013) to produce the carbon dioxide equivalents value (CO2 eq). For PM2.5, direct primary PM2.5 from exhaust and the re-entrained
dust from brake wear, tyre wear and road abrasion were calculated. Besides, the emissions of precursor gases of secondary PM2.5
which include SO2, NOx and NH3 were also calculated. Emissions from cold starts of vehicles were calculated by the number of trips
(replacing the vehicle kilometres travelled component in Eq. (2)).

        Total emissions =      ∑ [Mmode (VKTM )     (EFM )]                                                                               (2)

    Mmode: transport mode (passenger car and motorcycle)

                                                                  190
S.C. Kwan et al. Journal of Transport & Health 6 (2017) 187–200
VKTM: vehicle kilometres travelled by vehicle type (km)
EFM: emission factors for by vehicle type (g/km)
2.6. PM2.5 concentration
The change in air quality was represented by the attributable concentration of PM2.5 from the emission reduction using intake
fractions. Taking advantage of the existing model linking emissions to intakes in Kuala Lumpur, the intake fractions were worked
backwards to link emission reduction to concentration reduction (Eq. (3)). Intake fraction specific to Malaysian cities from Apte et al.
(2012) was used for primary PM2.5. Secondary PM2.5 concentrations from the precursors were based on the generic intake fractions
from systematic review by Humbert et al. (2011), and scaled to the location-specific primary intake fraction (Table A.4).
PM 2.5 concentration (mg / m3) =
(iF (ppm)*emissions (kg ))/breathing rate (m3person−1day−1) (3)
The baseline concentration of particulate matter (PM10) was obtained from the averages of continuous air quality monitoring
(CAQM) stations close to the MRT lines (Fig. 1.). The stations were Petaling Jaya, Cheras, Shah Alam and Putrajaya. A ratio of 0.6
PM2.5: PM10 was then applied in estimating the baseline PM2.5 concentration. A linear dose response relationship (Ostro, 2004) was
used to estimate the health burden from acute respiratory diseases (age < 5), cardio-respiratory diseases (age > 30) and lung cancer
(age > 30) (Table A.5). The dose response functions have been consistent with the later evidences (Hoek et al., 2013) and the
baseline PM2.5 concentration in Kuala Lumpur was within the applicable range under 30 µg/m3.
2.7. Traffic injuries
The baseline rates of road traffic death and injury per vehicle kilometre travelled by mode were calculated from the national road
traffic injury data (2010–2013) and vehicle kilometres travelled by mode data (2009) obtained from Malaysian Institute of Road
Safety Research (MIROS). The national traffic injury data obtained has been processed with the MIROS Road Accident Analysis and
Database System (M-ROADS). The vehicle distance travelled was assumed to be constant through the years. The distribution of
vehicle kilometres travelled for each age groups were calculated using vehicle ownership rate per population and applied to the size
of the population in each age groups. For pedestrian exposure where walking distance data was not available, the national mean
walking minutes in the National Health and Morbidity Survey (2011) urban strata was converted to distance using walking speed
applied by Woodcock et al. (2009).
The modelling of road traffic injuries encompassed the reduction in the distance travelled on road by private motor vehicles, and
the additional distance travelled by private motor vehicles and pedestrian walking during the access-egress of MRT stations. A
constant linear exposure-casualty relationship was applied, with higher risks of casualty with increased kilometres travelled by each
transport mode. Each walking trip distance was 0.45 km based on the survey data. The attributable fractions for death and disability
years were calculated collectively based on the risks of death and major injury using motor vehicles relative to taking the MRT,
including the access-egress trips. The risk of injury during rail trip was not included as urban rail injuries were uncommon in Malaysia
(Nordin et al., 2014).
2.8. Physical activity
The change in physical activity level was modelled by adding the increase in metabolic equivalents (MET) hours per week from
walking to the background physical activity. Each walking minutes was assigned 3.5 METs at moderate pace (2.8–3.2 mph) based on
the Compendium of Physical Activity (Ainsworth et al., 2011). The background physical activity of population in the urban strata of
Kuala Lumpur and Selangor was obtained from the National Health Morbidity and Mortality Survey (NHMS) 2006. The amount of
physical activity measured in the survey encompassed three life domains: work, leisure and transport. Only the sum of work and
leisure activities were taken as the background physical activity. To estimate the impacts for people with low, medium and high
background physical activity level, we calculated the impacts with 5th percentile, mean and 95th percentile of the background
physical activity distribution.
The relative risks of diseases related to physical activity were based on the ITHIM tool as described elsewhere (Woodcock et al.,
2014; Götschi et al., 2015) (Table A.6). The exposure response functions of physical activity were curvilinear by using a power
transformation specific to each diseases. As the relative risks for diabetes and cardiovascular diseases were based on background
walking only, in this case, activity from the travel domain in NHMS 2006 was used for calculations.
The relative risks for the related diseases were based on cumulative physical activity. Therefore, two trips per day was assumed
for each MRT users based on the median number of trips made on a weekday in the travel survey. The amount of additional physical
activity due to walking to access and egress from the rail system was derived from the travel pattern and people's willingness to walk
which was enquired in the survey. A minimum walking duration of 5 min per trip was used to represent those who use motor vehicles
to access stations and walk to egress stations. A maximum walking duration of 10 min per trip was used to represent those who walk
in both the access and egress trips. The averages of relative risks from both durations were applied in the model. The physical activity
assessment were computed to include the whole ridership including induced trips.
191S.C. Kwan et al. Journal of Transport & Health 6 (2017) 187–200
2.9. Population of impacts
There were two population of impacts in this study. First, the population of impacts for traffic injuries and physical activity were
the entire projected population of MRT ridership (Section 2.2). The population of impacts from the ridership was assumed to be aged
15–74 as they were assumed to make most of the travelling. We also assume that the intention to shift from the motor vehicles to rail
transport does not vary between gender and age groups, and applied the general population distribution of Kuala Lumpur and
Selangor in year 2015 on the ridership population. Second, the impact from air pollution exposure was modelled on the population
catchment of the MRT system. According to the EIA reports of the MRT lines, the first MRT (SBK) and the second MRT (SSP) lines
would have 1.2 million and 2.0 million population catchment respectively.
2.10. Sensitivity analysis
Sensitivity analysis evaluated the impact of variable uncertainties in this study (Table A.7). All sensitivity analyses were based on
the MRT (SBK). For CO2 equivalent emissions, the uncertainty analysed were: ridership, induced trip, line haul distance, modal share
and access-egress trip distance ratio for motor vehicle. For health burden reduction, additional variables were analysed: walking
minutes, background physical activity level, background physical activity using leisure activity only, linear physical activity exposure
response relationship, PM2.5 intake fractions and 95% confidence interval (CI) of PM2.5 relative risks. Sensitivity analysis of health
impacts from physical activity was done through the analysis of all cause mortality using transport domain activity from NHMS 2006
as the background physical activity (Woodcock et al., 2013).
3. Results
3.1. Travel data and vehicle kilometres travelled
A total of 509 respondents ranging from the ages of 18–79 years were questioned on their conventional weekday travel pattern.
Among the respondents, 59% were car drivers and passengers, 18% motorcyclists, 10% rail users, 3% bus users, 4% others and the
rest were those with no trips on a particular weekday. A total of 1185 trips on a weekday was recorded from the survey. The median
vehicle trip distance was 10.3 km for passenger car and 9.8 km for motorcycle.
Due to the small number of rail users surveyed, the ratio of rail station access-egress distance relative to the origin-destination
distance using motor vehicles were combined for passenger car and motorcycle. Overall, the median access-egress distance ratio was
0.42. This means that rail users who used motor vehicle to access or egress stations travelled 58% less kilometres compared to the
entire origin-destination journey by motor vehicle. For the access-egress modal share, 48% of rail users used motor vehicles while
24% walked to get to or from the rail stations at the home-end; whereas, only 4% used motor vehicles while 67% walked at the
destination-end (Fig. A.1).
Using these inputs, the projected number of vehicle trips and kilometres reduced per day by the modal shift of passenger cars and
motorcycles to MRT (SBK) and MRT (SSP) is presented in Table 1. The two MRT lines would reduce 228,000 vehicle trips and 4.2
million vehicle km daily. Passenger cars constituted 54% of the vehicle km reduction which reflected its larger share of modal shift.
However, the use of private motor vehicles in the access-egress trips would also produce 324,000 trips and 1.4 million km per day,
mostly from passenger cars. This would offset 25% of the total reduction of vehicle kilometres from line haul.
3.2. CO2 equivalent and PM2.5 emissions
The amount of CO2 emission reduction is presented in Table 2. The two MRT lines would reduce 242,200 t of CO2 equivalent per
year from private vehicle trips. Motorcycles would contribute 32% of the emission reduction, and passenger cars the rest. Besides,
motorised trips in the access-egress of stations would emit another 95,600 t CO2 equivalents per year which will offset 28% of the
Table 1
Projected number of vehicle trips and kilometres reduced from modal shift per day ('000).
MRT (SBK) MRT (SSP) Total
PC MC Subtotal PC MC Subtotal
Number of trips
Line haul −155 −95 −250 −187 −115 −302 −552
Access-egress 130 17 147 157 21 177 324
Net total −25 −78 −103 −30 −95 −125 −228
Trip distance (km)
Line haul −1596 −935 −2531 −1925 −1127 −3052 −5583
Access-egress 561 70 631 677 84 761 1392
Net total −1035 −865 −1899 −1248 −1043 −2291 −4190
PC: passenger car, MC: motorcycle
192S.C. Kwan et al. Journal of Transport & Health 6 (2017) 187–200
Table 2
CO2 eq (tons/year) and PM2.5 emissions (g/day).
MRT(SBK) MRT (SSP) Total
PC MC Subtotal PC MC Subtotal
CO2 eq (tons/year)
Line haul −114,848 −38,306 −153,155 −138,493 −46,193 −184,687 −337,842
Access-egress 40,484 2867 43,353 48,819 3458 52,279 95,632
Net total −74,364 −35,439 −109,802 −89,674 −42,735 −132,408 −242,210
PM2.5 (g/day)
Line haul −20,751 −18,693 −39,444 −25,024 −22,541 −47,565 −87,009
Access-egress 7301 1400 8701 8805 1688 10,493 19,194
Net total −13,450 −17,293 −30,743 −16,219 −20,853 −37,072 −67,815
PC: passenger car, MC: motorcycle
carbon savings from line haul. For PM2.5 emissions, a total of 67,800 g PM2.5 would be reduced per day. Motorcycle would con-
tribute 56% of the PM2.5 emission reduction while passenger cars would contribute the other 44%. Precursory gases for secondary
PM2.5 would also be reduced by 3045 g for SO2, 1,226, 003 g for NOx and 27,302 g for NH3 per day.
3.3. PM2.5 concentration
Accounting for the formation of secondary PM2.5 from precursor gases, the ambient PM2.5 concentrations would be reduced by
0.056 µg/m3 from MRT (SBK) and 0.068 µg/m3 from MRT (SSP). Primary PM2.5 emissions would contribute 91% of the total
reduction in ambient PM2.5 concentration. Considering that the baseline PM2.5 concentration in the region was at 28.5 µg/m3, the
reduction due to the MRT only represents 0.44% reduction from the baseline concentration.
3.4. Health burden
The number of deaths and DALYs that would be prevented from the MRT lines per year are shown in Table 3. For the regional
reduction in ambient PM2.5 concentration, the attributable fraction was 0.00050 for acute respiratory diseases (age < 5), 0.00072
for lung cancer and 0.00019 for cardio-respiratory diseases. In total, the two MRT lines would prevent 5 deaths and 104 DALYs
annually from air pollution in the population catchment with the highest percentage reduction from lung cancer.
For traffic injuries, the annual reduction in vehicle kilometres travelled would prevent 88 deaths and 6300 DALYs per year.
However, the exposure in access-egress trips would offset 45% and 35% of the deaths and DALYs reduction from line haul.
Corresponding to the baseline injury statistics (Fig. A.2), the number of motorcycle injuries prevented would be higher than that of
passenger cars. Overall, the largest traffic injury benefits would be from the younger age groups (15–34 years) which accounted for
more than half (67%) of the DALYs avoided, followed by age group 35–54 (24%) and age group 55–74 (9%). There would be a 0.46
(4%) increase in the number of death for age group 70–74 due to higher rate of pedestrian injuries (Table A.8).
Increased physical activity would reduce 90 deaths and 3200 DALYs annually. The largest reduction would be from cardiovas-
cular diseases, totalling 79 deaths and 2100 DALYs per year. Most (51 deaths) of the prevented deaths would be from ischemic heart
disease (IHD) due to its high population incidence (Table A.9). Although no death would be prevented from depression, a large
number of disability years would be reduced per year (517 DALYs). Cardiovascular diseases would also contribute the highest
percentage reduction of health burden at about 12%, followed by diabetes (11%) and dementia (10%). Population aged 55–74 would
Table 3
Mortality and DALYs avoided by the two MRT lines per year.
MRT (SBK) MRT (SSP) Total
Death DALYs Death DALYs Death DALYs
Air pollutiona
Line haul −2 −44.2 −4 −88.9 −6 −133.1
Access-egress 0.4 9.7 0.9 19.5 1.3 29.2
Net total −1.6 −34.5 −3.1 −69.4 −4.7 −103.9
Traffic injuriesb
Line haul −73 −4424 −88 −5335 −161 −9759
Access-egress 33 1568 40 1891 73 3459
Net total −40 −2856 −48 −3444 −88 −6300
Physical activityb −41 −1443 −49 −1740 −90 −3183
Net total −83 −4334 −100 −5253 −183 −9587
a
Population of impacts: MRT (SBK) = 1.2 million; MRT (SSP) = 2.0 million.
b
Population of impacts: MRT (SBK) = 442,000; MRT (SSP) = 553,000.
193S.C. Kwan et al. Journal of Transport & Health 6 (2017) 187–200
Fig. 3. Sensitivity analysis of CO2 equivalent emissions.
contribute 57% of the reduction in DALYs, followed by age group 35–54 (31%) and age group 15–34 (12%). The age group 70–74
among males whose background physical activity was slightly higher than age group 65-69 (Table A.10) would result in less benefits
due to the curvilinear nature of the exposure response relationship.
In general, the marginal reduction in PM2.5 concentration would contribute small number of health benefits. Traffic injuries and
physical activity would bring almost similar number of death reduction while traffic injuries would contribute most of the DALYs
reduction. The health benefits from air pollution and physical activity would increase with the age groups, while the prevention of
traffic injuries would benefit the young most.
3.5. Sensitivity analysis
Figs. 3 and 4. show the impacts of variable uncertainties on carbon savings and health co-benefits from the MRT system. For
carbon savings, the increase in line haul distance would bring significantly more reduction than other variables. Higher motorcycle
modal shift would result in less carbon savings but more health benefits from traffic injuries. As our access-egress distance ratio was
on the higher end of the reference values (0.2–0.5), the reduction of the distance ratio would increase the carbon savings and health
benefits. Using leisure activity only as the background physical activity would only slightly increase the health benefits by 66 DALYs
per year. Using linear dose response relationship for physical activity would give a considerably larger benefits than using curvilinear
relationship. Sensitivity analysis of impacts from increased physical activity by using all-cause mortality shows a slightly larger
benefit (115 vs 90 deaths).
4. Discussion
This study demonstrates that the two MRT lines would reduce 242,200 t of CO2 equivalents per year based on the changes in
private motor vehicle activity. The comparative health impact assessment estimated that 183 deaths and 9,600 DALYs per year would
be reduced in the population from the MRT operation. Both physical activity and traffic injuries would contribute similar magnitude
of health co-benefits among the MRT users while air pollution would reduce only a small amount of health burden in the population
catchment. The use of private motor vehicle in the station access-egress would offset 28% of the carbon savings and 35% of the traffic
injuries prevented per year from the MRT system.
In Greater Kuala Lumpur, 6 million trips were made by private transport daily in 2010 (Economic Report, 2011). The vehicle trip
distances from the survey were consistent with other local studies at 10 to 15 km (EIA, 2011; Gil Sander et al., 2015). Our results
suggest that the overall shift of motor vehicle trips to MRT (SBK) and MRT(SSP) would reduce 2.8% and 3.4% of the CO2 equivalent
annually from private vehicles in the city. Conversely, the operation of MRT (SBK) and MRT (SSP) would produce 98,459 t and
100,776 t CO2 equivalent per year respectively from electricity generation (EIA, 2011). This gives a net total reduction of 43,000 t
CO2 equivalent per year. Besides, there is a possibility of increased emissions by induced motor vehicle trips due to reduced traffic
from modal shift to MRT. Therefore, aside from building more public transport infrastructure, a culture of using public transport need
to be developed through education and push factors such as limiting motor vehicle access in areas with public transport connections.
Comparing passenger car to motorcycle emissions, the motorcycle would reduce higher amounts of PM2.5 and NOx given its
Fig. 4. Sensitivity analysis of health burden.
194S.C. Kwan et al. Journal of Transport & Health 6 (2017) 187–200
Fig. A.1. Modal share of access-egress at home-end and destination-end of rail users. (Source: Survey on 49 current rail users).
Death Rates per 100m km (2007-2013)
14.00 11.99
11.05
12.00 9.97 9.88
deaths/100m km
9.36 8.97
10.00 8.29
8.00
6.00
4.00 2.82 2.90 2.83 2.52 2.48 2.44 2.25
2.00 0.76 0.80 0.80 0.75 0.68 0.73 0.67
0.00
2007 2008 2009 2010 2011 2012 2013
Year
Passenger car Motorcycle Pedestrian
Fig. A.2. Death rates of traffic injury per 100 million km by transport mode from 2007 to 2013 in Malaysia. (Source: Analysis from data by MIROS).
Table A.1
Diseases related to the health determinants in Global Burden of Disease (Maizlish et al., 2011).
Health determinants Related diseases
Air pollution
Lung cancer (age > 30) Lung cancer (trachea, bronchus, lung)
Acute respiratory diseases (age < 5) Lower respiratory infections
Upper respiratory infections
Respiratory diseases (age > 30) Lower respiratory infections
Upper respiratory infections
Chronic obstructive pulmonary disorder (COPD)
Asthma
Other respiratory diseases
Cardiovascular diseases (age > 30) Hypertensive heart disease
Ischemic heart disease
Cerebrovascular disease (stroke)
Inflammatory heart diseases (age > 30) Cardiomyopathy and myocarditis Endocarditis
Physical activity
Colorectal cancer
Breast cancer
Alzheimer and other dementias
Diabetes mellitus
Depression (unipolar depressive disorders)
Cardiovascular disease Hypertensive heart disease
Ischemic heart disease
Cerebrovascular disease (stroke)
Traffic injuries Road traffic injury (all-cause)
higher emission factors (14 times higher PM2.5 and 7 times higher NOx than car) even though motorcycle was given the lower modal
shift percentage. Besides, the conversion from two-stroke engines to four stroke engines for motorcycle causes higher NOx emissions.
Therefore, although the motorcycle has lower carbon emission, its detrimental impacts on health from air pollutants should not be
neglected. Overall, the use of simple aggregate measure of intake fractions to estimate the effects of emissions on atmospheric PM2.5
concentrations might not have accurately reflected the actual conditions. Although the intake fraction was based on ground level
emissions specific to Malaysia, it did not account for the intraurban variability from mobile source PM2.5 (Greco et al., 2007). In
addition, the personal exposure during the commute was not assessed. As the two MRT lines cross over at several stations, the
population of health impacts might have been double-counted.
For traffic injuries, the number of deaths prevented from motorcycle were 2.5 folds higher than passenger car. These injuries
reduction would even be higher should the MRT usage gravitate towards the younger population. While the risks of motor vehicle
195S.C. Kwan et al. Journal of Transport & Health 6 (2017) 187–200
Table A.2
Emission factors for greenhouse gases, PM2.5 and other gases (g/km).
Gases/ air pollutants Passenger car Motorcycle Source
Greenhouse gases CO2 193.280 24.82 GEF (2010)
CH4 0.109 3.105 NAEI (2013)
N2O 0.002 0.002 Griffin (2014)
PM2.5 PM2.5 0.001 0.014 Griffin (2014)
PM2.5 (tyre wear) 0.005 0.002 Griffin (2014)
PM2.5 (brake wear) 0.003 0.002 Griffin (2014)
PM2.5 (road abrasion) 0.004 0.002 Griffin (2014)
PM2.5 precursor NOx 0.080 0.540 GEF (2010)
SO2 0.001 0.0004 Griffin (2014)
NH3 0.010 0.002 Griffin (2014)
Table A.3
Emission factors for cold start (g/trip) and global warming potential.
Gases/ air pollutants Cold start (Passenger car) (Griffin 2014) Global warming potential (IPCC 2013)
NH3 0.012
NOx 0.243
N2O 0.010 265
CH4 28
CO2 1
Table A.4
PM2.5 Intake fractions.
Primary emissions Precursors Intake fraction (ppm) Scaled intake fraction Breathing rate (m3person−1day−1) References
Primary PM2.5 – 24.00 14.5 Apte et al. 2012
Secondary PM2.5 SO2 0.99 0.54 13.0 Humbert et al. 2011
NOx 0.20 0.11 13.0
NH3 1.70 0.93 13.0
Table A.5
Relative risk functions for PM2.5 air pollution (Ostro, 2004).
Outcome RR function β
Cardio-respiratory (> 30) exp[β(X-Xo)] 0.00893
Lung cancer (> 30) exp[β(X-Xo)] 0.01267
Acute respiratory infections (< 5) exp[β(X-Xo)] 0.00332
X= baseline PM2.5 concentration (µg/m3).
Xo= counterfactual concentration of PM2.5 (µg/m3).
Table A.6
Relative risk parameters for physical activity related diseases (Woodcock et al., 2014).
Diseases MET h/ week Relative risk Power (t)
Breast cancer 3.5 0.94 0.50
Colon cancer (Male) 31 0.80 0.50
Colon cancer (Female) 30 0.86 0.50
Cardiovascular disease 5.4 0.84 0.50
Dementia 24.5 0.72 0.50
Depression 0.8 0.96 0.50
Diabetes 5.6 0.83 0.375
All cause mortality 11 0.89 0.375
injuries fell with age, pedestrian injury rates increased among the older population probably due to falls (Avineri et al., 2012;
Tournier et al., 2016; Gyllencreutz et al., 2015). The changes in risks for other road users such as reduced risk of vehicle collisions and
increased vehicle speed due to less traffic were not modelled. However, measures such as speed limits is necessary to prevent
accidents from reduced traffic (Kloeden et al., 1997; Moore et al., 1995). In addition, Manan and Várhelyi (2012) stated that
196S.C. Kwan et al. Journal of Transport & Health 6 (2017) 187–200
Table A.7
Range of figures for variables in sensitivity analysis.
Dark shading Center Light shading
Ridership −20% MRT(SBK): 442,000 +20%
MRT(SSP): 553,000
Induced trips 5% 15% 25%
Line haul (km) 21 km (75th percentile of private vehicle car: 10.3 km motorcycle: 9.8 km 15 km (rail journey distance including
trip distance) transfer)
Mode share 60%car, 30%motorcycle, 10%bus 66%car, 33%motorcycle, 1%bus 33%car, 66%motorcycle, 1%bus
Access-egress ratio (motor 0.20 0.42 0.50
vehicle)
Walking minutes/day 8 10 33
Baseline physical activity 5th percentile mean 95th percentile
Baseline physical activity leisure background mean –
(leisure)
Relative risk (physical activity) linear curvilinear –
Intake fraction PM2.5=44 PM2.5=24 –
SO2=0.99 SO2=0.59
NOx=0.20 NOx=0.11
NH3=1.70 NH3=0.93
(Humbert et al. 2011)
Relative risk (air pollution) 95% upper CI relative risks 95% lower CI
Table A.8
Relative risks of traffic injuries for shifting from motor vehicle to MRT.
Age Death Major injury
15–19 0.19 0.22
20–24 0.27 0.24
25–29 0.32 0.25
30–34 0.37 0.31
35–39 0.40 0.35
40–44 0.38 0.31
45–49 0.39 0.34
50–54 0.40 0.32
55–59 0.53 0.40
60–64 0.69 0.53
65–69 0.64 0.49
70–74 1.04 0.87
Table A.9
Attributable mortality and morbidity of increased physical activity by related diseases from MRT use.
MRT (SBK) MRT (SSP) Total
Death DALYs Death DALYs Death DALYs
Breast cancer −1 −22 −1 −27 −1 −49
Colon cancer −1 −21 −1 −25 −2 −46
Dementia 0 −8 0 −10 0 −18
Depression 0 −234 0 −283 0 −517
Diabetes −4 −178 −5 −214 −8 −392
Hypertensive heart disease −1 −39 −2 −47 −3 −85
Ischemic heart disease −23 −627 −28 −756 −51 −1,382
Cerebrovascular heart disease −11 −314 −14 −379 −25 −693
Total −41 −1,443 −49 −1,740 −90 −3,183
underreporting of severe injuries was up to 600% and slight injuries up to 1400% in Malaysia. A comparison of 2008 data from
MIROS with that from the Ministry of Health indicated the same number of deaths were recorded but there was an underreporting of
traffic injury incidence by 4.6 folds. Therefore the attributable fractions were applied to the GBD 2013 data in this study, which
already allowed for underreporting.
For rail users, the station access and egress are the most direct opportunity to incorporate physical activities through walking.
These walking activities could be important amongst the most sedentary population groups that constitute the majority of the urban
population today (Samitz et al., 2011; Kelly et al., 2014). Sensitivity analysis of physical activity through all cause mortality shows
that there could be more health benefits such as social interaction other than those diseases included in this study (Boniface et al.,
197S.C. Kwan et al. Journal of Transport & Health 6 (2017) 187–200
Table A.10
Background physical activity level (work & leisure) in METs-hour per week.
(Source: Analysis from data in NHMS 2006).
Age Male Female
15–19 6.97 5.54
20–24 11.66 6.08
25–29 13.12 7.95
30–34 12.42 8.03
35–39 11.91 7.77
40–44 11.18 7.84
45–49 11.81 7.38
50–54 10.54 7.94
55–59 9.07 4.30
60–64 5.27 4.36
65–69 2.44 2.45
70–74 2.74 0.89
2015). Besides, the background physical activity level did not include household activity domain, which might have overestimated
benefits especially among females.
Sensitivity analysis on variables identified line haul distance as the main determinant of the carbon emissions model. Rail
transport journeys (15 km) were on average longer than private vehicle trips (10 km) in the travel survey, which is similar to other
studies (Goel and Tiwari, 2015; Vijayakumar et al., 2011). Thus, the estimates in the main analysis using private vehicle trip distance
was conservative. Using leisure activity as the background physical activity resulted in small changes although most of the relative
risks used in the model were based on leisure activity domain.
The results in this study were consistent with previous studies although those studies did not specifically include the access-egress
modes. The replacement of 20% car trips with public transport in the Barcelona metropolitan could reduce 20 deaths per year in a
population of 1.6 million (Rojas-Rueda et al. 2012). In Adelaide, the replacement of 20% of passenger vehicle kilometres travelled
(6.7 million VKT) would reduce 122 deaths and 1,892 DALYs in the population year of 2030 (Xia et al. 2015). Although the study by
Rojas-Rueda et al. (2012, 2013) on personal air pollution exposure by public transport mode found slight increase in mortality, the
benefits from physical activity have been shown to outweigh the risk of exposure to the level of air pollution for walking (Tainio et al.,
2016). These results indicated that shifting from private vehicles to public transport could on overall bring health benefits.
The modal shares of passenger cars in the access and egress trips obtained in the survey reflected that of car-dependent United
States which lay between 27.0% and 51.6% by park-and-ride (Bergman et al., 2011; Vijayakumar, 2011; Semler and Hale, 2010;
Khalid et al., 2014). Besides, the tendency to use private mode at the home-end stations has facilitated the availability of park and
ride facility at 16 out of 31 stations of MRT (SBK) and 15 out of 37 stations of MRT (SSP) in order to encourage ridership. However,
the access-egress distance ratio which usually lies between 0.2 to 0.5 (Krygsman et al., 2004; Goel and Tiwari, 2015) might be
overestimated due to lack of rail services in the study area. Nonetheless, the implementation of public transport friendly policies in
the city centre might have encouraged people to use it despite the longer access-egress distance. With the development of the MRT,
the access-egress ratio may fall over time as more settlements are built close to the infrastructure (Durand et al., 2016).
All the input data in the model were obtained from the travel survey and local sources where available. However, the insufficient
information on rail transit use was one of the major limitations in this study because of the small sample of rail users from the survey
due to the dominance of private motor vehicle modal share in the population. The sample size in this study might also have not
sufficiently captured the characteristics of travel choices in the area. For verification of the results from this study, the travel
characteristics of the MRT users before and after using the MRT system could be collected when sufficient ridership has been
achieved.
5. Policy implications
The government's policy to focus on the development of integrated public transport system through the establishment of the MRT
system would contribute to the national target of reducing carbon emissions while introducing health co-benefits among the locals.
This study shows that the choice of transport mode in the station access-egress is important to get the greatest emissions reduction
and health co-benefits in the long term. Despite the overall reduction in the use of private transport mode, it seems that the vehicles
on the roads in the direction towards the stations in the area would not reduce much, if not increase, due to motor vehicles accessing
the stations. Thus it is essential that safe and direct walking routes are provided for pedestrians to access the stations. This is to ensure
their safety and realise the potential health benefits especially protection from traffic injury risk which would be much more im-
mediate compared to the chronic diseases reduction.
In addition to building rail infrastructure, bus services and cycling should be encouraged to replace private motorised trips in the
access especially at the home-end stations. Bus rapid transit (BRT) that connects MRT stations to residences and workplaces would
avoid the daily traffic gridlock and attract more people to use buses instead of driving to the stations. Currently cycling is not a
common mode in Greater Kuala Lumpur but it has the potential to enable access to the station from a much wider catchment area
than walking and is far more space efficient than driving. Providing infrastructures for cycling such as protected cycling lanes and
198S.C. Kwan et al. Journal of Transport & Health 6 (2017) 187–200
bicycle parking facilities could be a way to encourage alternative transport and further improve the health co-benefits of metro
development. Reducing the number of motor vehicles accessing the stations would also improve pedestrian safety.
6. Conclusion
This study demonstrated that the two forthcoming MRT lines in Greater Kuala Lumpur could reduce carbon emissions from
private transport and improve urban population health. The prevention of traffic injuries and increased physical activity among the
user population would accrue equally important health co-benefits, followed by smaller co-benefit from the reduction in air pollution
in the population catchment area. However, this study also underscored the role of the access and egress of the MRT stations in
carbon emissions and health co-benefits overall. Therefore, careful planning around the MRT stations is necessary to realize the
amount of benefits brought by the MRT system. This is the first study in Malaysia that quantitatively relates multiple health impacts
to public transport infrastructure. The results from this study could inform future planning of rail transport in expanding cities,
especially of the developing countries.
Acknowledgement
The authors would like to thank the Director General of Health, Malaysia for his permission to use the data from the National
Health and Morbidity Survey III. We would also like to thank the Department of Environment Malaysia for providing air quality data,
and Malaysian Institute of Road Safety Research (MIROS) for providing traffic injuries data. We are grateful to the United Nations
University- International Institute for Global Health and the National University of Malaysia for jointly funding this research project.
SCK and JHH: Research was funded by the United Nations University- International Institute for Global Health and the National
University of Malaysia under the project codes of UNU-IIGH 80814 and FF-2014-400, respectively.
MT and JW: The work was undertaken by the Centre for Diet and Activity Research (CEDAR), a UKCRC Public Health Research
Centre of Excellence. Funding from the British Heart Foundation, Cancer Research UK, Economic and Social Research Council,
Medical Research Council, the National Institute for Health Research, and the Wellcome Trust (MR/K023187/1), under the auspices
of the UK Clinical Research Collaboration, is gratefully acknowledged.
Appendix A
See Figs. A.1 and A.2.
See Tables A.1–A.10.
References
[dataset] Global Burden of Disease Study (GBD), 2013. Malaysia Global Burden of Disease Study 2010 (GBD 2010) Results 1990–2010. Seattle, United States: Institute
for Health Metrics and Evaluation (IHME).
Ainsworth, B., Haskell, W., Herrmann, S., Meckes, N., Bassett, Jr D., Tudor-Locke, C., Greer, J., Vezina, J., Whitt-Glover, M., Leon, A. The Compendium of Physical
Activities Tracking Guide. Healthy Lifestyles Research Center, College of Nursing & Health Innovation, Arizona State University. Available at ⟨https://sites.google.
com/site/compendiumofphysicalactivities/⟩.
American Public Transport Association (APTA). Recommended practice for quantifying greehouse gas emissions from transit. APTA Climate Change Standards
Working Group, APTA CC-RP-001–09. Available at ⟨http://www.apta.com/resources/hottopics/sustainability/Documents/Quantifying-Greenhouse-Gas-
Emissions-APTA-Recommended-Practices.pdf⟩. (Accessed 19 March 2017).
Apte, J.S., Bombrun, E., Marshall, J.D., Nazaroff, W.W., 2012a. Global intraurban intake fractions for primary air pollutants from vehicles and other distributed
sources. Environ. Sci. Technol. 46, 3415–3423.
Asian Development Bank (ADB). Reducing carbon emissions from transport projects. Evaluation study Ref. no. EKB: REG 2010-16. Available at ⟨https://www.adb.org/
documents/reducing-carbon-emissions-transport-projects⟩. (Accessed 19 March 2017).
Avineri, E., Shinar, D., Susilo, Y.O., 2012. Pedestrians' behaviour in cross walks: the effects of fear of falling and age. Accid. Anal. Prev. 44, 30–34.
Bergman, A., Gliebe, J., Strathman, J., 2011. Modeling access mode choice for inter-suburban commuter rail. J. Public Transp. 14 (4).
Boniface, S., Scantlebury, R., Watkins, S.J., Mindell, J.S., 2015. Health implications of transport: evidence of effect of transport on social interactions. J Transp. Health
2, 441–446.
Cervero, R., 2003. Road expansion, urban growth, and induced travel: a path analysis. J. Am. Plan. Assoc. 69 (2), 145–163.
Department of Environment. Environmental Impact Assessment (EIA): Procedure and Requirement in Malaysia, 2007. Available at ⟨http://www.doe.gov.my/eia/wp-
content/uploads/2013/06/EIA-Procedure-and-Requirements-in-Malaysia.pdf⟩ (Accessed 3 June 2017).
Dodman, D., 2009. Blaming cities for climate change? An analysis of urban greenhouse gas emissions inventories. Environ. Urban. 21 (1), 185–201. http://dx.doi.org/
10.1177/0956247809103016.
Doll, C.N.H., Balaban, O., 2013. A methodology for evaluating environmental co-benefits in the transport sector: application to the Delhi metro. J. Clean. Prod. 58,
61–73.
Durand, C.P., Tang, X., Gabriel, K.P., Sener, I.N., Oluyomi, A.O., Kohl III, H.W., 2016. The association of trip distance with walking to reach public transit: data from
the California Household Travel Survey. J. Transp. Health 3, 154–160.
Economic Report 2011. Chapter 3 Economic performance and prospects. Ministry of Finance Malaysia 2011/2012. Available at ⟨http://www.treasury.gov.my/index.
php/en/archives/2011/economic-report.html⟩. (Aaccessed 12 December 16).
Eleventh Malaysia Plan, 2015. (2016–2020): Anchoring growth on people. Kuala Lumpur: Economic Planning Unit, Prime Minister’s Department.
Environmental Impact Assessment report (EIA), 2011. Klang Valley Mass Rapid Transit Sungai Buloh – Kajang line. Approved by Malaysian Department of
Environment (DOE).
Environmental Impact Assessment report (EIA), 2015. Klang Valley Mass Rapid Transit Sungai Buloh – Serdang- Putrajaya line. Approved by Malaysian Department of
Environment (DOE).
Ezzati, M., Lopez, A.D., Rodgers, A., Murray, C.J., 2004. Comparative Quantification of Health Risks: Global and Regional Burden of Disease Attributable to Selected
199S.C. Kwan et al. Journal of Transport & Health 6 (2017) 187–200
Major Risk Factors. World Health Organization, Geneva.
Gil Sander, F., Blancas, L.C., Westra, R., Jensen, I., Manopiniwes, C., Pan, L., et al., 2015. Malaysia Economic Monitor: Transforming Urban Transport. The World Bank.
Global Environment Facility (GEF), 2010. Manual for Calculating Greenhouse Gas Benefits of Global Environment Facility Transportation Projects. Prepared by the.
Institute for Transportation and Development Policy For the Scientific and Technical Advisory Panel of the Global Environment Facility, 2010. Available at
⟨https://www.thegef.org/gef/pubs/STAP/CO2-Calculator⟩. (Accessed 12 December 2016).
Goel, R., Tiwari, G., 2015. Access – egress and other travel characteristics of metro users in Delhi and its satellite cities. IATSS Res. http://dx.doi.org/10.1016/j.iatssr.
2015.10.001.
Gorham R., 2009. Demystifying induced travel demand. Sustainable urban transport technical document #1. Available at ⟨http://www.sutp.org/files/contents/
documents/resources/B_Technical-Documents/GIZ_SUTP_TD1_Demystifying-Induced-Travel-Demand_EN.pdf⟩. (Accessed 12 December 2016).
Götschi, T., Tainio, M., Maizlish, N., Schwanen, T., Goodman, A., Woodcock, J., 2015. Contrasts in active transport behaviour across four countries: how do they
translate into public health benefits? Prev. Med. 74, 42–48.
Greco, S.L., Wilson, A.M., Hanna, S.R., Levy, J.I., 2007. Factors influencing mobile source particulate matter emissions-to exposure relationships in the Boston urban
area. Environ. Sci. Technol. 41, 7675–7682.
Griffin, A., 2014. Road Transport Emission Factors. National Atmospheric Emissions Inventory, London, UK Available at. ⟨http://naei.defra.gov.uk/data/ef-transport⟩
(Accessed 10 September 2015).
Gyllencreutz, L., Bjornstig, J., Rolfsman, Ewa, Saveman, B.I., 2015. Outdoor pedestrian fall-related injuries among Swedish senior citizens – injuries and preventive
strategies. Scand. J. Caring Sci. 29, 225–233.
Hoek, G., Krishnan, R.M., Beelen, R., Peters, A., Ostro, B., Kaufman, J.D., 2013. Long-term air pollution exposure and cardio-respiratory mortality: a review. Environ.
Health 12, 43.
Humbert, A., Marshall, J.D., Shaked, S., Spadaro, J.V., Nishioka, Y., Preiss, P., Jolliet, O., 2011a. Intake fraction for particulate matter: recommendations for life cycle
impact assessment. Environ. Sci. Technol. 45 (11), 4808–4816.
Intergovernmental Panel on Climate Change (IPCC): Climate Change, 2013. The Physical Science Basis. In: Stocker, T.F., Qin, D., Plattner, G.-K., Tignor, M., Allen, S.K.,
Boschung, J., Nauels, A., Xia, Y., Bex, V., Midgley, P.M. (Eds.), Contribution of Working Group I to the Fifth Assessment Report of the Intergovernmental Panel on
Climate Change. Cambridge University Press, Cambridge, United Kingdom and New York, NY, USA.
Kelly, P., Kahlmeier, S., Götschi, T., Orsini, N., Richards, J., Roberts, N., et al., 2014. Systematic review and meta-analysis of reduction in all-cause mortality from
walking and cycling and shape of dose response relationship. Int. J. Behav. Nutr. Phys. Act. 11, 132.
Khalid, U.A., Bachok, S., Osman, M.M., Ibrahim, M., 2014. User Perceptions of Rail Public Transport Services in Kuala Lumpur, Malaysia: ktm Komuter. Proc. - Soc.
Behav. Sci. 153, 566–573.
Kloeden, C.N., McLean, A.J., Moore, V.M., Ponte, G., 1997. Travelling Speed and the Risk of Crash Involvement. NHMRC Road Accident Research Unit The University
of Adelaide Available at. ⟨http://casr.adelaide.edu.au/speed/SPEED-V1.PDF⟩.
Krygsman, S., Dijst, M., Arentze, T., 2004. Multimodal public transport: an analysis of travel time elements and the interconnectivity ratio. Transp. Policy 11, 265–275.
Kwan, S.C., Marko, T., James, W., Jamal, H.H., 2016. Health co-benefits in mortality avoidance from implementation of the mass rapid transit (MRT) system in Kuala
Lumpur, Malaysia. Rev. Environ. Health 31 (1), 179–183. http://dx.doi.org/10.1515/reveh-2015-0038.
Land Public Transport Commission (SPAD), 2013. Greater Kuala Lumpur/Klang Valley Public Transport Master Plan. Available at ⟨http://www.spad.gov.my/projects/
national-master-plan/draft-greater-klklang-valley⟩. (Accessed 20 August 2014).
Land Public Transport Commission (SPAD). 2014. Public transport usage in the Greater Klang Valley Region continues to increase (10 January 2014). Available at
⟨http://www.spad.gov.my/news-events/media-releases/2014/public-transport-usage-greater-klang-valley-region-continues⟩. (Accessed 20 August 2016).
Maizlish N., Woodcock J., Co, S., Ostro B., Fanai A., Fairley D. 2011. Health Cobenefits and Transportation-Related Reductions in Greenhouse Gas Emissions in the San
Francisco Bay Area: Technical Report. Available at ⟨https://www.cdph.ca.gov/programs/CCDPHP/Documents/ITHIM_Technical_Report11-21-11.pdf⟩. (Accessed
20 August 2014).
Manan, M.M.A., Várhelyi, A., 2012. Motorcycle fatalities in Malaysia. IATSS Res. 36, 30–39.
Moore, V.M., Dolinis, J., Woodward, A.J., 1995. Vehicle speed and risk of a severe crash. Epidemiology 6 (3), 258–262.
Mueller, N., Rojas-Rueda, D., Cole-Hunter, T., de Nazelle, A., Dons, E., Gerike, R., et al., 2015. Health impact assessment of active transportation: a systematic review.
Prev. Med. 76, 103–114.
National Atmospheric Emission Inventory (NAEI), 2013. Available at ⟨http://naei.defra.gov.uk/data/ef-all⟩. (Accessed 15 December 2015).
Nordin, N.H., Mohd Masirin, M.I., Ghazali, I., Azis, M.I., 2014. Appraisal on rail transit development: train services and safety. Int. Integr. Eng. Summit.
Ostro B. 2004. Outdoor Air Pollution: Assessing The Environmental Burden of Disease At National And Local Levels. Environmental Burden of Disease Series, No. 5.
Performance Management Delivery Unit (PEMANDU), 2012. Economic Transformation Program Handbook Chapter 5: Greater Kuala Lumpur / Klang Valley. Available
at ⟨http://etp.pemandu.gov.my/download_centre.aspx⟩. (Accessed 21 August 2014).
Rojas-Rueda, D., de Nazelle, A., Teixido, O., Nieuwenhuijsen, M.J., 2012. Replacing car trips by increasing bike and public transport in the greater Barcelona
metropolitan area: a health impact assessment study. Environ. Int. 49, 100–109.
Rojas-Rueda, D., de Nazelle, A., Teixido, O., Nieuwenhuijsen, M.J., 2013. Health impact assessment of increasing public transport and cycling use in Barcelona: a
morbidity and burden of disease approach. Prev. Med. 57 (573–57).
Samitz, G., Egger, M., Zwahlen, M., 2011. Domains of physical activity and all-cause mortality: systematic review and dose–response meta-analysis of cohort studies.
Int. J. Epidemiol. 40, 1382–1400.
Schipper, L., Fabian, H., Leather, J., 2009. Transport and Carbon Dioxide Emissions: Forecasts, Options Analysis, and Evaluation. Asian Development Bank (ADB
Sustainable Development Working Paper Series No. 9).
Semler C., Hale C., 2010. Rail station access- an assessment of options. Australasian Transport Research Forum, Canberra, Australia. Available at ⟨http://www.
worldtransitresearch.info/research/3815/⟩. (Accessed 12 December 2016).
Shaw, C., Hales, S., Howden-Chapman, P., Edwards, R., 2014. Health co-benefits of climate change mitigation policies in the transport sector. Nat. Clim. Change 4.
http://dx.doi.org/10.1038/NCLIMATE2247.
Tainio, M., de Nazelle, A.J., Götschi, T., Kahlmeier, S., Rojas-Rueda, D., Nieuwenhuijsen, M.J., Woodcock, J., 2016. Can air pollution negate the health benefits of
cycling and walking? Prev. Med. 87, 233–236.
Tournier, I., Dommes, A., Cavallo, 2016. Review of safety and mobility issues among older pedestrians. Accid. Anal. Prev. 91, 24–35.
Tzirakis, E., Pitsas, K., Zannikos, F., Stournas, S. Vehicle emissions and driving cycles: comparison of the Athens driving cycle (ADC) with ECE-15 and European driving
cycle (EDC). Global NEST J., Vol.8 (3), 282–290.
UN-Habitat, 2011. Cities and Climate Change: Global Report on Human Settlements, 2011. United Nations Human Settlements Programme.
Vijayakumar, N., El-Geneidy, A.M., Patterson, Z., 2011. Driving to Suburban Rail Stations: understanding variables that affect driving distance and station demand.
Transp. Res. Rec.: J. Transp. Res. Board 97–103.
Woodcock, J., Givoni, M., Morgan, A.S., 2013. Health impact modelling of active travel visions for England and Wales using an Integrated Transport and Health Impact
Modelling Tool (ITHIM). PLoS One 8 (1), e51462. http://dx.doi.org/10.1371/journal.pone.0051462.
Woodcock, J., Tainio, M., Cheshire, J., O’Brien, O., Goodman, A., 2014b. Health effects of the London bicycle sharing system: health impact modelling study. Br. Med.
J. 348–425.
Woodcock, J., Edwards, P., Tonne, C., Armstrong, B.G., Ashiru, O., Banister, D., Roberts, I., 2009. Public health benefits of strategies to reduce greenhouse-gas
emissions: urban land transport. Lancet 374, 1930–1943.
Xia, T., Nitschke, M., Zhang, Y., Shah, P., Crabb, S., Hansen, A., 2015. Traffic-related air pollution and health co-benefits of alternative transport in Adelaide, South
Australia. Environ. Int. 74, 281–290.
200You can also read


