Living conditions in Europe - housing quality Statistics Explained
←
→
Page content transcription
If your browser does not render page correctly, please read the page content below
Living conditions in
     Europe - housing quality                                                                          Statistics Explained

                                                                                              Data extracted in March 2019
                                                                                         Planned article update: March 2021

This article is part of a set of statistical articles that form Eurostat’s flagship publication, Living conditions in
Europe - 2018 edition . Each article helps provide a comprehensive and up-to-date summary of living condi-
tions in Europe, presenting some key results from the European Union’s (EU’s) statistics on income and living
conditions (EU-SILC) , which is conducted across EU Member States, EFTA and candidate countries .

Policy context
In the context of material living standards and well-being, housing is a fundamental characteristic. Indeed,
many people would agree that being able to afford adequate housing of decent quality in a safe environment is
a basic need, as a dwelling should provide shelter, adequate space for its occupants to live, eat and sleep, as
well as a degree of privacy for the household as a whole and for its individual members.

Housing quality is a broad term that covers a wide range of issues, which are related not only to the dwelling
itself, but also to the broader residential area surrounding where people live. Housing quality may be assessed,
for example, in relation to: structural issues such as damp walls or a leaking roof; overcrowding or a shortage
of space; the ability to keep the home adequately warm or, a lack of basic amenities (for example, hot and
cold running water, or bathing and sanitary facilities). It may also be assessed through a wider residential
context, for example, whether (or not) people are living in a noisy area, are exposed to pollution, or feel unsafe
in their neighbourhood. The information presented in this article generally analyses these aspects in terms of
the subjective responses of individuals to questions about their local environment.

Key findings
Overall, 15.7 % of Europeans lived in an overcrowded household in 2017. There were considerable differences
between EU Member States, with overcrowding more prevalent in the southern and eastern Member States,
while cross-country comparisons revealed that the highest levels of overcrowding were usually concentrated in
cities (where space is often at a premium).

In 2017, some 13.3 % of the EU-28 population reported that they were living in a dwelling with a leaking
roof, damp walls, floors or foundation, or rot in window frames or the floor, while over half of this share of the
population — some 7.8 % — were unable to keep their home adequately warm.

In 2017, 17.5 % of the EU-28 population considered that noise from neighbours or from the street was a
problem; this share was slightly higher than the corresponding proportions of the EU-28 population who de-
clared that they faced problems in relation to pollution and grime (14.1 %), or crime, violence or vandalism

                  Source : Statistics Explained (https://ec.europa.eu/eurostat/statisticsexplained/) - 17/04/2019   1
(12.0 %). For all three of these issues, the prevalence of these problems across the EU-28 diminished during the
six-year period from 2011 to 2017.

For many households, the largest single expenditure item each month is in relation to housing costs. In those
cases where housing costs represent a considerable share of total household expenditure, it is increasingly likely
that the population may have to defer or cancel expenditure on other items (possibly in relation to some basic
needs). The housing cost overburden rate is defined by those households which allocate 40 % or more of their
disposable income to housing. In 2017, this rate covered 10.4 % of the EU-28 population (and was much higher
among tenants than owners), with shares rising above 15.0 % in Denmark and Bulgaria, while a peak of 39.6
% was recorded in Greece. Also, in Serbia, the housing cost overburden rate was particularly high (33.6%).

Housing conditions
Poor housing conditions are one of the main contributing factors that prevent Europeans from enjoying an
acceptable standard of living. The first part of this article analyses the distribution of housing stock before
looking in more detail at overcrowding, living space and structural issues that impact on the quality of housing
available to people living in the EU.

Europeans tend to live more in houses than in flats

Figure 1: Population distribution by type of dwelling, 2017(Share of total population)Source:
Eurostat (ilc_lvho01)

In 2017, 41.9 % of the EU-28 population lived in flats, while the majority of people lived in houses — just over
one third (33.6 %) of the population lived in detached houses and almost one quarter (24.0 %) were living in
semi-detached houses (see Figure 1 ).

The share of persons living in flats ranged from 8.3 % in Ireland and 14.7 % in the United Kingdom, to
more than three out of every five people in Estonia (61.8 %), Spain (66.1 %), and Latvia (66.4 %).

By contrast, more than half of the population in Poland (50.5 %) and Denmark (54.1 %) lived in detached
houses, while this share rose to more than 60.0 % in Hungary (63.8 %), Romania (64.7 %) and Slovenia (65.2
%), peaking at 70.7 % in Croatia; a relatively high share of the populations in Norway (58.5 %), Serbia (63.6
%) and North Macedonia (74.3 %) also lived in detached houses.

                                 Living conditions in Europe - housing quality                                  2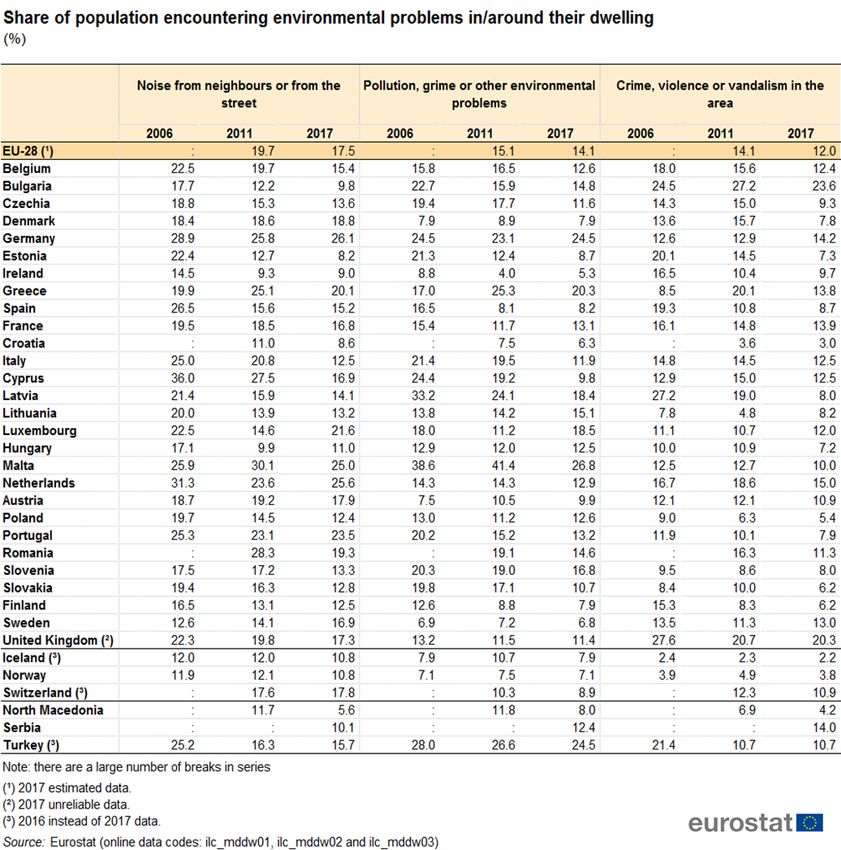
Ireland (51.7 %), the Netherlands (58.7 %) and the United Kingdom (60.4 %) were the only EU Member
States where more than half of the population was living in a semi-detached house in 2017.

Almost 7 out of 10 persons in the EU-28 lived in an owner-occupied dwelling

Many Europeans strive to become homeowners, as this may offer increased security of tenure, while at the
same time providing a means of generating wealth.

Table 1: Population distribution by tenure status, 2017(Share of total population)Source: Euro-
stat (ilc_lvho02)

In 2017, almost 7 out of 10 (69.3 %) persons in the EU-28 lived in an owner-occupied dwelling (see Table 1 ).
Across each of the EU Member States, at least half of the population owned their own home, with this share
ranging from 51.4 % in Germany and 55.0 % in Austria — the only Member States having less than 60.0 %
of their population owning their own dwelling — to 90.1 % in Slovakia, 90.5 % in Croatia and 96.8 % in Romania.

A closer analysis reveals that 42.8 % of the EU-28 population lived in an owner-occupied dwelling without
a housing loan or mortgage in 2017. The share of the population that were homeowners and did not have an
outstanding mortgage or housing loan was generally quite high in eastern Europe and the Baltic Member States
: for example, in Romania, Croatia and Bulgaria it rose to more than 80.0 %. By contrast, in much of western
Europe, more than one third of homeowners had a mortgage or loan and this share rose to more than half in
Sweden (52.2 %) and the Netherlands (60.7 %); high shares were also recorded in Norway (60.5 %) and Iceland
(63.9 %; 2016 data).

Just over three tenths (30.7 %) of the EU-28 population lived in rented accommodation in 2017: some 20.0
% of the population were tenants living in dwellings with a market rent, while 10.7 % lived in rent-free or
reduced-price dwellings. Among the EU Member States, the share of people living in a dwelling with a market

                                Living conditions in Europe - housing quality                                3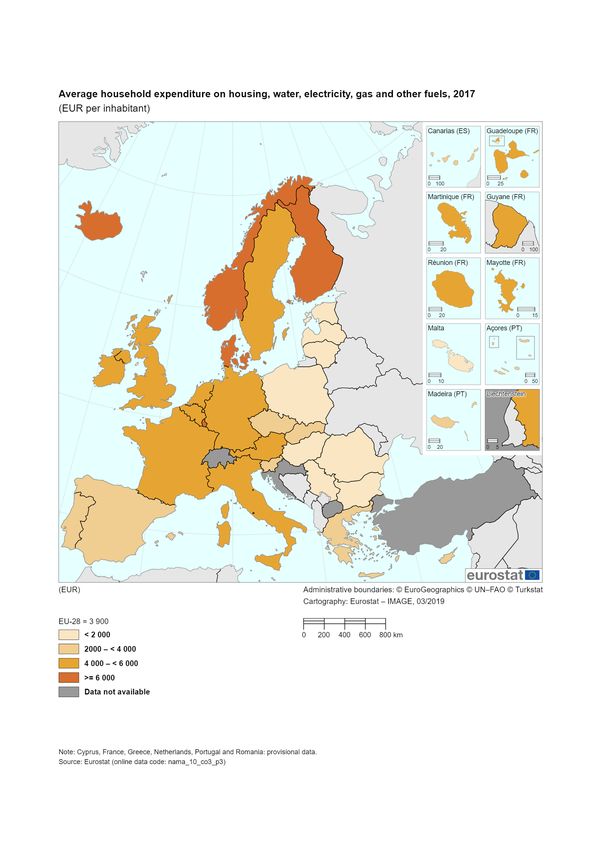
price rent rose to more than 30.0 % in Austria, Sweden, Denmark and Germany (where a peak of 40.0 % was
recorded). There was a relatively high share of the population living in rent-free or reduced-price dwellings in
France (16.4 %), the United Kingdom (17.9 %), Ireland (18.0 %) and Slovenia (19.0 %); this was also the case
in Turkey (15.8 %; 2016 data).

Despite a slowdown in population growth, many EU Member States are characterised by a shortage of (ade-
quate) housing; this reflects, at least in part, a change in the composition of households, as an increasing share
of the population choose to live alone, while fewer extended families occupy the same dwelling.

                Map 1: Overcrowding rate, 2017(%)Source: Eurostat (ilc_lvho05a)

The overcrowding rate is defined on the basis of the number of rooms available to a household, the household’s
size, family situation and the ages of its members. In 2017, some 15.7 % of the EU-28 population lived in an
overcrowded household; this rate ranged from a low of less than 5.0 % in Malta, Cyprus, Ireland, the United
Kingdom and the Netherlands, to more than 40.0 % in Hungary, Poland, Bulgaria, Latvia and Romania (where
the highest share was recorded, at 47.0 %).

As such, the overcrowding rate was generally higher in eastern and, to a lesser degree, southern Europe, while
it was generally lower in western Europe and the Nordic Member States (see Map 1 ).

                                 Living conditions in Europe - housing quality                                  4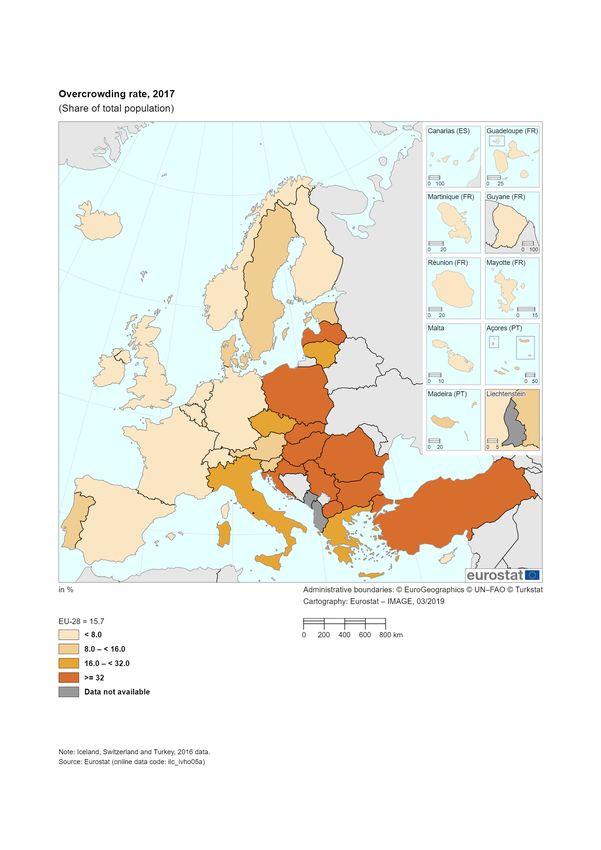
Figure 2: Overcrowding rate by degree of urbanisation, 2017(Share of total population)Source:
Eurostat (ilc_lvho05a) and (ilc_lvho05d)

Figure 2 shows that people living in rural areas were on the whole slightly more likely to be living in crowded
conditions than those living in cities or towns and suburbs . In 2017, 16.8 % of countryside residents in the
EU-28 were living in an overcrowded household, while the corresponding shares for people living in cities (16.1
%) and towns and suburbs (14.2 %) were somewhat lower.

There was more variation among the EU Member States in terms of the distribution of overcrowded households
by degree of urbanisation . In 2017, overcrowding rates for people living in the cities of Denmark and Sweden
were around 10 percentage points higher than for the population living in rural areas, while this gap widened to
16.9 points difference in Bulgaria and peaked at 19.6 points difference in Austria. Exceptions to this pattern of
higher levels of overcrowding in cities were notably in Slovakia, Lithuania, Spain and Cyprus (where the highest
overcrowding rates were recorded for people living in towns and suburbs) and Poland, Hungary and Romania
(where the highest overcrowding rates were recorded for people living in rural areas).

Alongside the overcrowding rate, another measure which may be used to analyse living space is the aver-
age number of rooms per person. In 2017, each EU-28 inhabitant had an average of 1.6 rooms.

The average number of rooms per person was slightly lower, at 1.6, for those people living in cities than it
was for those people living in rural areas (1.7 rooms). Differences in the average numbers of rooms per person
were generally much greater between EU Member States rather than within individual Member States. In 2017,
the average number of rooms per person ranged from a high of 2.2 in Malta (rural areas: low reliability) and
values of at least 2.0 rooms per person in the Netherlands, Cyprus, the United Kingdom, Ireland and Belgium,
down to 1.1 rooms per person in Croatia, Poland and Romania. Among the non-member countries, Norway
recorded the highest average number of rooms per person (2.1), while the average in Serbia (0.9 rooms) was
lower than in any of the EU Member States.

                                Living conditions in Europe - housing quality                                  5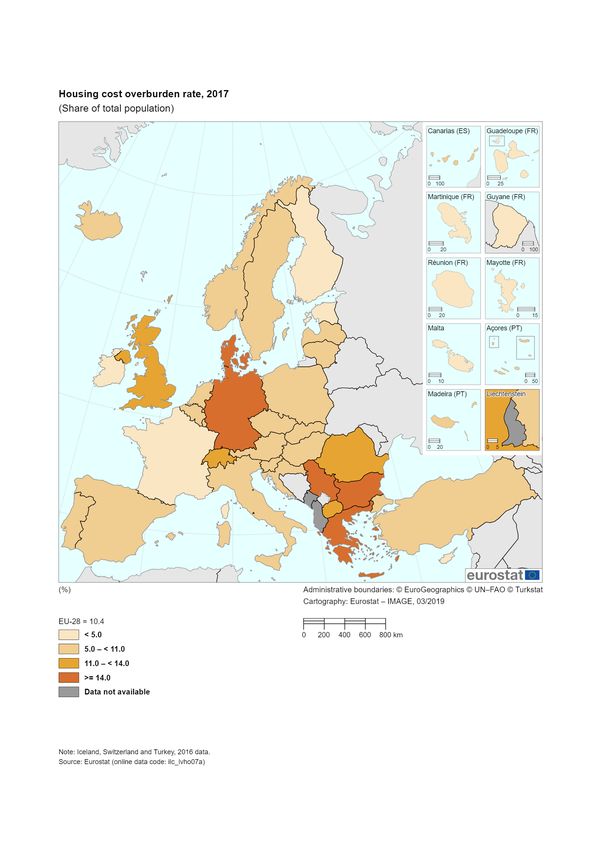
Figure 3: Average number of rooms per person by degree of urbanisation, 2017(Number of
rooms)Source: Eurostat (ilc_lvho04d)

People living in rural areas tended to report the highest (or joint highest) average number of rooms per person.
In 2017, this pattern held in the vast majority of the EU Member States, although the highest average number
of rooms in Cyprus and Slovenia was recorded for people living in cities, and in the Netherlands and Croatia
for people living in towns and suburbs ( Figure 3 ).

A comparison within individual EU Member States reveals that the average number of rooms per person
was generally quite similar when analysed by degree of urbanisation. In Poland and Hungary, those living in
rural areas had, 1.1 respectively 1.2 rooms per person, the same as for people living in the cities or towns and
suburbs.

                                Living conditions in Europe - housing quality                                 6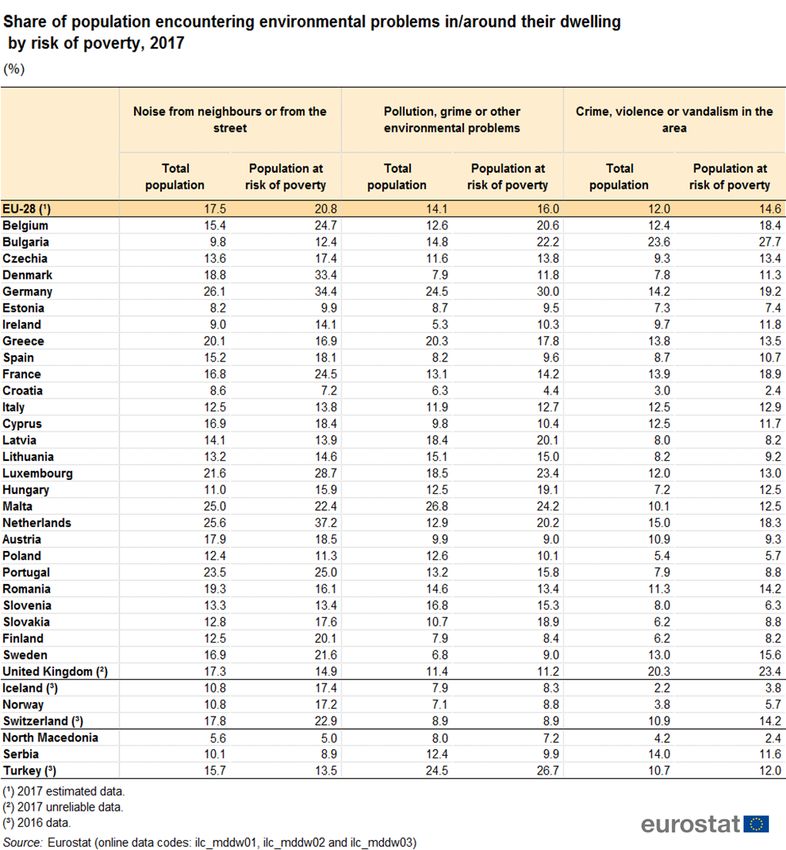
Table 2: Average number of rooms per person by tenure status and type of dwelling, 2017(Number
of rooms)Source: Eurostat (ilc_lvho03)

In 2017, the average number of rooms per person was somewhat higher, at 1.7 rooms, for EU-28 homeowners
than it was for tenants living in rented accommodation, 1.5 rooms per person (see Table 2 ). As may be
expected, the space available to people living in houses was, on average, greater than that available to people
living in flats. This was particularly the case among homeowners, as people living in houses had, on average,
0.3 more rooms per person than homeowners living in flats. There was almost no difference in the average size
of dwellings among tenants, whether they resided in houses (1.6 rooms per person) or flats (1.5 rooms per person).

The average number of rooms per person was higher for homeowners than for tenants in each of the EU Member
States in 2017, with the exception of the Netherlands (where tenants lived, on average, in larger dwellings with
2.2 rooms vs. 1.9 rooms) and Malta (where the dwellings were of similar size).

Space constraints on tenants were particularly apparent in Ireland, where tenants had 0.7 fewer rooms per
person than homeowners; in Luxembourg, the United Kingdom, Lithuania, Austria and Sweden the corre-
sponding gap was at least 0.5 rooms in favour of homeowners.

Structural problems for dwellings

                                 Living conditions in Europe - housing quality                                  7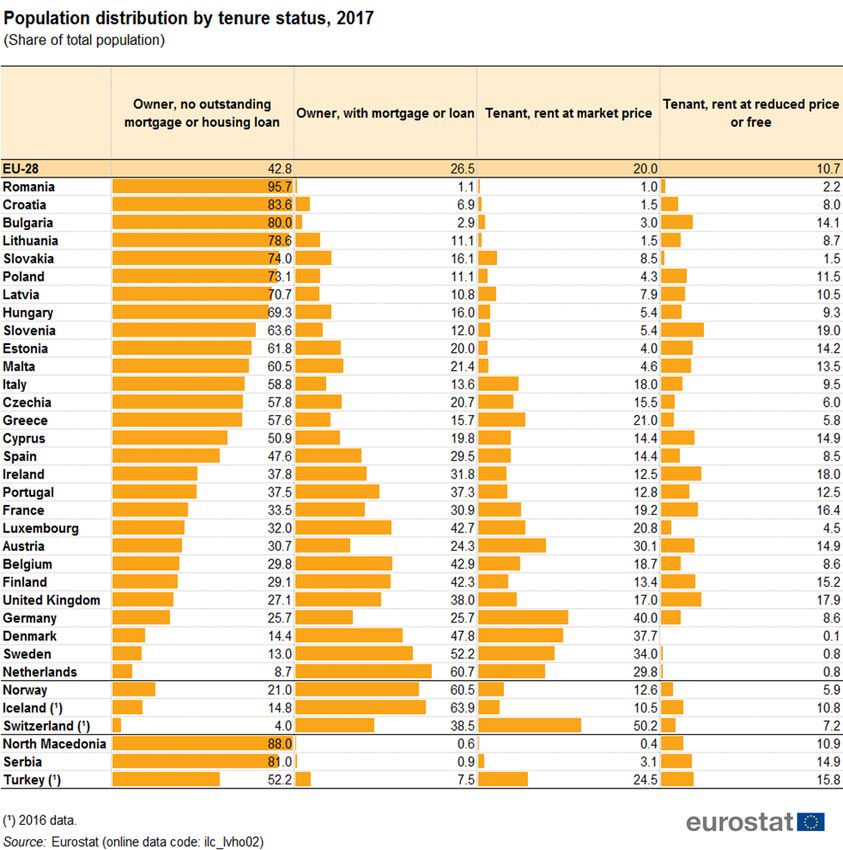
Figure 4: Share of population living in a dwelling with a leaking roof, damp walls, floors or
foundation, or rot in window frames or floor, EU-28, 2007-2017(%)Source: Eurostat (ilc_mdho01)

Among the various structural problems that may be experienced in a dwelling, some 13.3 % of the EU-28
population reported that, in 2017, their home had a leaking roof, damp walls, floors or foundations, or rot in its
window frames or floor. Between 2007 and 2009, the proportion of the EU population that lived in a dwelling
that was affected by at least one of these issues, fell from 18.0 % to 16.0 %. There was a slight increase in 2010
(16.1 % which may be linked to a lack of investment following the global financial and economic crisis), after
which the share of population living in a dwelling with a leaking roof, damp walls, floors or foundation, or rot
in its window frames or floor fluctuated between 15.1 % and 15.7 %, before settling at nearly 2 pp (percentage
points) lower in 2017 (see Figure 4 ).

Nearly 8 % of the EU population was unable to keep their home adequately warm

                                 Living conditions in Europe - housing quality                                  8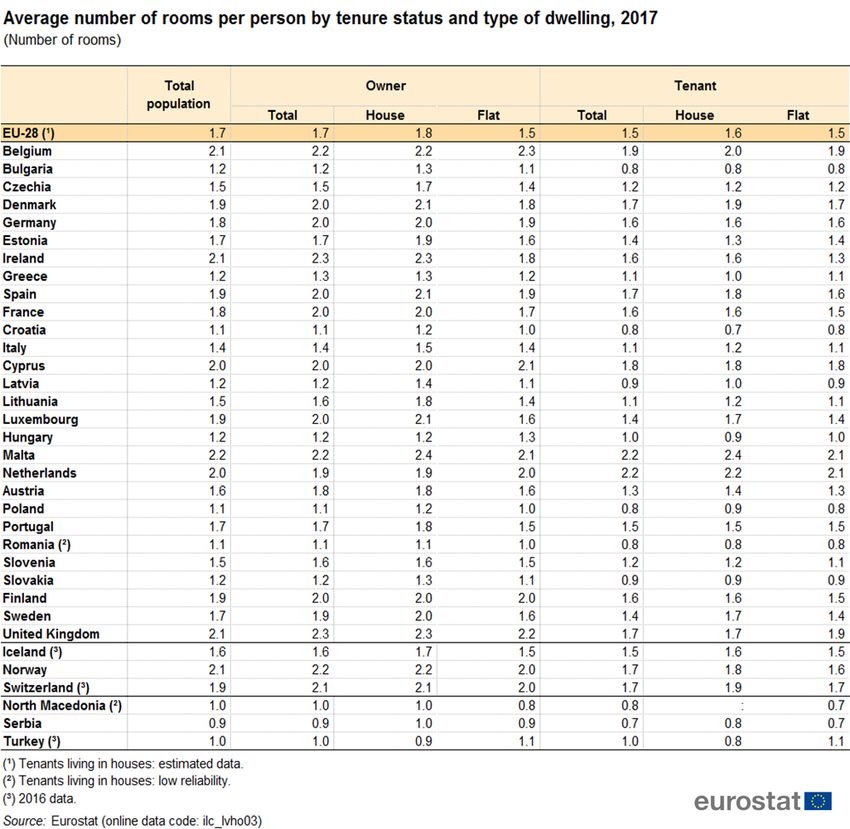
Table 3: Share of population unable to keep home adequately warm by risk of poverty(%)Source:
Eurostat (ilc_mdes01)

Overall, some 7.8 % of the EU-28 population in 2017 could not afford to keep their home adequately warm (see
Table 3 ); this share increased to 18.4 % of the EU-28 population when analysing those individuals who were
at risk of poverty .

In 2017, more than one fifth of the population living in Portugal (20.4 %) and Cyprus (22.9 %) and more
than one quarter of the population living in Greece (25.7 %) and Lithuania (28.9 %) was unable to keep their
home adequately warm; this share peaked in Bulgaria, at 36.5 %.

Among those subpopulations at risk of poverty, the share that could not afford to adequately warm their
home in 2017 was higher than 20.0 % in nine EU Member States, and was particularly high in Lithuania (35.6
%), Portugal (38.9 %), Greece (45.3 %), Cyprus (46.8 %), and Bulgaria (59.5 %).

Energy prices tend to fluctuate far more than the inflation rate and during the period 2011-2013 they rose
significantly. However, from 2014 to 2016, the price of energy fell at quite a rapid pace; followed in 2017 again
by a noteworthy rise. By contrast, the share of the EU-28 population that was unable to keep their home
adequately warm, which peaked in 2012 and 2013, after which it fell at an increasing pace during the period
2014 to 2017.

Living environments
Living conditions are also affected by the quality of the local environment around the residential areas where
people live. Some people express concerns about issues such as noise, pollution, crime, violence or vandalism,
which may impact on their quality of life.

Noise was the most widespread environmental problem for people living in the EU

                                Living conditions in Europe - housing quality                                  9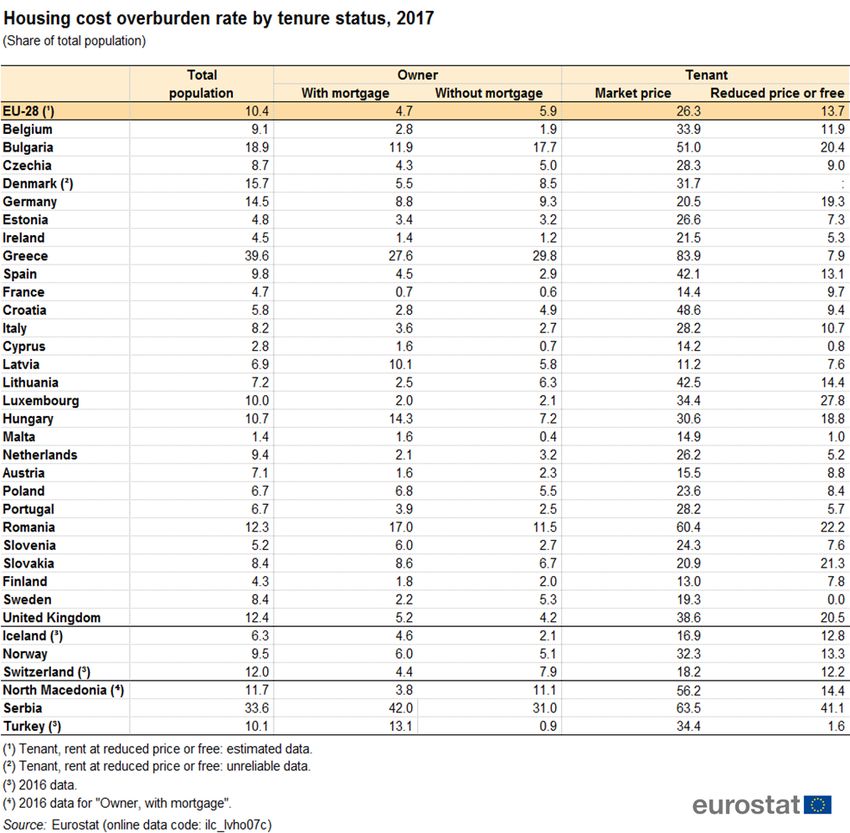
Table 4:    Share of population encountering environmental problems in/around                            their
dwelling(%)Source: Eurostat (ilc_mddw01), (ilc_mddw02) and (ilc_mddw03)

In 2017, noise from neighbours or from the street was the most widespread environmental problem, as reported
by 17.5 % of EU-28 inhabitants. An analysis reveals that the issue of noise was particularly prevalent among
those populations living in Greece, Luxembourg, Portugal, and Malta, where between one quarter and one fifth
of the population complained about noise in the local area where they lived, a share that rose to 25.6 % in the
Netherlands and 26.1 % in Germany (see Table 4 ).

Compared with the other two issues presented in table 4 , noise was the main problem reported in the
majority (16 out of 28) of the EU Member States in 2017. It was, however, more common to find that people in
Estonia, Hungary, Poland, Lithuania, Slovenia, Latvia, Greece and Malta complained about problems relating
topollution, grime or other environmental issues , while in Bulgaria, the United Kingdom and Ireland it was
more common for people to complain aboutcrime, violence or vandalism .

Between 2011 and 2017, the share of the EU-28 population perceiving noise as a problem dropped by 2.2
percentage points (pp). There were reductions of 1.0 (pp) and 2.1 (pp), respectively, in the shares of people
who perceived pollution, grime and other environmental problems to be an issue and the shares of people who
perceived crime, violence or vandalism to be an issue.

Among the EU Member States, it was commonplace to find a reduction in the proportion of people who
claimed their living standards were affected by these three issues during the period 2011-2017.
   • The proportion of people living in Romania and Cyprus who were affected by noise from their neighbours
     or from the street fell at a rapid pace (9.0 pp and 10.6 pp, respectively),
   • The same was true in Cyprus and Malta for people affected by pollution, grime or other environmental
     problems (9.4 pp and 14.6 pp, respectively),
   • In Denmark and Latvia for people affected by crime, violence and vandalism (7.9 pp and 11.0 pp, respec-
     tively).

                                Living conditions in Europe - housing quality                              10
By contrast, during the period 2011 to 2017, an increasing proportion (+7.0, 7.3 and 1.3 pp) of the population
living in Luxembourg was affected by all three of these issues, while there was a relatively large increase in the
share of the population in Lithuania that was affected by crime, violence and vandalism (up 3.4 pp).
Table 5: Share of population encountering environmental problems in/around their dwelling by
risk of poverty, 2017(%)Source: Eurostat (ilc_mddw01), (ilc_mddw02) and (ilc_mddw03)
Table 5 shows that across the EU-28, any of these problems were more likely to be faced by the population
at risk of poverty than by the total population. In 2017, the share of the population affected by noise was 3.3
pp higher for the population living at risk of poverty than for the whole population, while the share of people
living at risk of poverty and affected by crime, violence or vandalism was 2.6 pp higher than the average for
the whole population. The share of people living at risk of poverty and affected by pollution, grime and other
environmental problems was 1.9 pp higher than for the total population.
In 2017, the share of the population at risk of poverty and concerned by noise from neighbours or from the
street was at least 1.6 times as high as the share recorded for the whole population in Ireland, Belgium, Finland
and Denmark. Latvia, Malta, Poland, the United Kingdom, Greece, Croatia and Romania were the only EU
Member States to report that their subpopulations at risk of poverty were less likely to be exposed to noise
than the average recorded for the total population.
In a similar vein, the share of the population at risk of poverty and concerned by pollution, grime or other
environmental problems was at least 1.6 times as high as the share recorded for the whole population in Bel-
gium, the Netherlands, Slovakia and Ireland, while the share of the population at risk of poverty and concerned
by crime, violence or vandalism was at least 1.5 times as high as the share recorded for the total population in
Belgium and Hungary.
Europeans living in urban areas were generally more concerned with noise than those living
Living conditions in Europe - housing quality 11in rural areas.
Figure 5: Share of population reporting noise from neighbours or from the street by degree of
urbanisation, 2017(%)Source: Eurostat (ilc_mddw01) and (ilc_mddw04)
On average, 23.2 % of the EU-28’s population living in cities perceived noise from neighbours or from the street
to be a problem in 2017. The share of the population suffering from noise was lower for those people living in
towns and suburbs (16.6 %) or in rural areas (10.4 %) — see Figure 5 .
Figure 6: Share of population reporting pollution, grime or other environmental problems by
degree of urbanisation, 2017(%)Source: Eurostat (ilc_mddw02) and (ilc_mddw05)
In 2017, pollution, grime and other environmental issues were perceived as problems by 19.4 % of city-dwellers
across the EU-28 and particularly high with over 30% in Greece and Germany (see Figure 6). Such problems
Living conditions in Europe - housing quality 12were less prevalent among the subpopulations living in towns and suburbs (12.9 %) and especially rural areas
(8.1 %).
Figure 7: Crime, violence or vandalism in their area by degree of urbanisation, 2017(Share of
total population)Source: Eurostat (ilc_mddw03) and (ilc_mddw06)
In 2017, almost one in five (18.0 %) persons living in cities across the EU-28 perceived crime, violence or van-
dalism as a problem. This share fell to 9.9 % among the subpopulation that was living in towns and suburbs,
and to 5.8 % for those people living in rural areas (see Figure 7 ).
As such, people living in cities across the EU-28 were, on average, more concerned by all three problems
identified as having an impact on their living conditions and local environment
Among the EU Member States, a similar pattern was observed in 2017, with the following exceptions:
• Noise from neighbours or from the street was most commonly perceived as a problem by the subpopulation
living in towns and suburbs in Slovakia,
• Pollution, grime or other environmental problems were more frequently cited as problems by the subpop-
ulations living in towns and suburbs in Luxembourg, Slovakia, Cyprus and Estonia.
Housing affordability
In 2010, a European Commission Communication, titled the European platform against poverty and social
exclusion: a European framework for social and territorial cohesion (COM(2010) 758 final), addressed the is-
sue of affordable accommodation by declaring that ’access to affordable accommodation is a fundamental need
and right’.That said, housing costs often make up the largest component of expenditure for many households,
thereby potentially leading to deferred or cancelled expenditure, possibly in relation to other basic needs.
Some 10.4 % of the EU-28 population spent 40 % or more of their household disposable in-
come on housing
Living conditions in Europe - housing quality 13Map 2: Housing cost overburden rate, 2017(Share of total population)Source: Eurostat
(ilc_lvho07a)
Housing affordability may be analysed through the housing cost overburden rate, which shows the share of the
population living in households that spend 40 % or more of their disposable income on housing.
The housing cost overburden rate for the EU-28 was 10.4 % in 2017. There were, however, large differences
between the EU Member States, as the lowest rates — less than 6.0 % — were recorded in eight Member States,
with lows of 2.8 % in Cyprus and 1.4 % in Malta (see Map 2 ). By contrast, the housing cost overburden rate
was at least 15.0 % in Denmark and Bulgaria, rising to a peak of 39.6 % in Greece; a high share (33.6 %) was
also recorded in Serbia. These differences may, at least partially, reflect differences in national policies for social
housing or public subsidies and benefits that are provided by governments for housing.
Living conditions in Europe - housing quality 14Table 6: Housing cost overburden rate by risk of poverty, 2011-2017(Share of total population)
Source: Eurostat (ilc_lvho07a)
Having fluctuated between 2011 and 2017, the EU-28’s housing cost overburden rate was 1.0 pp lower at the
end of the period under consideration (see Table 6 ). In 22 of the EU Member States, the housing cost over-
burden rate fell between 2011 and 2017, while there were five Member States where the rate increased and one
where it remained unchanged. The biggest reductions for the housing cost overburden rate were recorded in
Latvia (down 5.6 pp), the Netherlands (-5.1 pp) and the United Kingdom (-4.0 pp). Note the relatively steady
downward pattern to the rates observed in Latvia. The highest increases were recorded in Greece (15.4 pp),
Bulgaria (10.2 pp; note a break in series in 2016) and Luxembourg (5.8 pp; note a break in series in 2016).
Living conditions in Europe - housing quality 15Table 7: Housing cost overburden rate by tenure status, 2017(Share of total population) Source:
Eurostat (ilc_lvho07a) and (ilc_lvho07c)
The share of the population living in households that spent 40 % or more of their disposable income on housing
was significantly greater among EU-28 tenants than it was among homeowners in 2017, as shown in Table 7 .
This was especially the case for tenants living in dwellings with a market price rent, for whom the housing cost
overburden rate was 26.3 %, while it was 4.7 % for homeowners with a mortgage.
The housing cost overburden rate varied considerably across the EU Member States in 2017 when analysed
by tenure status. For tenants living in dwellings with a market price rent, it ranged from a low of 11.2 % in
Latvia up to 60.4 % in Romania and 83.9 % in Greece. For homeowners that had a mortgage, the housing cost
overburden rate ranged from less than 2.0 % in Finland, Austria, Malta, Cyprus, Ireland and France, up to
more than one sixth in Romania, and more than a quarter in Greece.
Living conditions in Europe - housing quality 16Figure 8: Share of population with a housing cost burden over 50 % of disposable income,
2017(%)Source: Eurostat (ilc_lvho28)
Figure 8 provides an alternative analysis, as it focuses on the share of the population that spent more than
half of their disposable income on housing costs. Across the EU-28, close to one in six (15.7 %) tenants liv-
ing in dwellings with a market price rent spent more than half of their disposable income on housing costs in 2017.
The share of tenants living in dwellings with a market price rent that spent more than half of their disposable
income on housing costs was systematically higher than the share for the whole population across all 28 of the
EU Member States. In Greece and Romania, at least 4 out of every 10 tenants living in dwellings with a market
price rent spent more than half of their disposable income on housing costs in 2017.
Household consumption expenditure
National accounts provide information about household consumption expenditure on goods and services; this
information may be analysed according to the classification of individual consumption by purpose (COICOP) ,
where Division 04 covers housing, water, electricity, gas and other fuels.
Living conditions in Europe - housing quality 17Map 3: Average household expenditure on housing, water, electricity, gas and other fuels,
2017(EUR per inhabitant)Source: Eurostat (nama_10_co3_p3)
In 2017, the average amount spent by each inhabitant in the EU-28 on housing-related purposes averaged
EUR 3 900. There were considerable variations between the EU Member States, reflecting differences in both
rental/house prices and utility prices.
In 2017, average expenditure per inhabitant on housing, water, electricity, gas and other fuels ranged from
EUR 900 in Bulgaria and EUR 1 200 in Hungary, up to EUR 6 000 in Finland and EUR 6 700 in Denmark,
reaching a peak of EUR 7 800 in Luxembourg.
In 12 of the 27 EU Member States for which data are available, expenditure per inhabitant on housing-related
items was above the EU-28 average (as denoted by the darker shaded areas in Map 3 ) — most of these
are located in central and northern Europe. By contrast, expenditure was lower than the EU-28 average in
peripheral EU countries.
Living conditions in Europe - housing quality 18Table 8: Share of housing, water, electricity, gas and other fuels in final household consumption
expenditure, EU-28(%)Source: Eurostat (nama_10_co3_p3)
The share of housing, water, electricity, gas and other fuels in EU-28 final household consumption expenditure
was 24.2 % in 2017 (which was slightly higher than 11 years before - see Table 8 ). The highest proportion
was attributed to imputed rentals for housing (12.9 % of final household consumption expenditure), followed
by actual rentals (4.8 %), electricity, gas and other fuels (3.9 %), water supply and related services (1.6 %) and
maintenance and repair for dwellings (0.9 %).
Source data for tables and graphs
• Housing quality: maps, tables and figures
Data sources
The data used in this section are primarily derived from data from EU statistics on income and living conditions
(EU-SILC) . EU-SILC is carried out annually and is the main survey that measures income and living conditions
in Europe, and is the main source of information used to link different aspects relating to the quality of life at
the household and individual level.
The reference population is all private households and their current members residing in the territory of an
EU Member State at the time of data collection; persons living in collective households and in institutions
are generally excluded from the target population. The EU-28 aggregate is a population-weighted average of
individual national figures.
See also
• All articles fromLiving conditions in Europe
• Being young in Europe today
Main tables
• Income and living conditions (t_ilc)
Database
• Income and living conditions (ilc)
• Ad-hoc module on housing conditions
Dedicated section
• Income, social inclusion and living conditions
Living conditions in Europe - housing quality 19Publications
• Analytic report on subjective well-being
• Living conditions in Europe — 2014 edition
• Quality of life — facts and views
Methodology
• Income and living conditions (ESMS metadata file — ilc_esms)
• Main concepts and definitions
Legislation
• Regulation (EC) No 1177/2003 — framework regulation — this is the central piece of legislation which
sets up the whole EU-SILC instrument
• Detailed list of legislative information on EU-SILC provisions for survey design, survey characteristics,
data transmission and ad-hoc modules
External links
• European Commission - Directorate-General for Employment, Social Affairs & Inclusion - Employment
and Social Developments in Europe 2017
• United Nations — Housing and its environment
• WHO — Housing
View this article online at https: // ec. europa. eu/ eurostat/ statistics-explained/ index. php/ Living_
conditions_ in_ Europe_ -_ housing_ quality
Living conditions in Europe - housing quality 20You can also read