Low-Income Energy Affordability: Conclusions from a Literature Review - INFO
←
→
Page content transcription
If your browser does not render page correctly, please read the page content below
ORNL/TM-2019/1150

Low-Income Energy Affordability:
Conclusions from a Literature Review

                           Marilyn A. Brown
                           Anmol Soni
                           Melissa V. Lapsa
                           Katie Southworth

                           Date: March 2020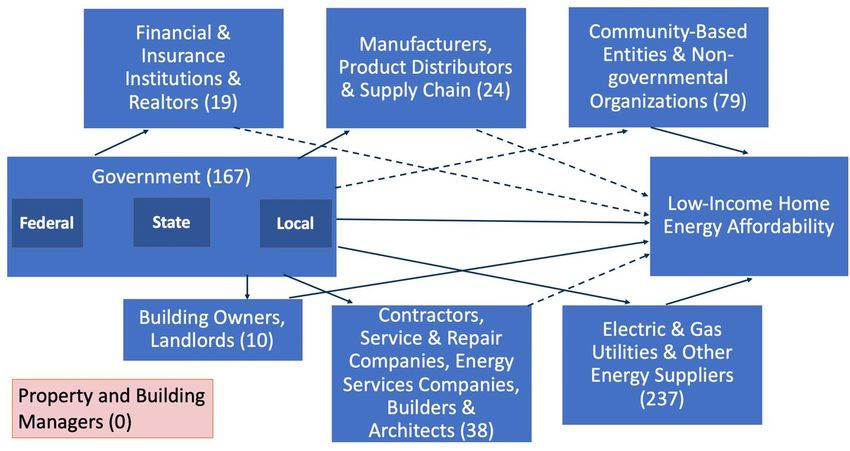
DOCUMENT AVAILABILITY
Reports produced after January 1, 1996, are generally available free via US Department of Energy
(DOE) SciTech Connect.

        Website www.osti.gov

Reports produced before January 1, 1996, may be purchased by members of the public from the
following source:

        National Technical Information Service
        5285 Port Royal Road
        Springfield, VA 22161
        Telephone 703-605-6000 (1-800-553-6847)
        TDD 703-487-4639
        Fax 703-605-6900
        E-mail info@ntis.gov
        Website http://classic.ntis.gov/

Reports are available to DOE employees, DOE contractors, Energy Technology Data Exchange
representatives, and International Nuclear Information System representatives from the following
source:

        Office of Scientific and Technical Information
        PO Box 62
        Oak Ridge, TN 37831
        Telephone 865-576-8401
        Fax 865-576-5728
        E-mail reports@osti.gov
        Website http://www.osti.gov/contact.html

             This report was prepared as an account of work sponsored by an
             agency of the United States Government. Neither the United States
             Government nor any agency thereof, nor any of their employees, makes
             any warranty, express or implied, or assumes any legal liability or
             responsibility for the accuracy, completeness, or usefulness of any
             information, apparatus, product, or process disclosed, or represents that
             its use would not infringe privately owned rights. Reference herein to
             any specific commercial product, process, or service by trade name,
             trademark, manufacturer, or otherwise, does not necessarily constitute
             or imply its endorsement, recommendation, or favoring by the United
             States Government or any agency thereof. The views and opinions of
             authors expressed herein do not necessarily state or reflect those of the
             United States Government or any agency thereof.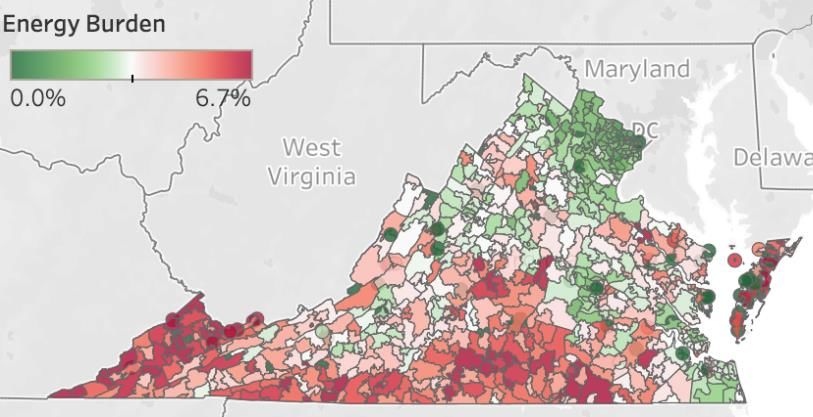
ORNL/TM-2019/1150

       Energy & Transportation Science Division

  LOW-INCOME ENERGY AFFORDABILITY:
CONCLUSIONS FROM A LITERATURE REVIEW

   Marilyn A. Brown, Georgia Institute of Technology
   Anmol Soni, Georgia Institute of Technology
  Melissa V. Lapsa, Oak Ridge National Laboratory
                 Katie Southworth

             Date Published: March 2020

                    Prepared by
      OAK RIDGE NATIONAL LABORATORY
            Oak Ridge, TN 37831-6283
                    managed by
               UT-BATTELLE, LLC
                       for the
         US DEPARTMENT OF ENERGY
        under contract DE-AC05-00OR22725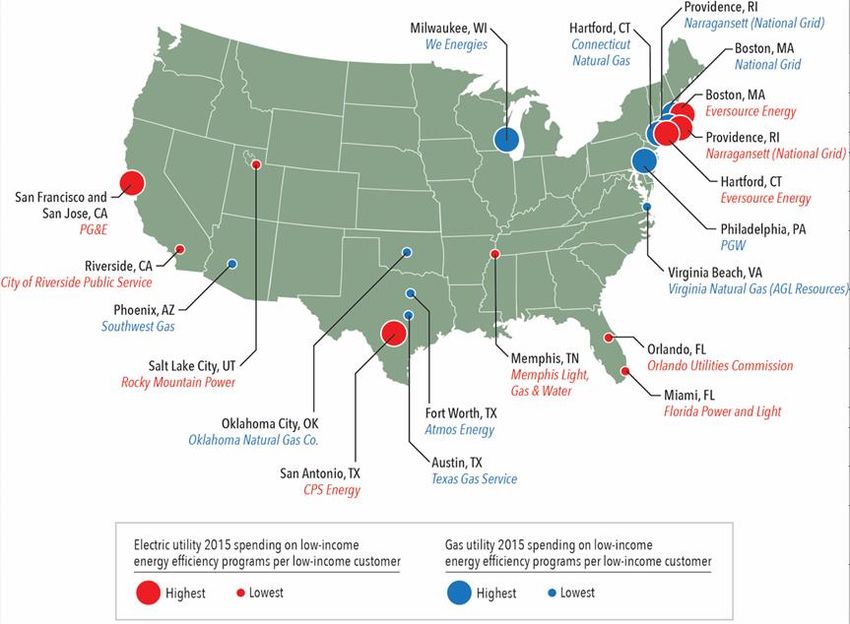
CONTENTS

CONTENTS................................................................................................................................................... i
ACRONYMS ............................................................................................................................................... iii
ACKNOWLEDGMENT............................................................................................................................... v
ABSTRACT ................................................................................................................................................ vii
1. INTRODUCTION: GOALS, SCOPE, AND STRUCTURE OF LITERATURE REVIEW ............... 1
   1.1 GOALS OF THE LITERATURE REVIEW .............................................................................. 1
   1.2 THE ENERGY EQUITY LENS ................................................................................................. 2
        1.2.1 Procedural Equity (Inclusion) ........................................................................................ 3
        1.2.2 Distributive Equity (Access) .......................................................................................... 3
        1.2.3 Intergenerational Equity................................................................................................. 4
   1.3 THE CONTEXT: MULTIPLE STAKEHOLDERS IN THE LOW-INCOME HOUSING
        MARKET.................................................................................................................................... 4
   1.4 SCOPE AND STRUCTURE OF LITERATURE REVIEW ...................................................... 4
2. ENERGY BURDEN OF LOW-INCOME HOUSEHOLDS ................................................................ 7
   2.1 MEASURING THE EXTENT OF THE BURDEN ................................................................... 7
        2.1.1 Variable and Inconsistent Definitions ............................................................................ 7
        2.1.2 Magnitudes, Distributions, and Trends .......................................................................... 9
   2.2 CAUSES OF HIGH ENERGY BURDEN ................................................................................ 11
   2.3 EFFECTS OF HIGH ENERGY BURDEN .............................................................................. 14
3. THE ECOSYSTEM OF LOW-INCOME ENERGY PROGRAMS AND POLICIES ...................... 17
   3.1 TYPES OF PROGRAMS AND LEVELS OF EXPENDITURE ............................................. 17
   3.2 ELECTRIC AND GAS UTILITY PROGRAMS AND POLICIES ......................................... 21
        3.2.1 Integrated Resource Planning, Goal Setting, and Cost-Effectiveness Tests ................ 24
        3.2.2 Residential On-Bill Program Designs .......................................................................... 24
        3.2.3 Round-Up Assistance Programs .................................................................................. 25
        3.2.4 Prepaid Electric Services ............................................................................................. 26
        3.2.5 Payment Plans .............................................................................................................. 27
        3.2.6 Disconnection Alternatives .......................................................................................... 27
   3.3 FEDERAL PROGRAMS AND POLICIES ............................................................................. 28
        3.3.1 DOE Weatherization Assistance .................................................................................. 28
        3.3.2 LIHEAP Bill Assistance .............................................................................................. 30
        3.3.3 Other Federal Programs and Policies ........................................................................... 31
   3.4 STATE PROGRAMS AND POLICIES ................................................................................... 31
        3.4.1 Minimum Requirements for Low-Income Energy Programs ...................................... 32
        3.4.2 Adders to Cost-Effectiveness Tests for Low-Income Energy Programs ..................... 33
   3.5 LOCAL GOVERNMENT, COMMUNITY-BASED, NGO, AND PRIVATELY
        FUNDED PROGRAMS ........................................................................................................... 34
4. THE IMPACTS AND COST-EFFECTIVENESS OF LOW-INCOME ENERGY
   PROGRAMS AND POLICIES .......................................................................................................... 37
   4.1 ESTIMATES OF COSTS, BENEFITS, AND COST EFFECTIVENESS ............................... 37
        4.1.1 Electric and Gas Utility Low-Income Programs .......................................................... 37
        4.1.2 DOE Weatherization Assistance Program ................................................................... 38
        4.1.3 State Green Building Policies ...................................................................................... 39
        4.1.4 Community Partnerships .............................................................................................. 40
   4.2 UNDER-SERVED LOW-INCOME COHORTS ..................................................................... 40
        4.2.1 Multifamily and Rental Markets .................................................................................. 40
        4.2.2 Rural America, Island Territories, and Indian Reservations ........................................ 41

                                                                             i
4.2.3 Manufactured and Mobile Homes................................................................................ 42
     4.3 TECHNOLOGIES AND MEASURES INSTALLED ............................................................. 43
     4.4 THE ENERGY SAVING POTENTIAL OF LOW-INCOME HOUSHOLDS IN THE
         U.S. ........................................................................................................................................... 44
5.   PROMISING PRACTICES ................................................................................................................ 45
     5.1 SOLAR ENERGY FOR LOW-INCOME HOUSEHOLDS ..................................................... 45
         5.1.1 Rooftop Solar Programs ............................................................................................... 47
         5.1.2 Community Solar Programs ......................................................................................... 49
     5.2 LEVERAGING THE HEALTHCARE BENEFITS OF ENERGY-EFFICIENT
         HOUSING ................................................................................................................................ 50
     5.3 BEHAVIORAL ECONOMICS AND SOCIAL SCIENCE APPROACHES ........................... 51
     5.4 DATA ANALYTICS ................................................................................................................ 53
     5.5 ADVANCED INFORMATION AND COMMUNICATION TECHNOLOGIES (ICT) ........ 54
     5.6 GRID RESILIENCY ................................................................................................................ 56
6.   CONCLUSIONS ................................................................................................................................ 57
     6.1 IMPROVING ENERGY EQUITY THROUGH PROGRAM DESIGN AND
         IMPLEMENTATION ............................................................................................................... 57
     6.2 SCALING IMPACTS WITH LEVERAGING, PARTNERSHIPS, AND PROGRAM
         INTEGRATION ....................................................................................................................... 59
7.   REFERENCES ................................................................................................................................... 61

                                                                           ii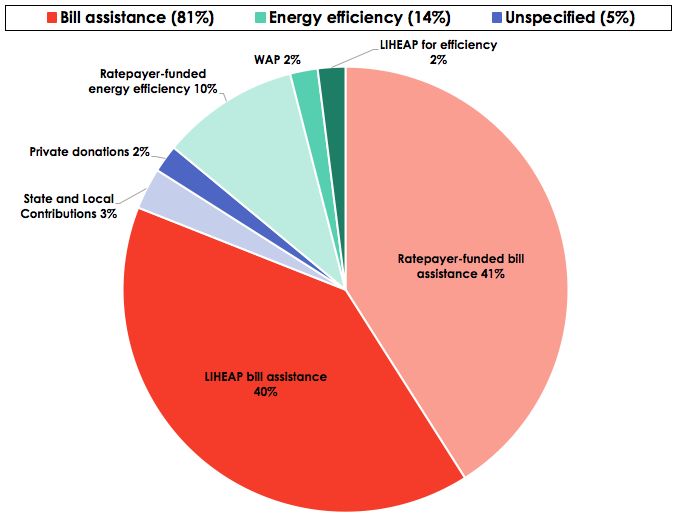
ACRONYMS

AMI      Area Median Income
ARRA     American Recovery and Reinvestment Act
CDC      Center for Disease Control
DOE      U.S. Department of Energy
EECLP    Energy Efficiency and Conservation Loan Program
EIA      U.S. Energy Information Administration
EPA      U.S. Environmental Protection Agency
EV       Electric Vehicles
FERC     Federal Energy Regulatory Commission
FPL      Federal Poverty Level
HHS      U.S. Department of Health and Human Services
HUD      U.S. Department of Housing and Urban Development
IRP      Integrated Resource Plan
LIHEAP   Low Income Home Energy Assistance Program
LIHTA    Low-Income Housing Tax Credit Program
MSA      Metropolitan Statistical Area
MOU      Memorandum of Understanding
NASCSP   National Association of State Community Services Programs
NGO      Non-governmental organization
NCHH     National Center for Healthy Housing
NREL     National Renewable Energy Laboratory
ORNL     Oak Ridge National Laboratory
RECS     Residential Energy Consumption Survey
RGGI     Regional Greenhouse Gas Initiative
SDG      Sustainable Cities and Communities
SEP      State Energy Program
SMI      State Median Income
SPM      Supplemental Poverty Measure
UNDP     U.S. Development Program
USDA     U.S. Department of Agriculture
TVA      Tennessee Valley Authority
WAP      Weatherization Assistance Program

                                iii
iv
ACKNOWLEDGMENT

Funding for this research was provided by the U.S. Department of Energy (DOE) and the Brook
Byers Institute for Sustainable Systems at the Georgia Institute of Technology. We are grateful
for the valuable insights and review comments provided by Pam Mendelson, Michael DiRamio,
Annamaria Garcia, Erica Burrin, Anna Ebers, Michael Reiner, and Derek Schroeder (U.S.
Department of Energy), Mark Ternes (Oak Ridge National Laboratory), Matt Cox, Greenlink
Anayltics, Ariel Drehobl (American Council for an Energy Efficient Economy), Meg Power
(Economic Opportunity Studies), and Erin Rose (Three Cubed). In addition, the authors
acknowledge Beril Toktay and Michael Oxman who co-led research on energy burdens in
Atlanta, Georgia – in partnership with Suzanne Burnes (Collective Wisdom Group) and Sabrina
Cowden (Milepost Consulting) and with funding from Georgia Tech’s Energy Policy and
Innovation Center – which set the stage for this review. Valuable assistance with the completion
of this report was provided by Charlotte Franchuk (Data Support Services), and Ranal Tudawe
and Majid Ahmadi (Georgia Tech). Any remaining errors are the sole responsibility of the
authors.

                                                v
vi
ABSTRACT

This paper examines the persistent problem of high energy burdens among low-income
households, based on a review of more than 180 publications that pointed to several promising
opportunities to address energy affordability including inclusive solar programs, leveraged health
care benefits, and behavioral economics. using an equity and affordability lens. Even after
decades of weatherization and bill-payment programs, low-income households, on average,
continue to spend a higher share of their income on electricity and natural gas bills than any
other income group. Energy burden for low-income households is not declining, and it remains
persistently high, particularly in the South, in rural America, among minority households, and
those with children and elderly residents. On a per household basis, utility companies spend less
on energy-efficiency programs for low-income households than for other income groups. In
addition, government and utility programs that promote rooftop solar power, electric vehicles,
and home energy storage are largely inaccessible to low-income households. Our review
identifies promising opportunities to address energy affordability including inclusive solar
programs, leveraged health care benefits, behavioral economics, data analytics, advanced
information and communication technologies, and grid resiliency. Scalable approaches require
linking implementing agencies, programs and policies to tackle the complex web of causes and
impacts on low-income households with high energy burdens.

                                               vii
viii
1.    INTRODUCTION: GOALS, SCOPE, AND STRUCTURE OF LITERATURE REVIEW

1.1        GOALS OF THE LITERATURE REVIEW

Energy drives the U.S. economy and impacts nearly every dimension of modern society; it is an
imperative of daily existence. When access to energy becomes difficult, the burden is felt in
every facet of life – housing, mobility, health, work, education, and much more.

Since the 1970’s introduction of major low-income energy programs in the U.S., the nature of
household energy consumption has evolved. For decades, the energy consumed by a typical
household increased as suburbanization and sprawl enabled homes to grow, and affluence and
innovation made central heating and cooling systems almost universal. Appliances multiplied,
and “plug loads” proliferated with the creation of new low-voltage AC devices: computers,
telephones, hi-fi’s and more (Nordman and Sanchez, 2006). In contrast, low-income households
continued to occupy much of the energy inefficient housing stock in the older core of American
cities.

Over time, these trends have evolved. Increasingly congested urban areas have motivated moves
back to inner cities, re-densifying and gentrifying older neighbourhoods, sometimes at the
expense of affordable housing. This has created a new geography of suburban poverty with
issues of energy affordability that have not yet been documented. At the same time, many low-
income households in rural communities have chosen to maintain their social networks and ways
of life, and have not moved to urban areas where jobs and property values have been growing
more rapidly. In rural areas where the economy has been stagnant and the housing stock is older,
low-income energy burdens are worsening.

Nationwide, innovations continued to transform home energy use, with more efficient appliances
(furnaces and heat pumps, refrigerators, etc.), smart thermostats, solid state lighting, low-
emissivity windows, and foam insulation – reducing the energy consumed by individual
households. Rooftop solar panels have reached “grid parity” in some parts of the U.S.1, and soon
home energy storage systems and electric vehicles (EVs) will enable households to arbitrage
their energy assets.

In the midst of these transformations, it is time to review what we know about the energy burden
of low-income households:

       •    How have low-income energy burdens changed over the past decade?
       •    How have they been affected by energy programs, policies, and technology trends?
       •    What opportunities offer the greatest promise to reduce the energy burden of low-income
            households, as the U.S. continues its transition to a more efficient and renewable energy
            system?

To answer these questions, we summarize the knowledge embodied in the last decade of
literature focused on low-income energy burdens in the U.S. Many entities across the U.S. –
chiefly utilities and federal and state agencies, but also nonprofits and religious organizations, as
well as cities and community organizations – work to save energy and reduce the energy costs of

1   https://www.greentechmedia.com/articles/read/gtm-research-20-us-states-at-grid-parity-for-residential-solar#gs.7enug2

                                                                 1
low-income households. As a result, a substantial body of literature has examined the design and
impacts of these programs and policies. Other research has produced energy-focused case studies
of low-income communities, surveys of the energy behavior of low-income households, and
accounts of energy bills in the overall expenditures of low-income households. With the
proliferation of information on the internet, this decade of literature is immense. Our literature
search methodology is described in Section 1.3.
This paper begins by characterizing the magnitude, causes, and impacts of the energy burden
currently experienced by low-income households in the U.S. It then describes the multiplicity of
energy programs and policies that impact low-income energy burdens. Program design,
implementation, participation rates, and investment levels are described in Section 3. This is
followed by a summary of the cost-effectiveness and impacts of the programs, which enables
estimates of the remaining potential in Section 4. Attention then turns to identifying major gaps
and opportunities that energy programs and policies could address in the future (Section 5), and
we end with conclusions about opportunities to scale up these impacts.
1.2 THE ENERGY EQUITY LENS
Increasingly energy scholars are focusing on the importance of equity in the transition to a
smarter and greener energy economy. The rapid uptake of new technologies has the potential to
benefit some and harm others, to the extent that resources, jobs, and capital are redistributed.
Depending on the sources and distribution of financing, the design of policies and programs, and
the location of infrastructure and facility investments, low-income households may benefit or
lose going forward. And if low-income households “lose,” all households lose, because there will
be negative effects for all Americans if segments of society are left behind. Overall, the U.S. is
experiencing a growing wealth disparity between low-income households and more affluent
Americans (Curti, Andersen, and Wright, 2018). Living in communities of color, indigenous
populations, and immigrants typically means more limited access to resources. This intersection
of race, ethnicity, and class needs to be considered when designing effective low-income energy
programs and policies (Reames, 2016; Sunter, Castellanos, and Kammen, 2019).
The environmental justice community has highlighted equity issues in the debate about
environmental externalities from the consumption of energy. Due to their lower per capita energy
consumption, low-income households contribute proportionately less to local and global air
pollution. At the same time, they tend to suffer disproportionately more from the impacts of poor
air quality (National Research Council, 2010a, b). These past trends highlight the possibility that
the transition to increasing use of renewable energy underway for many states and communities
could cause energy justice to unfold in similarly inequitable ways because of long-standing and
uneven power dynamics (Healy and Barry, 2017). Equity is increasingly being considered in
discussions of energy program design (Curti et al., 2018; Massetti et al., 2017). The literature on
environmental equity concerns have enumerated energy policy linkages to health outcomes,
access to cleaner air, transportation and other public services which contribute to households’
overall well-being (Jenkins et al., 2016; Massetti et al., 2017). In addition, researchers also
recognize that policies to decarbonize the energy sector, can, in fact, worsen disparities due to
their disproportionate effects on economically weaker segments of society (Monyei et al., 2019).
Formal discussions of equity typically distinguish between procedural equity that deals with
“inclusion” and distributive equity that deals with “access” (Curti et al., 2018). In addition, this
2paper also considers intergenerational equity as an important dimension of energy affordability.
Each of these dimensions is discussed below in the context of low-income energy programs.
Additional dimensions often refer to redistributive equity (fairness in the punishment of wrongs),
structural equity (prevention of the chronic, cumulative disadvantage experienced by
subordinated groups), and transgenerational equity (avoidance of unfair burdens on future
generations) (Franklin and Osborne, 2017).
1.2.1 Procedural Equity (Inclusion)
Procedural equity is the idea of fairness and transparency of the processes that allocate resources
and adjudicate disputes. Connected to the desire for due process, one aspect of procedural equity
is related to administrative and legal proceedings. In some instances, courts of law have
demanded an equitable distribution of resources. As one example, a court settlement of an EPA
case against the Tennessee Valley Authority involving air pollution violations involved the
creation of an energy-efficiency program for low-income customers.2 The idea of procedural
equity can also be applied to non-legal contexts in which some process is employed to resolve
conflict or divide benefits or burdens. Others emphasize “inclusion” as a key component of
procedural equity: “inclusive, accessible, authentic engagement and representation in the process
to develop or implement programs or policies” (Curti et al., 2018, p. 9).
Economically disadvantaged communities across the country are amplifying their voices to
ensure that the transition to increasing use of energy efficiency and renewable energy considers
their needs. For example, Goldberg and McKibbin (2018) describe how the Future Energy Jobs
Act in Illinois materialized with the help of a coalition of interest groups, increasing investment
in energy efficiency and targeting economically disadvantaged communities. Similarly,
advocates from the environmental, affordable housing, energy, and low-income communities in
Pennsylvania organized a collaborative advocacy that drove improvements to low-income
energy-efficiency policy across the State. Their work drew on the skills, expertise, and resources
of multiple disciplines, and prioritized the multiple benefits that energy efficiency provides for
low-income households (Grevatt et al., 2018).
1.2.2 Distributive Equity (Access)
Distributive equity refers to fairness in the distribution of rights or resources. In his Theory of
Justice, John Rawls (1971) claims that one's place of birth, social status, and family influences
are matters of luck that should not unduly influence the amount of benefits we receive in life.
The goal of distributive equity is to limit the influence of luck so that goods are distributed more
fairly and to everyone's advantage. This line of reasoning has been extended by many to argue
that distributive equity is achieved when programs and policies result in fair distributions of
benefits and burdens across all segments of a community, prioritizing those with highest need
(Curti et al., 2018, p. 9).
Across the country, energy-efficiency programs, special rates for electric vehicles, and net
metering of solar rooftop installations are paid for in part with low-income ratepayer funds, but
do not provide commensurate benefits to low-income ratepayers who do not have the resources
to take advantage of these programs. If the energy industry, government agencies, NGOs and
2https://www.tva.gov/file_source/TVA/Site%20Content/Environment/Environmental%20Stewardship/Air%20Quality/EPA%20
Mitigation%20Projects/Smart%20Communities%20-%20Extreme%20Energy%20Makeovers%20FAQ.pdf
3nonprofits do not address these unintentional consequences, low-income households will
continue to suffer disproportionately from high energy burdens, failing most tests of distributive
equity (Chant and Huessy, 2018). Carley et al. (2018) also draw the same conclusion based on
their assessment of disparities in vulnerability across U.S. counties using the renewable portfolio
standard.
1.2.3 Intergenerational Equity
Intergenerational equity adds a time dimension to the equity discussion by considering
community obligations to future generations. Actions that serve to increase rather than limit the
development options of future generations can be said to improve intergenerational equity
(Norton, 2005). In the field of clean energy, intergenerational equity frequently involves
deliberating which aspects of the present should be maintained or changed for future generations.
Most energy efficiency and renewable energy programs reduce CO2 emissions and, as a result,
contribute positively to intergenerational equity in some ways. How these programs may impact
the social and economic contours of communities across generations has received much less
emphasis.
1.3 THE CONTEXT: MULTIPLE STAKEHOLDERS IN THE LOW-INCOME HOUSING
MARKET
Numerous decision-makers and stakeholders influence the energy efficiency and renewable
energy consumption of low-income housing (Figure 1.1). This highly fragmented affordable
housing market challenges efforts to improve low-income energy affordability. Government
agencies have administrative and regulatory roles that influence each of these stakeholders to
varying degrees. In terms of word counts, energy utilities are mentioned most often in the
abstracts of the 183 publications examined in this review. Local non-governmental organizations
(NGOs) and community-based groups are also key stakeholders based on this tally. At the other
extreme, the terms “building manager” and “property manager” do not appear in the 183
abstracts, and “landlord” and “property owner” are mentioned only 10 times, indicating that
these stakeholders have received limited analysis in this body of literature. While the literature
describes the landlord/tenant split incentive and the difference between renter and homeowner
investments in energy-efficiency, there is little analysis of the nature of landlords operating in the
low-income housing market, despite our assessment of the influential roles they play. Figure 1.1
provides a framework for understanding how current programs and policies operate and how
they can be leveraged to provide a more effective and coordinated system of assistance.
1.4 SCOPE AND STRUCTURE OF LITERATURE REVIEW
A search of the peer reviewed published literature was conducted along with a search of the grey
literature of more informal materials. For the peer reviewed literature, the Web of Science
bibliography was searched. The Web of Science is a service provided by Thomson Reuters and
Clarivate Analytics. The service curates and compiles databases on citations for several
academic disciplines. The aggregate citation and publication data can then be used in performing
comprehensive literature searches and analyzing the search outcomes.
4Figure 1.1. The array of stakeholders in the fragmented low-income housing market.
(Source: Authors)
Note: Numbers in parentheses are the frequency that stakeholders are mentioned in the abstracts of 183 publications
examined for this review. Solid and dashed lines represent strong and weak connections, respectively.
A search protocol was established using a syntax of keywords that included synonyms of three
attributes: (1) poverty and low-income households, (2) energy efficiency and solar energy, and
(3) evaluation and data analysis. All three dimensions were required. In addition, at least one
author had to be from the U.S., and the papers had to be published in the 2010-2019 timeframe.
The resulting 270 peer-reviewed publications were “culled” for out-of-scope citations and also
“mined” for additional references as the citations embedded in the original 270 publications were
examined. This process produced a curated set of 171 publications. Several seminal references
published earlier than 2010 are also cited in this report.
A Delphi approach to ensure consideration of the associated grey literature – including
conference proceedings, trade association documents, and workshop presentations. In some
instances, for instance, technology, program implementation, and policy innovations are so
recent that the published literature has not yet addressed them.
The technology scope of this review is broad. Energy efficiency is a core technology of interest,
referring to technologies, materials, and practices that require less energy to deliver a given
service, such as heat, light, and warm water (Brown and Wang, 2015). Solar photovoltaic
systems are also included in the technology scope, as well as electric vehicles, home storage, and
microgrids because they too, can help to reduce energy burdens.
To manage and archive this vast information resource, an annotated bibliography of the literature
reviewed in this paper is also available (Lapsa, Brown, and Soni, 2020).
5While the scope is national, the review also highlights how geography, race, ethnicity, culture,
health, and age create unique circumstances. Cities, suburbs, rural areas, island territories, and
Indian reservations all offer different challenges and solutions. Low-income families with
children and the elderly and disabled have different needs for energy and face different
challenges to reduce their utility bills. Nevertheless, principles associated with successful
programs and policies do emerge. In each section, we also summarize the key findings based on
the dominant view in the literature that we examine. These findings are then summarized and
organized into conclusions in Section 6, based on common themes and the preponderance of
evidence from the literature review.
62. ENERGY BURDEN OF LOW-INCOME HOUSEHOLDS
Low-income households in the U.S. are diverse, as are their patterns of energy consumption. In
this section, we describe alternative measures of energy burden, the energy consumption patterns
of low-income households, how these patterns have changed over the past decade, and the causes
and effects of high energy burden among low-income households.
2.1 MEASURING THE EXTENT OF THE BURDEN
To understand low-income energy burdens, it is important to examine the metrics used by
analysts to characterize the energy consumption patterns of low-income households.
2.1.1 Variable and Inconsistent Definitions
Finding: Variable and inconsistent definitions and metrics are used to describe the energy
consumption patterns of low-income households. The extent and nature of energy
burden, and the estimated impact and value of solutions, depend upon the metrics used.
The term “household energy burden” has become a dominant construct used by analysts working
on low-income energy issues in the U.S. Early and subsequent research conducted for DOE by
Oak Ridge National Laboratory (ORNL) (Eisenberg, 2014) and Economic Opportunity Studies,
Inc (Power, 2008) used energy burden as a means to characterize the U.S. population in need and
to inform program and policy. The term is generally defined as the share of a household’s
income that is spent on energy utilities (Drehobl and Ross, 2016). There are two parts to this
definition – the numerator provides a measure of energy expenditure by the households,
reflecting energy consumption and rates; the denominator is a measure of household income or
budget.
Household energy expenditure is usually measured by looking at the total spending on household
utility bills for heating, cooling, and other home energy services (Berry, Hronis, and Woodward,
2018). Most energy burden studies do not analyze household spending on transportation energy.
Household income or budget is also measured in a variety of ways, using different benchmarks.
These include, the Federal Poverty Level (FPL), State Median Income (SMI), Area Median
Income (AMI), and household budgets. The Supplemental Poverty Measure (SPM)3 conducted
by the Census Bureau measures household income after including different sources of financial
support. Accounting for households that receive different support payments and reducing them
from the household income levels increases the level of poverty across most categories. The
income benchmarks used to qualify households for different energy assistance programs can
influence the program’s energy savings (Hoffman, 2017).
In fiscal year (FY) 2014 (October 1, 2013-September 30, 2014), the average annual weather-
normalized expenditure for low-income households (at or below 200% of the federal poverty
level) was estimated to be $1,851 (Eisenberg, 2014, p. 10). About 39% of this ($721) was
estimated to be for primary heating and cooling expenses. Based on the same source, non-low-
income households spent $2,284 on residential energy in FY 2014, with $906 (40%) spent for
primary heating and cooling. Based on the 2009 Residential Energy Consumption Survey
3 https://www.census.gov/prod/2012pubs/p60-244.pdf
7(RECS) and inflation adjustments, the average income of low-income households in FY 2014,
was estimated to be $18,773 compared to $71,755 for non-low-income households. The resulting
household energy burdens were estimated to be 16.3% for low-income households compared to
3.5% for non-low-income households (Eisenberg, 2014, p. 10).
Figure 2.1. Scope of energy burden and related definitions.
(Source: Authors)
Based on household energy burden, Colton (2011) defines “energy poor households” as those
spending more than 6% of their income on meeting energy costs. The premise for this
benchmark is that a household should not spend more than 30% of its income on housing
expenses, and the utility costs should not exceed 20% of these expenses. This threshold is often
used for comparison purposes and to estimate the “affordability gap” (Fisher, Sheehan, and
Colton, 2013). A range of thresholds has also been developed. In a study for the State of
Colorado, Cook and Shah (2018a) distinguished between “energy stressed” households with
energy burdens of 4-7%, “energy burdened” households with 7-10% energy burdens, and
“energy impoverished” households with energy burdens greater than 10%.
A second construct – “energy insecurity” – refers to the uncertainty that a household might face
in being able to make utility bill payments (Berry et al., 2018), which can ultimately result in
being disconnected from energy services either permanently or temporarily (Verclas and Hsieh,
2018). Elnakat, Gomez, and Booth (2016) and Ross, Jarrett, and York (2016) document that the
incidence of energy security varies by region with the highest rates in the South.
In contrast, the term “energy poverty” generally refers to living in a home that does not have
access to enough energy to meet their essential needs. More functionally, it is described by the
U.N. Development Program (UNDP, 2005) as the “inability to cook with modern cooking fuels
and the lack of a bare minimum of electric lighting to read or for other household and productive
activities at sunset.” Modern energy services are crucial to human well-being. About half a
million Americans live without access to basic electricity services, and a majority of these
households reside in U.S. territories or on American Indian reservations (Begay, 2018b; EIA,
2000).
8In the international literature, “energy access” is a common term, and is recognized in the
Sustainable Development Goals adopted by the United Nations in 2015. Further, the first target
of the Sustainable Cities and Communities Goal (SDG 11) is access to adequate and affordable
housing with basic services, which includes affordable utilities. SDG 7 aims to ensure access to
affordable, reliable, sustainable and modern energy to all by 2030. Affordability and reliability
are both critical components of energy burden analysis in the U.S. context, where high levels of
access to energy exist as compared to other countries, but many groups face high energy
burdens. SDGs were adopted in 2015 at the U.N. Sustainable Development Summit in New
York. The SDGs are a continuation of the global pursuit of sustainable development which was
first recognized in the 1992 Earth Summit in Rio de Janeiro through the Adoption of Agenda
21.4
In sum, multiple definitions are used to discuss low-income energy burdens, to qualify
households for assistance in different programs, and to estimate the potential for future energy
bill reductions (Hoffman, 2017). This is problematic because the extent and nature of the energy
burden problem depends on the definition used (Figure 2.1).
• The problem of energy burden and vulnerability is more widespread when measured by a
combination of indicators (Lin, 2018b), such as income poverty combined with hardship
making bill payments (Berry et al., 2018).
• GIS mapping documents that using different definitions can lead to higher or lower
estimates of energy burden in different types of regions; while income and energy
poverty are highly correlated, the problem of high energy burden among the income poor
is more pronounced for those living in rural areas (Lin, 2018b).
• Using a range of definitions of income and spatial densities to provide estimates of
potential savings, Hoffman (2017) demonstrates that total savings and their distribution
can vary greatly based on the definition of low-income households and communities.
2.1.2 Magnitudes, Distributions, and Trends
Finding: Energy burden is higher among low-income households than other income groups. The
average energy burden of low-income households is not declining, and it continues to
be high in particular geographies and socio-economic groups. Low-income households
spend a higher proportion of their income on energy bills than any other income group
(Eisenberg, 2014; Berry et al., 2018), spending on average three times more of their
income on energy bills than higher income households (Drehobl and Ross, 2016). This
is true, even though low-income households consume less energy per capita than other
households. Evidence indicates that participants in the Weatherization Assistance
Program (WAP) managed by the U.S. Department of Energy (DOE) have even higher
energy burdens (Eisenberg, 2014). These high burdens were strong motivators to apply
for services: 43% of respondents in one study reported this as a motivating factor (Rose
et al., 2015, p. 22). This is consistent with the finding by Tonn, Rose, and Hawkins
(2015, p. 5) that prior to weatherization, 65% of survey respondents reported that it was
hard or very hard to pay for energy bills, while post-weatherization, the percentage
dropped to 49%.
4 https://sustainabledevelopment.un.org/outcomedocuments/agenda21
9High energy burdens produce energy insecurity. Residential Energy Consumption Survey
(RECS) data for 2015 indicate that 31% of all U.S. households experienced some form of energy
insecurity – often foregoing food and medicine in order to pay an energy bill. These rates were
particularly high in mobile homes (58%) and in apartments in buildings with 2-4 units (46%)
(Berry et al., 2018). In 2015, nearly seven million households had their access to heat interrupted
at least once, and six million lost access to air conditioning at least once (Verclas and Hsieh,
2018).
Energy security is significantly more problematic for low-income households. Based on a
national survey in 2015, 40% of households with income below $50,000 find it difficult to pay
their energy bills at least “once in a while”.5 In 2017, one-third of consumers with household
incomes of less than $50,000 had trouble paying their electric or heating bills at least sometimes,
7% more than in 2016, despite the stronger economy (Treadway, 2018). Utility disconnections
are difficult to track because most states do not require utilities to record these numbers.
However, there is an exception in some states where utilities file these numbers with the Public
Utility Commissions (Verclas and Hsieh, 2018). The number of disconnections appears to be
increasing in at least two states. In Texas, the number of recorded disconnections increased by
64% between 2010 and 2016, and in California, the numbers tripled between 2006 and 2016
(Verclas and Hsieh, 2018). The authors further note that low-income households (with incomes
less than $20,000) were almost three times as likely to face energy insecurity as households with
income greater than $60,000. A simple but nonetheless meaningful definition of energy access is
the ability to get utility service, which is impacted by the disconnection practices and policies of
utilities.
Just as energy security is not improving, the average energy burden of low-income households is
also not declining. To assess trends and geographic variations in energy burden, Fisher, Sheehan
and Colton define the home energy affordability gap as the difference between actual home
energy bills and affordable home energy bills.6 The actual bills are calculated as a function of
energy usage, housing, and weather characteristics. As noted earlier, the affordable burden is set
at 6% of the household’s income. The gap is calculated at a county-by-county and state-by-state
level, for different segments of the low-income populations starting at 50% and going up to
200% of the household federal poverty level. Based on updated national estimates, the home
energy affordability gap index for the U.S. in 2018 was 134.4 (compared to the indexed value of
100 in 2011).7 8 In monetary terms, this is equivalent to $51.8 billion. The report also provides a
summary of this distribution across census regions. The Mountain region had the highest Home
Energy Affordability Gap Index at 284.6. This translates to $3.7 billion in 2018, compared to
$1.3 billion in the base year, 2011.
At the same time that these indicators show that neither energy affordability nor energy security
are improving, program evaluations document clearly that the energy affordability for the
millions of homes that have received weatherization and energy-efficiency services has, in
aggregate, improved (see Section 4). The average burden of low-income households overall has
5 http://defgllc.com/news/article/how-well-are-you-reading-your-low-income-customers/#/
6 http://www.homeenergyaffordabilitygap.com/01_whatIsHEAG2.html
7 http://www.homeenergyaffordabilitygap.com/03a_affordabilityData.html
8
http://www.homeenergyaffordabilitygap.com/downloads/2018_Released_Apr19/HEAG2018%20Regional%20Fact%20Sheets.pd
f
10not declined largely because only a fraction of the total eligible population has received such
services.
The energy consumption patterns of low-income households vary with gender, age, race,
education, health and disability status, as well as cultural attributes and occupations of members
(Tonn et al. 2015, 2015b). Elnakat et al. (2016) found that households in zip code areas where
the median age of the household head was less than 30 years, used significantly less energy per
capita than zip code areas with median ages above 40 years. Zip codes with a higher percentage
of high school graduates also had higher levels of energy consumption.
Geography is also important: household energy patterns vary widely across highly urbanized
areas (Porse et al., 2016), suburbs (Verclas, 2018), rural and remote locations (Souba and
Mendelson, 2018; Lin, 2018b; Ross, Drehobl, and Stickles, 2018; Begay, 2018a, b) and climate
regions (Ross, Jarrett & York, 2016). Many low-income households have experienced
generations of the poverty cycle, especially the chronically unemployed including disabled
individuals who are dependent on public assistance or charitable support for survival. Others
have recently experienced income declines, due to shifting job opportunities and retirement from
the workforce. Some have chosen a low-paying profession such as artists, writers, and
community activists. Still others are unskilled or semi-skilled, working in low-wage jobs in
retail, hospitality, and health services. Energy decision making varies across all of these groups
(Schwartz, 2014).
The problems of high energy burden and insecurity are more severe in minority households and
those with children and older residents (Berry et al., 2018). Hernandez, Aratani, and Jiang (2014)
found that black households with children were more likely than any other group to experience
energy insecurity, after controlling for income. Kontokosta, Reina, and Bonczak (2019)
examined an extensive database describing 3,122 census block groups (CBGs) in five U.S. cities.
Of these CBGs, 42% were classified as predominantly minority neighborhoods, and the
remainder were predominantly non-hispanic white neighborhoods. For the three lowest income
groups (≤50%, 51%–80%, and 81%–120% AMI), energy burdens in the two types of
neighborhoods were statistically distinct. Very-low-income residents (≤50% AMI) in minority
neighborhoods had energy burdens that were 1.56% higher than households of the same income
category living in predominantly non-hispanic white communities. A similar difference was
identified in the two other low-income groups (51%–80% AMI and 81%–120% AMI), although
the gap in energy burden was smaller (Kontokosta, Reina, and Bonczak, 2019).
Energy burden also tends to be concentrated in rural areas, and states in the East South Central,
New England and Mid-Atlantic regions have the highest rural energy burdens (Ross, Drehobl,
and Stickles, 2018). Hoffman (2017) cautions against using aggregate national or regional
indicators of energy burden, arguing that they can significantly underestimate the number of
eligible households because the extremes in the distribution disappear when averages are
examined.
2.2 CAUSES OF HIGH ENERGY BURDEN
The underlying causes of high energy burden identified in literature can be divided into five
main categories – location and geography, housing characteristics, socio-economic situation,
energy prices and policies, and behavioral factors (Table 2.1).
11The first category of causes and correlates is geographic location, which is a strong predictor of
energy burden. Low-income residents of rural communities and island territories pay higher-
than-average bills for both electricity and heating fuels (Shoemaker, Gilleo, and Ferguson, 2018).
With high energy costs, the benefits of energy efficiency could be significant, but rural residents
face numerous other barriers such as a generally older housing stock that has produced a “rural
energy-efficiency gap” (Winner et al., 2018).
Similarly, low-income households in the nation’s largest cities face higher-than-average energy
burdens (Drehobl and Ross, 2016). Fox (2016) and Brown9 document the problem of low-
income burdens in Southeastern states,10 where poverty rates are high, and households consume
significant amounts of energy for both heating and cooling to keep their aging and poorly built
homes livable. There is a correlation between the types of fuels used for heating and cooling and
their impacts on the household bills. HVAC systems in the South tend to be electric whereas
heating in most other regions is dominated by natural gas, which is more affordable. In summer
months and in hotter climates, households with electric space conditioning have greater
opportunities to save energy (Bradshaw, Bou-Zeid, and Harris, 2016) whereas in the winter
months, there is more potential to save energy in the colder regions (Bradshaw et al., 2014;
2016).
Finally, low-income neighborhoods can lack access to efficient appliances. For example, Reams,
Reiner, and Stacey (2018) found that energy-efficient bulbs are less available in low-income
areas, based on in-store surveys conducted in Wayne County, Michigan.
Second, housing characteristics are a major determinant of energy consumption and intensity
(consumption per square foot). Older homes, public housing, and multifamily units also correlate
with high energy intensity (Berkland, Pande, and Moezzi, 2018; Langevin, Gurian and Wen,
2013). Variation in maintenance and housing quality also manifests in the form of different
levels of gas and electricity consumption (Scheu et al., 2018). Typically, low-income houses are
older and undergo fewer repairs and upgrades over time. As a result, these housing units usually
have inefficient insulation and older appliances, further adding to the energy burden (Cabeza et
al., 2014). Bradshaw et al. (2014) also conclude that the overall savings potentials ultimately
depend on the housing stock and the space conditioning equipment in use. In sum, much of the
affordable housing/low-income housing in the U.S. remains energy inefficient despite
advancements in building technologies and science.
Third, socio-economic characteristics determine a household’s ability to afford energy-efficiency
retrofits and more energy-efficient appliances (Thorve et al., 2018). Based on 2015 data from the
Residential Energy Consumption Survey, low-income households use less energy than any other
income group. However, they have the highest energy burdens, particularly households with
incomes less than $20,000, whose energy burdens are more than twice as high as households
who earn $20,000-$40,000.11 While high-income households consume more energy, their EUI
(that is, energy use per square foot of housing) is lower (Bednar et al., 2017).
9 https://cepl.gatech.edu/sites/default/files/attachments/SCEN_PPT_Energy_Equity_05-30-18-Final_0.pdf
10 https://www.energy.gov/sites/prod/files/2019/01/f58/WIP-Energy-Burden_final.pdf
11 https://www.nclc.org/images/pdf/special_projects/climate_change/report-reversing-energy-system-inequity.pdf
12Table 2.1. Causes and Correlates of High Energy Burden
Location and Housing Socio-economic Energy Prices
Behavioral Factors
Geography Characteristics Situation and Policies
● Rural, urban, ● Thermal integrity ● Income ● Energy prices ● Lack of
Native American, of building ● Ethnicity/Racial ● Energy rate knowledge
remote ● Type, age and background designs ● Misplaced
community, size: single- ● Immigrant vs ● Energy mix incentives/
island territory family, native-born and access to principal-agent
● Climate manufactured, ● Number of natural gas problems
● Population multifamily) occupants, ● Availability (especially in
density ● Owner-occupied children, elderly, and multifamily
● Urban vs rental and and handicapped effectiveness homes)
morphology public housing of low-income ● Lifestyle cultural
(affecting access ● Age and type of energy factors
to jobs and appliances programs and ● Lack of control
efficient ● Type of appliances over energy bills
appliances) thermostat: WiFi, ● High non-
smart, monetary costs
programmable,
touch screen
Race and ethnicity also correlate with overall energy use, level of energy burden, and household
energy consumption patterns. Hernandez et al (2016) and Bednar et al. (2017) find that African
Americans have higher utility costs and higher Energy Use Intensity (EUI), as do Hispanic
households. The underlying causes of these patterns are complex, but likely include impacts
from historical housing injustices such as Jim Crow laws that enforced racial segregation. In
addition, the size and composition of a household are key determinants of household energy
consumption. Some of the same patterns are emerging in studies of other advanced energy
technologies. For instance, Sunter et al. (2019) analyze rooftop solar adoption across the country
and find that census tracts with larger shares of racial and ethnic minority groups have lower
rates of adoption compared to white-majority census tracts.
Understanding the relationship between social demographics, load shapes and energy burden is
only now emerging as a research focus (Jaske, 2016), which is particularly promising because it
could help to guide efforts to manage consumption during the hours when it matters most.
The fourth category of causes and correlates of high energy burden is prices and policies. For
example, high fixed components in power bills or reconnection fees are important barriers to
reducing energy bills. These are discussed further in Section 3.
The fifth category covers behavioral determinants of energy consumption. Lack of knowledge
and split incentives can be major hurdles to well-functioning housing markets, undermining
investments in home retrofits and participation in energy efficiency programs. Building owners
and managers know more about the energy performance and efficiency of their buildings than do
prospective buyers and tenants, leading to the well documented situation of “lemons”, when
consumers buy energy-inefficient appliances and homes because of imperfect marketplace
13information (Brown and Wang, 2015). Split incentives are especially evident in rental apartments
where tenants do not have control over appliance choices and energy conservation measures, but
they have to pay the bills (Brown, 2001). Tenants are often beholden to building owners and
managers to make smart energy decisions based on their understanding of the energy integrity of
the units. Tenants that are not provided information on behavior solutions or provided technical
improvements, are likely to remain in situations of high energy use and burden (Berkland et al,
2018). In addition, residents of rental housing do not always have control over their energy bills;
for example, building management may control the heating and cooling settings, resulting in
thermal discomfort. This asymmetry of information and lack of control renders tenants
vulnerable to high bills and the possibility of eviction.
Despite the stated willingness of most households to conserve energy and invest in energy-
efficient appliances, there is often inconsistency between these values and their actual purchase
behavior. These inconsistencies are sometimes based on various personal and contextual
constraints including lack of available capital and nearby vendors (Brown and Sovacool, 2018).
Some energy programs have long waitlists of eligible program participants, while others face
difficulty meeting their outreach and participation goals (Hirshfield and Iyer, 2012). From the
utility’s perspective, the small scale and dispersed nature of energy-efficiency projects
challenges the aggregation of this resource, in-creasing its transaction costs. Effort is required to
fill the “pipeline” with energy-efficiency projects that are investment-ready and creditworthy
(Brown and Wang, 2015).
Such transaction costs suggest the case for utility partnerships with local community agencies
that offer human services and already have people with completed income qualification
paperwork for other programs (food, housing, medical care, etc.). This is particularly valuable
for a program like WAP because its administrative costs are generally capped at 10%. (10 CFR
440). To take advantage of shared resources, WAP tends to be delivered alongside other social
service programs so that transaction costs can be shared under the larger umbrella program
(Community Action Agency). These types of transaction cost savings also motivated the MOU
between DOE and HUD, which provided lists of income eligible “properties”.
2.3 EFFECTS OF HIGH ENERGY BURDEN
High energy burdens have far-reaching and enduring consequences. Broadly defined, high
energy burdens for low-income households have two types of inter-locking effects related to
household economics and health.
Adverse economic and financial consequences often occur when low-income households with
high utility bills have to make trade-offs between meeting alternative critical household
expenditures. Paying for food, medical care, telecommunications, and shelter are often sacrificed
in order to make timely utility bill payments (Hernandez et al., 2016; Camprubi et al., 2016).
These trade-offs create a negative feedback loop that traps families in an enduring cycle of
poverty. For example:
• Low-income families unable to pay their high energy bills become vulnerable to utility
shut offs, which can lead to homelessness.
14You can also read