Mail-In Voter Fraud: Anatomy of a Disinformation Campaign
←
→
Page content transcription
If your browser does not render page correctly, please read the page content below
Mail-In Voter Fraud: Anatomy
               of a Disinformation Campaign
                  The Harvard community has made this
               article openly available. Please share how
               this access benefits you. Your story matters

Citation              Benkler, Yochai, Casey Tilton, Bruce Etling, Hal Roberts, Justin
                      Clark, et al. Mail-In Voter Fraud: Anatomy of a Disinformation
                      Campaign, 2020.

Citable link          https://nrs.harvard.edu/URN-3:HUL.INSTREPOS:37365484

Terms of Use          This article was downloaded from Harvard University’s DASH
                      repository, and is made available under the terms and conditions
                      applicable to Other Posted Material, as set forth at http://
                      nrs.harvard.edu/urn-3:HUL.InstRepos:dash.current.terms-of-
                      use#LAA
Mail-in Voter Fraud:
Anatomy of a Disinformation Campaign
The Disinformation Campaign Surrounding the Risk of Voter Fraud Associated with
Mail-in Ballots Follows an Elite-Driven, Mass Media Model; Social Media Plays a
Secondary Role in 2020.
Yochai Benkler, Casey Tilton, Bruce Etling, Hal Roberts, Justin Clark, Robert Faris, Jonas Kaiser,
and Carolyn Schmitt1
SUMMARY AND OVERVIEW
The claim that election fraud is a major concern with mail-in ballots has become the central threat to
election participation during the Covid-19 pandemic and to the legitimacy of the outcome of the
election across the political spectrum. President Trump has repeatedly cited his concerns over voter
fraud associated with mail-in ballots as a reason that he may not abide by an adverse electoral
outcome. Polling conducted in September 2020 suggests that nearly half of Republicans agree with
the president that election fraud is a major concern associated with expanded mail-in voting during
the pandemic. Few Democrats share that belief. Despite the consensus among independent
academic and journalistic investigations that voter fraud is rare and extremely unlikely to determine a
national election, tens of millions of Americans believe the opposite. This is a study of the
disinformation campaign that led to widespread acceptance of this apparently false belief and to its
partisan distribution pattern. Contrary to the focus of most contemporary work on disinformation,
our findings suggest that this highly effective disinformation campaign, with potentially profound
effects for both participation in and the legitimacy of the 2020 election, was an elite-driven,
mass-media led process. Social media played only a secondary and supportive role.
Our results are based on analyzing over fifty-five thousand online media stories, five million tweets,
and seventy-five thousand posts on public Facebook pages garnering millions of engagements. They
are consistent with our findings about the American political media ecosystem from 2015-2018,
published in Network Propaganda, in which we found that Fox News and Donald Trump’s own
campaign were far more influential in spreading false beliefs than Russian trolls or Facebook clickbait
artists. This dynamic appears to be even more pronounced in this election cycle, likely because Donald
Trump’s position as president and his leadership of the Republican Party allow him to operate directly
through political and media elites, rather than relying on online media as he did when he sought to
advance his then-still-insurgent positions in 2015 and the first half of 2016.
Our findings here suggest that Donald Trump has perfected the art of harnessing mass media to
disseminate and at times reinforce his disinformation campaign by using three core standard practices
of professional journalism. These three are: elite institutional focus (if the President says it, it’s news);
1
Work on this report is part of a project on Public Discourse in the U.S. 2020 Election at the Berkman
Klein Center for Internet and Society at Harvard University. The project was funded by grants from Craig
Newmark Philanthropies, the Ford Foundation, and the Open Societies Foundations.
1
headline seeking (if it bleeds, it leads); and balance, neutrality, or the avoidance of the appearance of
taking a side. He uses the first two in combination to summon coverage at will, and has used them
continuously to set the agenda surrounding mail-in voting through a combination of tweets, press
conferences, and television interviews on Fox News. He relies on the latter professional practice to
keep audiences that are not politically pre-committed and have relatively low political knowledge
confused, because it limits the degree to which professional journalists in mass media organizations
are willing or able to directly call the voter fraud frame disinformation. The president is, however, not
acting alone. Throughout the first six months of the disinformation campaign, the Republican National
Committee (RNC) and staff from the Trump campaign appear repeatedly and consistently on message
at the same moments, suggesting an institutionalized rather than individual disinformation campaign.
The efforts of the president and the Republican Party are supported by the right-wing media
ecosystem, primarily Fox News and talk radio functioning in effect as a party press. These reinforce
the message, provide the president a platform, and marginalize or attack those Republican leaders or
any conservative media personalities who insist that there is no evidence of widespread voter fraud
associated with mail-in voting.
The primary cure for the elite-driven, mass media communicated information disorder we observe
here is unlikely to be more fact checking on Facebook. Instead, it is likely to require more aggressive
policing by traditional professional media, the Associated Press, the television networks, and local TV
news editors of whether and how they cover Trump’s propaganda efforts, and how they educate their
audiences about the disinformation campaign the president and the Republican Party have waged.
On September 23, 2020, in response to a question regarding whether he would accept an election loss
and a peaceful transition of power, President Trump responded: “We’re going to have to see what
happens.” “You know that I’ve been complaining very strongly about the ballots, and the ballots are a
disaster.” He repeated the assertion about voter fraud in mail-in ballots and doubled down on his refusal
to commit to accept the results at the close of the presidential debate on September 29. His assertions
about the risk of voter fraud are shared widely by Republican voters. A Pew poll published on
September 16 found that “43% of Republicans identify fraud as a major problem with voting by mail
versus 11% of Democrats.” That gap grew from 4:1 to 15:1 once comparing Republicans to Democrats
who consumed only the major political mass media outlets and no other sources, who made up about
30% of each of the two groups. Sixty-one percent of Republicans whose major source of news was only
Fox News or talk radio thought voter fraud by mail was a major issue. Only 4% of Democrats whose
source of news was only the New York Times, the Washington Post, NPR, CNN, or MSNBC held the same
belief. The gap between the two appears to reflect the roughly 30% of respondents who rely on
network television (ABC, NBC, CBS).2 A month earlier, on August 11, a Monmouth poll found that
“Nearly all Democrats (90%) say expanding vote-by-mail is a good idea but few Republicans (20%) agree.
Six in ten (60%) independents say it is a good idea.” Moreover, among Democrats, “40% pointing the
finger at Russia while 9% name China and 4% name another country” as an important source of possible
2
While Pew did not break the data up in the report, the data available on the site suggest that these respondents
ranged from 20% of CBS viewers to 14% of NBC viewers, with 17% of ABC viewers asserting that fraud is a major
problem with mail-in votes, similar to CNN (16%), and quite different from either Fox and talk radio (61%), on one
side, or to MSNBC, New York Times, or NPR, on the other side (3-4%).
2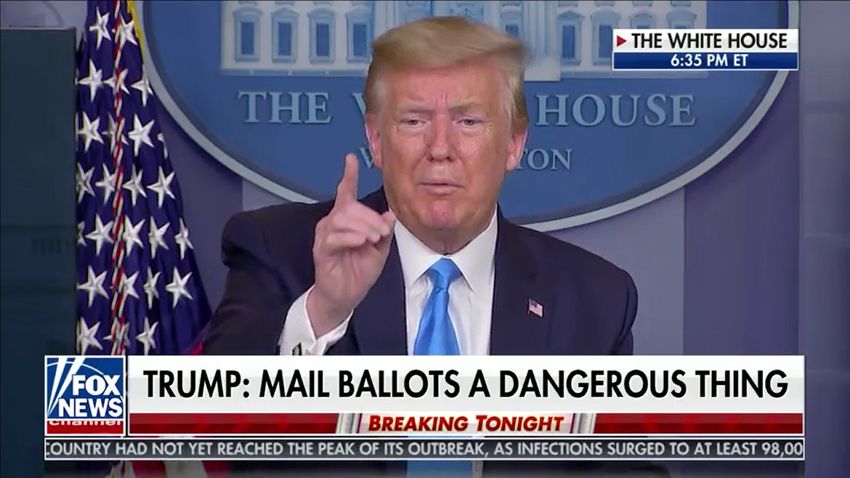
election meddling, more than those Democrats who expected that Trump (31%) along with the
Republican Party (16%) would play such a role. By contrast, the poll found that “A majority (55%) of GOP
voters, on the other hand, believe the Democratic Party would be the most likely perpetrator of any
election interference. Another possible cause named by Republicans is vote-by-mail (11%).” A Morning
Consult poll fielded at the very beginning of August found that “57 percent of Republicans, said the
country should not allow all citizens to participate via mail-in elections this year “because it jeopardizes
election security,” and that only 27% of Republican voters thought that the election should proceed as
planned and most voting should be by mail. By contrast, that poll found that 75% of Democrats and half
of independents thought that most voting should be by mail.
These survey responses leave little doubt, as we write in the final stages of the 2020 presidential
election and in the midst of the global Covid-19 pandemic, that the question of whether to use mail-in
voting, and whether to accept mail-in votes as legitimate will have a dramatic effect on participation
rates and the legitimacy that tens of millions of Americans will attach to the outcome of the election.
We therefore take the question of how beliefs about the security and legitimacy of mail-in voting during
the pandemic are formed as critically important, and doubt that anyone, Democrat or Republican, will
disagree with that judgment. It is also a question, about which there are, as the surveys show, starkly
differing views within the American population. As such, it offers an excellent core case study to
understand how political beliefs and attitudes are shaped at a mass population scale. In particular, we
use it to examine three competing conceptions of how public opinion is shaped in the twenty-first
century. The conception most commonly discussed in public debates is that social media has changed
everything, and that false beliefs spread in the population directly through exposure to social media. It
is this belief that sustains the widespread concern with Russian propaganda, trolls, and bots, as well as
with Facebook and YouTube dissemination of falsehoods, because the concern is that these actors
abuse, or enable abuse, of distributed media and directly infect users of these media with false beliefs.
Critically, this model focuses on the power of actors who are not political or media elites with access to
mass media, but instead are individuals or networks who are empowered to shape public perceptions
directly through social media activity and without recourse to mass media. Pizzagate, news sites
masquerade as legitimate but are in fact fake and derive their traffic from inauthentic Facebook activity,
and Russian-create Facebook groups that trick people into holding false beliefs are quintessential
examples. We might call this approach as the Social Media Dominates approach. A second, more
moderate concept, accepts the importance of mass media, but sees social media as the origin of
falsehoods spread initially online, and thereby influencing political and media elites who diffuse the
falsehoods more broadly. Here, the broad population may get the false beliefs through a combination of
social media and mass media, but the origin of falsehood is largely in social media, from influencers
whose influence is based on their social media activity, not mass media or some political role offline,
Russians, commercial clickbait fabricators, activists, and so forth, who use social media in part to act
directly on other social media users, and in part to shape mass media. We could think of this as a Social
Media Leads approach. The third approach is that social media has had less of an impact on political
beliefs in America than the other two approaches suggest, and that media and political elites still drive
agenda setting (what we think about as important) and framing (how we think about it), primarily
through mass media. Where activists successfully push narratives, it is through staging protests and
media events (often virtual) that have much in common with media happenings and media activism
whose roots were in the 1960s. Social media certainly plays a role; sometimes an influencer who is not
part of the political and media elites can push a view; activists can stage media happenings purely
3
through video and online campaigns; but social media mostly serves to recirculate agendas and frames
generated through mass media, and plays a secondary or supportive role. We can call this the Mass
Media Leads model. There are obvious cases where the “Social Media Leads” model is the best
explanation of transformations of political discourse. Videos of police shootings of Black men and
women shared through social media are the most powerful example of use of social media that
transformed public conversation, in combination with very real world sustained protests by the Black
Lives Matter movement. Our case study suggests that on the critical question of voter fraud, mail-in
ballots, and the legitimacy of the 2020 election, however, the mass media leads model explains what we
observe better than either of the models that place social media in the driver’s seat. Decisions that mass
media journalists and editors make about what they cover and how appear to be more important than
what happens on Facebook, and appear to be driven by the actions of political and media elites,
principally President Trump. This is particularly true of the largely-ignored media of network TV (ABC,
CBS, NBC), local TV, and CNN, which appear to be the primary source of news for the least politically
pre-committed one-third of Americans, and, in the case of local TV, the least politically knowledgeable.
For this study we analyze quantitatively and qualitatively stories published online, tweets, and public
Facebook posts and pages that mention words relating mail-in voting or absentee ballots to fraud,
election rigging, or similar constructs. We analyze over 55,000 such stories published online across five
quintiles of political orientation3 between March 1 and August 31 2020 collected through Media Cloud,
five million tweets, collected through Brandwatch, and 75,000 posts on public Facebook pages, gathered
through CrowdTangle. The outlets publishing these stories or linked to by the tweets and posts include
mainstream media, including the online presence of local television and radio stations, local
newspapers, and cable television, and online-only sources and forums ranging from large entities like
the Huffington Post or Breitbart, through forums like Townhall or DailyKos, to personal blogs. We
supplement these directly-searchable materials with desk research looking at videos of cable and
network television when the online research suggests significant interaction between online media and
TV.
Figures 1 and 2 demonstrate our core finding: media coverage across the entire media ecosystem:
–online stories across the political spectrum, Twitter, and Facebook–was driven primarily by
agenda-setting interventions by President Trump, often closely aligned with the RNC, his campaign, and
3
To be able to understand the political orientation of the stories, over fifty thousand of our stories are from
sources for which we have already calculated an audience political orientation just before the election period
started. We divide these into quintiles: right, center-right, center, center-left, and left, We assign audience
political orientation score by calculating, for each of ~15,000 Twitter users that were active between Jan. 2019 and
June 2019, an ideology score such that the mean ideology score is 0 and collectively they have a standard deviation
of 1. Negative scores indicate a user is politically left of the mean, and positive scores indicate a user is right of the
mean. We additionally find the approximate political center by finding the score at which users self-identify as
either liberal or conservative at equal rates in their Twitter bio. We assign scores to media outlets based on the
relative proportion of Twitter accounts from the left and the right of this center that tweet out stories from the
site. We then divide these proportions into quintiles by saying the center is where stories are shared at about an
equal rate from the left and right, the center-right and center-left are shared at 2:1 and 1:2 ratios of right to left,
respectively, and the right and left are stories that are shared at at least ratios of 4:1 and 1:4. Reuters, for
example, has a score near 0.0, which we bin as “center.” The NYT has a score of -0.27, which we bin as “center
left.” The Wall Street Journal has a score of 0.21, which we bin as center-right. Fox News has a score of 0.75,
which we bin as “right.” Mother Jones or the Daily Kos have scores of -0.87 and -0.88, respectively, and we bin
them as “left”.
4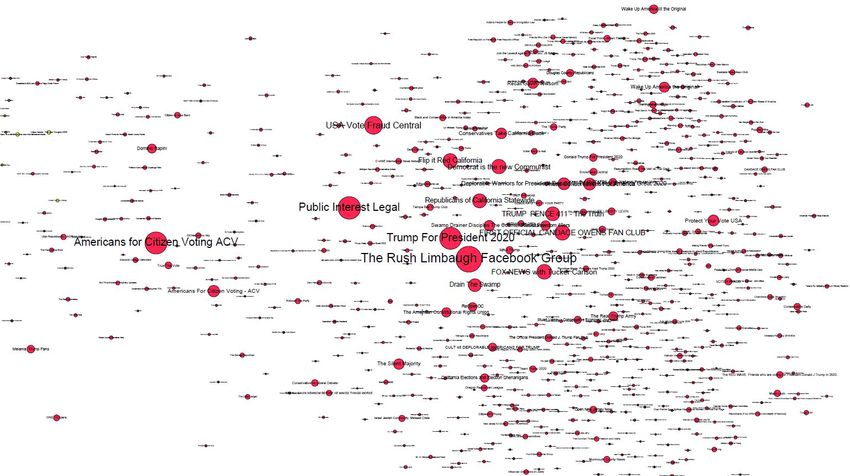
discrete lawsuits or decisions of Republican officials aimed to limit or delay the use of mail-in ballots.
Figure 1 is a network map of all media sources that published stories online about voter fraud associated
with mail-in voting from March 1 to August 31, 2020. It underscores the central role of Trump’s Twitter
handle, its authority and influence over mainstream media (indicated by its location at the heart of the
mainstream network, as opposed to as part of the insular, asymmetrically polarized right-wing media
ecosystem), and its influence over the major outlets: the New York Times, the Washington Post, CNN,
the Associated Press (AP) and Reuters, NPR, and the television networks. We explain this and related
maps in more detail in Part I.

Figure 1: Network Map of online media outlets. Nodes sized by inlinks from other media sources to stories they published
about mail-in voter fraud, and reflect the influence of each media source on the overall debate. Location on the map
determined by the patterns of linking relations among all media sources. “Trump Twitter” is composed of all Trump’s tweets
about mail-in voter fraud that received links from any online story during the period observed.

Figure 2 is a timeline of changes in the numbers of stories, tweets, and Facebook posts that related to
mail-in voter fraud, marked in each case with the precipitating event for the spike in attention to the
topic. Peaks in attention reflect days on which attention to the mail-in voter fraud agenda became
salient in coverage by online stories, Facebook, or Twitter. We found that the changes across the three
platforms were almost always related to each other. Figure 2 makes clear that most of the peaks in
coverage of mail-in voter fraud, across all media and social media, were driven by Donald Trump using a
combination of his Twitter account, his press briefings, and his interviews on Fox News. We describe
each peak in detail in Part II of the report.

                                                                                                                        5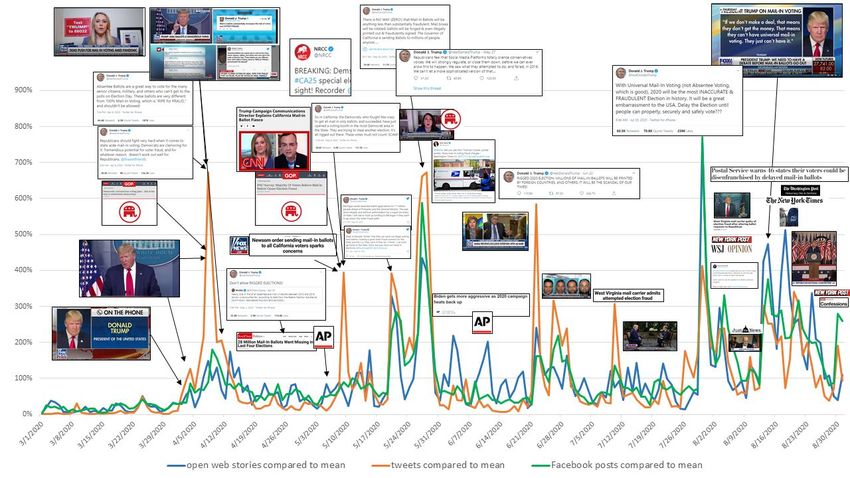
Figure 2: Relative changes in the number of stories published online, tweets, and Facebook posts that mention mail-in voting
or absentee balloting and fraud or election rigging, March 1, 2020 to August 31, 2020. Icons represent the precipitating event
for each peak. Trump, using Twitter, press briefings, and television interviews, coordinated with the RNC and his own
reelection campaign, drives almost all peaks in attention. Detailed description in Part II. To zoom in on a pdf version, see
here.
The political calculus underlying this attack is stated in two of Trump’s statements early in the campaign.
On March 30, in his first interview after signing the first coronavirus relief bill, which included 400
million dollars to support state efforts to enable voting by mail during the pandemic, the president went
on Fox and Friends and explained that he had forced Democrats to remove voting-related provisions,
stating that Democrats’ efforts to make voting easier and more ubiquitous during the pandemic would
get so many voters that “you’d never get a Republican elected in this country again.” On April 3, Trump
again said that “a lot of people cheat with mail-in voting.” An April 8 tweet laid out the strategy and its
reasoning plainly: “Republicans should fight very hard when it comes to state-wide mail-in voting.
Democrats are clamoring for it. Tremendous potential for voter fraud, and for whatever reason, doesn’t
work out well for Republicans.” During the following six months, the president and the Republican Party
executed on this strategy.
All but one of the major peaks, and most of the smaller peaks in attention to the mail-in voter fraud
frame are triggered by Trump tweets, press conferences, or television interviews. Often these are
backed up by statements from the RNC, Trump’s campaign senior staff, and/or White House staff across
diverse media. The one major peak in attention that is partly an exception, around August 16-18,
followed new disclosures by the Washington Post about disruptions at the US Postal Service. Even that
peak is likely better interpreted as part of a wave of attention that began on August 13th, with Trump’s
statement in a Fox Business interview that if he denied funding to the Postal Service, then “they can’t
6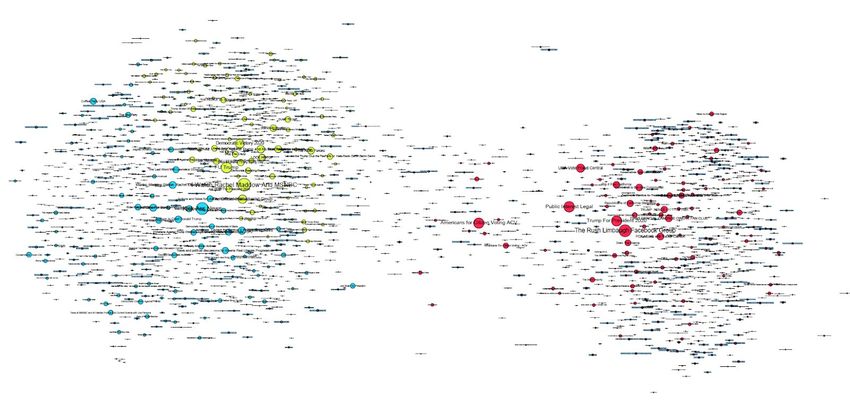
have universal voting.” It is difficult to strictly separate the peak three days later from the furor those
comments triggered. Smaller peaks in attention were also driven by reporting of news stories in mass
media about actual events such as litigation over mail-in voting, specific cases of voter fraud charges and
guilty pleas entered; or reporting on changes in the Postal Service, as well as by statements of
Democrats, primarily Nancy Pelosi or Joe Biden, arguing the importance of mail-in voting and seeking
coronavirus relief funding to support transition to voting by mail.
The dominant drivers of the campaign have been the president’s bald assertions that voter fraud is
rampant, and his occasional statements that he will do something outrageously aggressive, usually
beyond his constitutional power, so as to draw attention to his tweet. These included most prominently
his threats to block federal funding to Michigan and Nevada, to delay the election, or to refuse to
recognize the results of the election. Beyond that core tactic, which accounts for most of the major
peaks in attention, both the president and his party used a tactic that involved identifying truthful
stories of actual voter fraud prosecutions or guilty pleas, past or present, and repeatedly referring to
them as evidence and reinforcement of the assertion that voter fraud is a widespread phenomenon
affecting millions of votes. These included the story of a North Carolina Republican operative who had
pled guilty to voter fraud in aid of a Republican primary candidate in 2019; a West Virginia mail carrier
who had changed several primary ballot requests mailed by Democrats to “Republican,” “just for fun”;
or a city clerk in Michigan who pled guilty to altering 193 absentee ballot requests. Occasionally, the
“factual” grounding would be wholly fabricated, as when the president, pressed for evidence of voter
fraud at a press conference, claimed that California had reached a settlement with a conservative
organization, Judicial Watch conceding that a million votes had been cast illegally, when in fact the state
had settled with Judicial Watch to remove registration from 1.5 million voters who had not voted in
several elections. By far the most prominently covered story was the prosecution and guilty pleas of a
local city council seat election in Paterson, New Jersey who in fact sought to mail in 800 false ballots and
led a New Jersey court to order a new election for the city council seat. These stories accumulated
during the months, and were used repeatedly, often in tandem, as evidence that voter fraud was
rampant, and as our description in Part II showed, also made repeated appearances in President
Trump’s television appearances and press briefings. Democrats parried with much-harder-to-grasp
statistics: that all these cases combine into a tiny number of votes as far as a national election is
concerned, and that while individual cases are inevitable in a system involving tens of thousands of local,
state, and federal elections, with hundreds of millions of votes cast, the salience of the anecdotes vastly
overstates the risk of fraud relative to the risk that voters will be blocked from accessing in-person
voting because of fear of the pandemic, or avoid mail-in voting because of an inflated fear of fraud.
We have been unable to identify a single episode where a peak in media attention to the question of
fraud associated with voting by mail or absentee ballots, in either mass media or social media, was
meaningfully driven by an online disinformation campaign, and for which we did not have an obvious
elite-driven triggering event. These spikes in attention of online media sources are closely related to
increases in attention on Twitter and posting on Facebook with tweets/posts related to voter fraud in
the context of mail-in ballots (Figure 2). The time sequence of these spikes and our qualitative research
into each spike in attention confirm that it was these elite actions through Trump’s Twitter account and
his appearances on Fox and at press briefings, and through statements by other Republican political
elites or conservative media elites that drove the dissemination of disinformation regarding voter fraud
in mail-in ballots.
7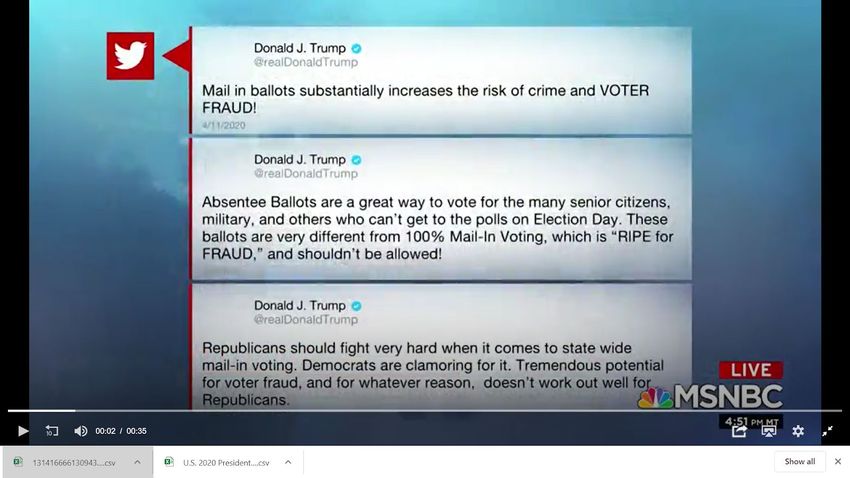
INTRODUCTION
Concerns about the toxic nature of online communication, particularly on social media, have been a
staple of public conversation at least since the 2016 presidential election and the emergence of the idea
that social media, in particular Facebook, played a central role in the success of Donald Trump’s election.
Decisions by Twitter or Facebook to police, or not to police, content on their sites are international
news, and reports on how insane political news is on Facebook are regularly published in respectable
media. Our own research on the 2016 election and the first year of the Trump presidency suggested
reason to think that social media was not as important as more-or-less everyone thought it was, and we
emphasized instead the role of Fox News and Trump himself as a candidate in setting the agenda of
what the American public was focusing on in the run up to the 2016 election and the first year of the
Trump presidency. As part of our ongoing research into the 2020 election, we sought to assess the
relative importance of different media in shaping beliefs, setting the agenda, framing the issues, and
propagating disinformation. Here we report on coverage dedicated to one of the major issues likely to
affect whether and how Americans vote during the Covid-19 pandemic, and is likely persist through
election day and the following weeks or months as a major frame through which tens of millions of
Americans will process the results, and reject or accept the legitimacy of the outcome of this highly
contested election: the implementation of voting by mail and the question of whether it will increase
the rate of fraud. The concern with voter fraud facilitated by mail-in votes is also a particularly good
object of study, because the academic literature of the past 15 years or so, using diverse methods, has
consistently found that allegations of widespread voter fraud over the past 20 years are not supported
by credible evidence.4
We collected all stories from March 1 to August 31 2020 that are in the Media Cloud collection of media
sources for which we were able to calculate a political orientation based on the behavior of Twitter
audiences. We then searched this dataset for stories that met a query designed to capture stories that
fit cleanly into the frame of voter fraud or election rigging associated with mail-in voting or absentee
ballots, and iteratively crawled the links from those stories to discover additional stories.5 For the six
months period, we collected over 55,000 stories published online that fit this query. We also searched
for tweets and public Facebook page posts that fit our query on Brandwatch and CrowdTangle,
respectively. These searches yielded five million tweets and 75,000 Facebook posts over the period of
observation. We use a histogram of the number of stories per day, the number of tweets per day, and
the number of Facebook posts per day, normalized, to identify days or clusters of days during which
there was particularly intensive coverage on any of the platforms, and in the case of online stories, in
any of the political quintiles. Peak coverage and attention on the three platforms (open web, Twitter,
and Facebook) are well aligned in most episodes. We use network analysis to describe the shape of
influence in the networks, using interlinking among stories related to voter fraud and mail, linking
among websites based on tweeting patterns, and linking based on Facebook posts that include links to
websites. We use text analysis to produce network maps of clusters of sites that republish the same
story as others, allowing us to identify patterns of syndication, particularly the AP, NPR, and the
television networks. While these maps do not measure the influence of syndication directly, they do
4
For a current review of the academic literature in political science see Sharad Goel et al., “One Person, One Vote:
Estimating the Prevalence of Double Voting in U.S. Presidential Elections,” American Political Science Review 114,
no. 2 (May 2020): 456–69, https://doi.org/10.1017/S000305541900087X.
5
The query was {(vote* or voti* or ballot) and (mail or absent*) and (fraud or rigg* or harvest*)}.
8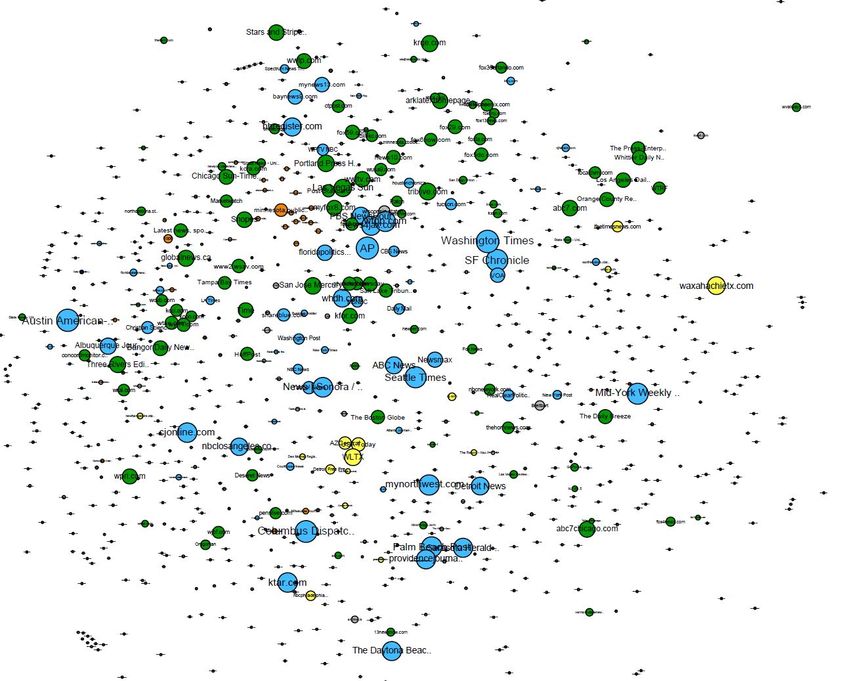
offer a visual way of understanding how understated the impact of these stories is when we look at
maps where prominence is measured at the single story on a single site metric, and ignores the
real-world amplification mechanism of syndication. Given what we know of survey evidence of news
consumption, the syndicated stories likely garner many more readers and viewers than social media or
network only metrics can expose. We complete the quantitative analysis with qualitative desk research
into the detailed dynamics of coverage spikes, reading the stories and the most highly-retweeted tweets
and posts with the highest engagement metrics during each peak to identify what events or media
actions precipitated a given spike in attention, and what stories were particularly influential during that
peak. We supplement these observations with searches of TV coverage on the days surrounding the
peaks using the Internet Archive.
The fundamental insight we take away is that the media dynamic that has led to the polarized beliefs
about mail-in voter fraud is an elite-driven, mass media leads model. In particular, Donald Trump
occupies a unique position in driving the media agenda, and his statements, in tweets, press
conferences, and television interviews fundamentally shaped the debate over mail-in voting.
Throughout the campaign, the president’s efforts were supported by the communications teams of both
the White House and his reelection campaign, by the Republican National Committee (RNC), and by
other leading Republican officials at both the federal and state levels. The coordinated messaging
suggests a strategic disinformation campaign, and the president’s own occasional unguarded
statements, in tweets and interviews, suggest that the campaign is driven by a clear electoral-partisan
agenda that is concerned that increasing voter participation during the pandemic will harm Republican
chances of reelection. This disinformation campaign is carried out primarily by means of mass media,
with social media playing a secondary role. It is supported by a right-wing media ecosystem that has
long been subject to a propaganda feedback loop that marginalizes or suppresses dissenting views
within the conservative sphere that try to push back against the mail-in voting fraud narrative: such as
the cases we describe in Part II in which Chris Wallace on Fox News or Senators John Thune and Mitt
Romney tried to refute or reject the President’s false statements at various points in the past six
months.
A major means of reaching out beyond the right-wing media ecosystem has been President Trump’s
successful harnessing of foundational journalistic practices to set the agenda and framing of coverage by
outlets used and trusted by Americans outside his base. He uses the power of the office he holds and
the horrified fascination with his norms-breaking expressions to force mainstream media to report on
his agenda and reinforce the association of mail-in voting with fraud in the minds of distracted readers
and viewers. And he uses the balance or neutrality of professional media to draw out legitimating
descriptions that treat the position he lays out as one among two competing partisan visions, rather
than as a disinformation campaign. The latter strategy was more successful in the early months of the
campaign, and seems to have become less successful as we observe mainstream coverage of his
statements in August.
Our study also underscores the continued important role of cable, network, and local television, and of
local newspapers. For cable, throughout our qualitative work we identify instances where television
appearances played a central role. For regional and local news sites, our analysis looks directly at what
these outlets publish. For local TV stations, the online news items offer only a rougher image of what
airs on TV, but it is not unreasonable to assume that news items published online offer some insight into
what the station will choose to air, on the assumption that the TV stations are unlikely to post materials
9that are inconsistent with what they broadcast. The salience of syndicated stories around the coverage
peaks underscores how much of the daily flow of information to which Americans are exposed does not
come from online sources at all, and certainly not from social media. This is consistent with survey
evidence of a relatively broad range of Americans getting their political news primarily from sources
other than social media. According to the most recent Pew survey fewer than twenty percent of U.S.
respondents say they get their political news primarily through social media. Network TV and local TV,
by contrast, are the primary source of political news for about 30% of the population, of which more
than half is local TV, and news websites or apps accounted for another 25%. Moreover, adults who get
their news from the ABC, CBS, and NBC occupy an intermediate position between Fox News viewers, on
the one hand, and readers of the New York Times or NPR listeners, on the other, in the degree to which
they report believing that mail-in voter fraud is a major problem. Local TV news viewers, in turn, form
the least politically knowledgeable group of Americans, edging out the much younger respondents who
mostly rely on social media. When we analyzed the stories about mail-in voter fraud, we observed that
peaks in media coverage usually consisted of large numbers of syndicated stories reported by the online
sites of local papers and television stations. When we match these to survey evidence about who relies
on these media sources, it becomes likely that the way in which local TV, network TV, and local news
sites report on the mail-in voter fraud disinformation campaign will play a crucial role in shaping the
beliefs and attitudes of the most persuadable 30% of Americans, whose views about mail-in voting and
the risk of fraud are the most up for grabs.
Our observations offer reason to be cautious about how important online misinformation and
disinformation really is in American political communications. It is critical in this regard to distinguish
between different kinds of concerns. There is little doubt that online hate content and disinformation
can lead to personal or small network radicalization, and play a role in the increasing risk of violent
attacks by members of radical networks, particularly on the right. Nothing in the research we report
here is designed to test, much less refute, that insight. We also offer no reason to reject the concern
that, should interventions from political campaigns, activists, or foreign actors successfully acquire social
media narrowcasting capabilities of specific false information to vulnerable populations, such as location
of voting booths or closures, these might succeed in diverting people from their proper voting locations
in specific cases. Our research here does not speak to those issues, but rather to the question of what
shapes the structure and dynamics of the media environment in which millions of people are embedded.
That is the scale at which, if media consumption affects our beliefs at all, one must look in order to
explain large scale population patterns of beliefs such as those revealed in the survey evidence
concerning mail-in voting and the risk of fraud.
The core issue of voter suppression or electoral participation likely to affect millions, rather than
thousands of voters, is likely to be the number of voters, both committed partisans and especially voters
who are less politically knowledgeable and committed, who may be deterred from voting by mail
because of fear of fraud and from voting in person because of fear of Covid-19. The core issue that will
drive peaceful transition or continuation of power will be the tens of millions of partisan voters who will
deny the legitimacy of the election should votes cast by mail be decisive to the outcome. But there will
also be tens of millions of Americans who would rather not think about politics in their day-to-day lives,
and certainly are not going to be obsessive readers of any news source—not the New York Times, not
the Gateway Pundit or Occupy Democrats, and not even any of the 24 hour cable news networks. They
will be influenced more by a general zeitgeist, through diverse avenues of occasional news consumption,
10most prominently local TV news, broadcast television networks, and CNN, and their locally syndicated
news outlets, as well as what they hear from their friends and see in their Facebook feed. But there is no
survey evidence or other empirically-grounded basis to think that social media will be the primary
source of public opinion formation at this mass population level, or the primary driver of mass media
coverage, with respect to mail-in voting fraud.
Our conclusions suggest, in turn, that the most important independent actors in the month before the
election and the months following November 3 will be the editors and reporters of traditional
mainstream media, in particular those who write and use syndicated news stories. Those mass media
outlets continue to be the most important source of, and defense against, disinformation in American
politics in the 2020 election. As we noted, Donald Trump has perfected the art of using professional
journalism’s standard practices as a way of harnessing mass media to his disinformation campaign. To
the extent that the mass media model we identify here is the primary driver of information disorder, it
will not be cured by more fact checking on Facebook. Fox News and talk radio will continue to purvey
the President’s propaganda, despite Chris Wallace’s occasional valiant efforts. The readers of the New
York Times and NPR listeners too are unlikely to be in the balance, persuaded as they already are that
the allegations of fraud are bunk. Quite possibly the most important efforts will be those of mass media
outlets used and trusted by less politically pre-committed, in some cases less politically attentive
viewers, readers, and listeners. It will likely require more aggressive editorial counteraction by media
editors and journalists of those outlets, in decidedly non-tech organizations such as the AP, the
television networks, and local TV news, pursued through choices regarding whether and how they cover
the propaganda efforts of the President and his party, and how they educate their audiences about this
months-long coordinated disinformation campaign.
I. MAPPING THE VOTER FRAUD BY MAIL DISINFORMATION CAMPAIGN
The following network maps explore the relations among a large set of entities. Here, we describe four
different types of networks. Each network consists of nodes and links. Nodes reflect some source of
information: media outlets or Facebook accounts. Links reflect some type of relationship among the
nodes--whether they link to each other, are shared on Facebook by the same accounts, Tweeted by the
same users, or in the case of last map, whether they publish duplicates of the same stories. In all these
cases, the network allows us to capture the structure of the relationships between the nodes: who is
influential for whom? Who is engaging to the same kinds of audiences? Nodes that are large and at the
center of any of the networks are likely to be important to the entire network, and receive links from a
broad range of sites. Nodes that are farther removed, even if they are large, are closely connected to
only one part of their network, and it is there that they tend to be important for the kind of relationship
we are exploring.
Open Web Map
Figure 3 shows a network map of media outlets that published stories about the mail-in voter fraud
frame, based on their hyperlinking practices in stories devoted to that controversy, from March 1 to
11August 31, 2020. The map shows the by-now well-known asymmetric polarization of the American
political media ecosystem, with a distinctive right-wing media sector and a “rest” of media from the
Figure 3: Stories related to Mail-in Voting Fraud. Media outlets sized and located by interlinking among their web stories
about the topic. Trump on Twitter is central to the overall dynamic. Fox News is central to the right. Notable is the
significant role that AP, Reuters, NPR, USA Today, and the television networks play alongside the always-leading sites of the
NYT, WaPo, and CNN.
center to the left. The most prominent feature of the map is the central role that President Trump’s
Twitter handle plays in the media ecosystem, placing it on par with the most influential media sites, and,
indeed, marking it as the most influential source with a right-wing audience orientation. Beyond this
remarkable feature, to which we return throughout this report, the centrality of Fox News to the
right-wing media ecosystem also emerges clearly. More surprising perhaps is that “center-right” outlets
the Wall Street Journal and the New York Post have been pulled deeper into the right wing media
ecosystem, and away from “the rest” of the media ecosystem. We interpret this as consistent with a
mass media focused, elite-driven campaign when reporting in the New York Post and editorials in the
Wall Street Journal offer legitimacy to right-wing online sites whose links have drawn those center-right
sites deeper into the right-wing part of the map. The central role of the New York Times, the
Washington Post, and CNN to the rest of the media ecosystem continues the pattern we observed in our
analysis of the 2016 election and in 2017 using similar techniques. Compared to that earlier work, and to
work we are doing on the 2020 election as well, this topic-specific map suggests a large role of NPR, the
AP and Reuters, USA Today, and the television networks. Our syndication map below, and the
qualitative analysis in Part II suggest that the prominence of these nodes reflects widespread local
syndication, and hence actual attention by audiences.
12Facebook Maps
Figures 4, 5, and 6 offer an image of the debate on Facebook. Figure 4 is an overall image of public
Facebook accounts, with the edges between them reflecting shared links to external media sites. About
70% of all posts we analyzed include a link to an external media source on the web. Figures 5 and 6
reflect a single network of these sites, with node sizes reflecting two different metrics for the
prominence of those sites among Facebook groups and pages. The nodes in each figure are media sites
in the open web that were linked to by the posts we analyzed, just like those we mapped in Figure 3.
The edges, or links among the media sources reflect sharing practices on Facebook: how often stories
from any two media sources were shared on the same public Facebook group. The difference in size of
the nodes reflects two different measures. Figure 5 uses the common metric of total engagements: how
many shares, likes, etc. all stories from that site received on all Facebook posts that linked to it. Figure 6
uses an alternative measure: node sizes reflect the number of Facebook accounts that included links to
stories from those sites. The metric in Figure 6 reflects influence across a range of Facebook pages and
groups. It is less susceptible to the influence of a single or small number of Facebook pages that tend to
account for the great majority of engagements with any story. It is also less susceptible to manipulation
by any single page that seeks to artificially inflate its apparent Facebook success. But Figure 6 will also
understate the success of a single Facebook page with a large, highly concentrated and highly engaged
fan club.
Figure 4: Facebook public accounts present a more symmetrically polarized image than online media. Major pages on both
the right and the left appear to be highly partisan and anchored around the more partisan of political or media personalities.
When we map the public pages and groups on Facebook, we color nodes not by political orientation, for
which we have no external evidence, but by Louvain community detection (a standard algorithm for
measuring clustering of sites in networks). The major groups, like The Rush Limbaugh Facebook Group or
Trump for President 2020, do not appear to be affiliated with Limbaugh or the Trump campaign. The
most prominent group that seems to bridge the much more starkly polarized Facebook space (by
comparison to the open web), Americans for Citizens Voting, is a campaign launched by a conservative
organization and directed specifically at Black voters to embrace techniques like voter ID.6 The other
13Figure 4A: Zoom on Facebook accounts in the right half of the public Facebook page media ecosystem. The dominant groups
that use the names of media and political elites do not appear to be official sites.
Figure 4B: Zoom on Facebook accounts in the left half of the public Facebook page media ecosystem. The dominant groups
that use the names of media and political elites do not appear to be official sites.
6
https://thehill.com/opinion/campaign/462096-protect-civil-rights-with-citizen-only-voting;
https://nationalcenter.org/project21/staff/christopher-arps/; a project of:
https://en.wikipedia.org/wiki/National_Center_for_Public_Policy_Research
14major node in the subnetwork is the Public Interest Legal Foundation, a conservative nonprofit
dedicated to challenging voter access through lawsuits, which authored a misleading report that
received substantial attention, including a retweet from the President on May 1, as our discussion in
Part II will explain. Facebook pages on the left of the map similarly exhibit a partisan focus and pugilistic
naming conventions.
A large majority of posts on Facebook include links to external media sources published online. When
we map those sources based on co-linking patterns from Facebook7 the familiar image of asymmetric
polarization emerges. The differences between Figures 5 and 6 are more pronounced on the right than
for the rest of the media ecosystem. Figure 5, based on total engagements, has outlier clickbait
fabricator Analyzing America playing a more prominent role than it in fact likely is, and FreedomWorks
(fwact.org), Glenn Beck’s the Blaze, or Diamond and Silk are more prominent than Fox News or
Breitbart. This is consistent with widely held beliefs that Facebook is substantially more whacky than the
open web or even Twitter. Figure 6 by contrast puts those more “mainstream” sites firmly at the heart
of the right-wing media ecosystem as measured by Facebook, and makes the map look more similar to
our open web map in Figure 3, or, as we will see in Figure 7, Twitter. In the rest of the media ecosystem,
the difference is less stark. Figure 5 mostly adds Occupy Democrats’s action site (petitions, fundraising)
and MSNBC to the mainstream sites prominent on Figure 6. In our qualitative research, we rely on both
measures to identify stories that were prominent in each time period. We offer both maps because we
think neither alone fully captures the relative influence of individual pages on Facebook, with Figure 5
likely overstating, and Figure 6 likely understating, the role of pages with an intense group of highly
engaged users. The engagement-based metric is a better measure of the intensity of interest and activity
on a small number of pages on Facebook. The link-based metric is a better measure for tracking interest
in a given story across a wider set of Facebook pages. Notable from both figures is that even though the
Facebook groups are more symmetrically polarized, with groups named Watch Rachel Maddow and
MSNBC, FU Trump, or Kick Ass News central to the left wing of the Facebook groups map in Figure 4,
Figures 5 and 6 show that the news sites that these groups on the left share are overwhelmingly
mainstream.
7
An edge between site x and site y means that at least one facebook page or group had posts linking to each
source; the more two sources are shared by the same Facebook page, the closer the nodes will be to each other
15Figure 5: Online news sources network based on total engagement metrics from Facebook. Edges reflect co-sharing on
public Facebook pages and groups. Node sizes reflect the sum of total engagements reported by CrowdTangle for all stories
on mail-in voter fraud published by each site.
16Figure 6: Online news sources network mapped based on the number of Facebook pages that include posts with links to
them. Edges reflect co-sharing on public Facebook pages and groups. Node sizes reflect the number of Facebook pages and
groups 7that linked to them.
Twitter Map
Figure 7 shows media outlets that published stories about mail-in voter fraud that were shared on
Twitter. The map is atypical, different from the Facebook and weblinking maps, and quite different from
Twitter maps that we have developed in broader political topics, most relevantly the broad 2020
election topic and our analysis of Covid 19. Specifically, Twitter attention on mail-in voter fraud is much
more concentrated on a small number of stories, all of which we observe closely in our qualitative work
in Part II. In the extreme cases of the New York Post and Sara Carter, which appear to be enormously
influential in this map, their position and prominence in the network reflects a single super-tweeted
story for each. For the NY Post, it is Jon Levine’s reporting on an alleged Democratic operative who
anonymously and without corroborating evidence confessed to running a network of operatives across
three states for many years and committing practically every one of the acts that President Trump
alleged about how voter fraud works. The story was pumped by the President’s sons and his campaign
staff, and occupied Fox and Friends and Tucker Carlson for three nights. In Sara Carter’s case, it was
Carter’s role in covering early the story of fraud charges in Paterson, New Jersey, the single most explicit
case of voter fraud that emerged throughout the period we studied, which was covered extensively
across the right-wing media ecosystem and on Fox News. For Fox News, two of its most widely tweeted
stories were opinion pieces: one by RNC Chairwoman Ronna McDaniel, which was among the very first
17shots in the disinformation campaign, and another by Texas Attorney General Ken Paxton defending
Donald Trump after Twitter added a fact check to one of Trump's many false tweet. For Breitbart and
JustTheNews, we see high attention to stories we describe in Part II, all identifying specific cases of
mail-in voting error or fraud: The Atlanta local Fox affiliate’s story of a ballot application sent to a
residence addressed to their dead cat; a California man who pled guilty to mailing in a ballot in his
mother’s name for three elections after she died.
These evocative anecdotes played a central evidentiary role for the disinformation campaign because
they rendered the accusations of fraud concrete and memorable. In the New Jersey case in particular,
they underwrote a highly racialized framing of the threat. Democrats were left to argue statistics and
harder-to-grasp concepts regarding the negligible proportion of votes affected by these stories. The
map also suggests an unusual pattern of higher attention on Twitter to right-wing outlets than to the
rest of the media ecosystem than we generally have seen for the election and national politics topics,
where the New York Times, Washington Post, and CNN are typically larger than Fox News or Breitbart.
Because of its atypical structure and the large impact of tweeting patterns around a small number of
salient stories, we interpret this map with caution. Nonetheless, when we examine the specific stories
that gave rise to this pattern, the map appears to offer some additional support for our conclusion that
the campaign was elite driven, in this case as much by media elites as by political elites.
Figure 7: Mail-in voter fraud stories by Twitter sharing. Node size by the number of unique accounts that tweeted the
stories. Links by co-tweeting patterns (how many times stories from two sites were tweeted by the same person on the
same day).
18Syndicated News Map
One final type of map focuses only on sources that published syndicated news. Our study of the
timeline of stories revealed peaks that included significant duplication of syndicated stories. To study
these more systematically, we ran text analysis on the stories to create network maps of media outlets
based on the frequency and magnitude of replication of their stories. Figure 8A is a map of only those
sites that republish stories that have duplicates in other publications. Each node is a single media outlet.
The nodes are sized by the number of syndicated stories they publish. The links between the nodes
reflect the number of times any two nodes syndicate the same story.8 Two nodes that often publish the
same syndicated stories, say, local newspapers that syndicate the same AP stories, will be closer to each
other, and farther away from a different pair of nodes that publish different syndicated stories--say, two
NPR affiliates that often publish the same stories from NPR. The color of the nodes reflect their
membership in a network community identified by running Louvain community detection. We examined
the sites and stories that form each community, and characterize each group by the major outlets and
duplicated stories they published. The assignment should be taken as approximate, rather than formal,
as each community includes outlets that do not quite fit the generalized description we offer. The three
major communities, blue, yellow, and green, all include some stories from the AP, and are distinguished
by what other sources they also mix in. The blue community at the center consists primarily of AP
syndication by local newspapers and some local television and national sites. The yellow community
reflects primarily local media that are part of Gannett’s USA Today Network, replicating USA Today
stories but also reflecting some AP syndication. The green community consists mostly of local television
stations, syndicating a combination of AP materials, CNN reports, and shared stories in group-owned
stations such as Nextar or Hearst Communications. NPR is visible in orange in the bottom left. The gray
cluster on the bottom left is made of Wicked Local publications. Now, these stories are only from the
online sites of the news outlets. For local TV in particular, they are only direct evidence of the online
content offered by those local stations, and at most offer indirect indication of topics that may have also
been covered on television, rather than how these were framed on TV as compared to online.
Nonetheless, given the relatively high trust that survey respondents place in local media, the map does
suggest that syndication, particularly by the AP, local television and its group owners, and Gannet and its
USA Today network, plays a larger role in shaping Americans’ perspectives than current discussions of
how public opinion, focused heavily on social media, generally acknowledge.
8
"Same story" here means the text of the stories are substantially similar, but not necessarily identical. We look for
all pairs of stories where the Jaccard index for the set of unique words in each story is greater than 0.6. Only
stories longer than 100 characters are considered.
19Figure 8A: Map of sites that republish similar stories. Nodes sized by the number of duplicated stories they republish. Links
by co-publication of the same syndicated stories. Color by Louvain community detection.
The potential influence across the media ecosystem that syndication can exercise becomes clear when
we create a projection of the syndication map onto our open web map. Here, in Figure 8B, we take the
basic architecture of the open web map from Figure 3, and project the syndicated communities on it.
The location of each node is precisely where it is in the broad media ecosystem map of Figure 3. The
color, however, is the syndication community each node is part of in Figure 8A. And the size of each
node is also taken from Figure 8A: determined by how many syndicated stories about mail-in voter fraud
that site published. What figure 8B suggests is that syndication plays a particularly important role
precisely for those publications that are not the national heavyweights, but rather are the local news
sites and TV stations that seek to communicate with people where they live.
20You can also read