Partisanship, Impeachment, and the Democratic Primaries: American Political Discourse, January - February 2020
←
→
Page content transcription
If your browser does not render page correctly, please read the page content below
Partisanship, Impeachment, and the
Democratic Primaries: American Political
  Discourse, January - February 2020
                  The Harvard community has made this
               article openly available. Please share how
               this access benefits you. Your story matters

Citation              Faris, Robert, Justin Clark, Bruce Etling, Jonas Kaiser, Hal Roberts,
                      et al. 2020. "Partisanship, Impeachment, and the Democratic
                      Primaries: American Political Discourse, January - February 2020."
                      Berkman Klein Center for Internet & Society.

Citable link          https://nrs.harvard.edu/URN-3:HUL.INSTREPOS:37366068

Terms of Use          This article was downloaded from Harvard University’s DASH
                      repository, and is made available under the terms and conditions
                      applicable to Other Posted Material, as set forth at http://
                      nrs.harvard.edu/urn-3:HUL.InstRepos:dash.current.terms-of-
                      use#LAA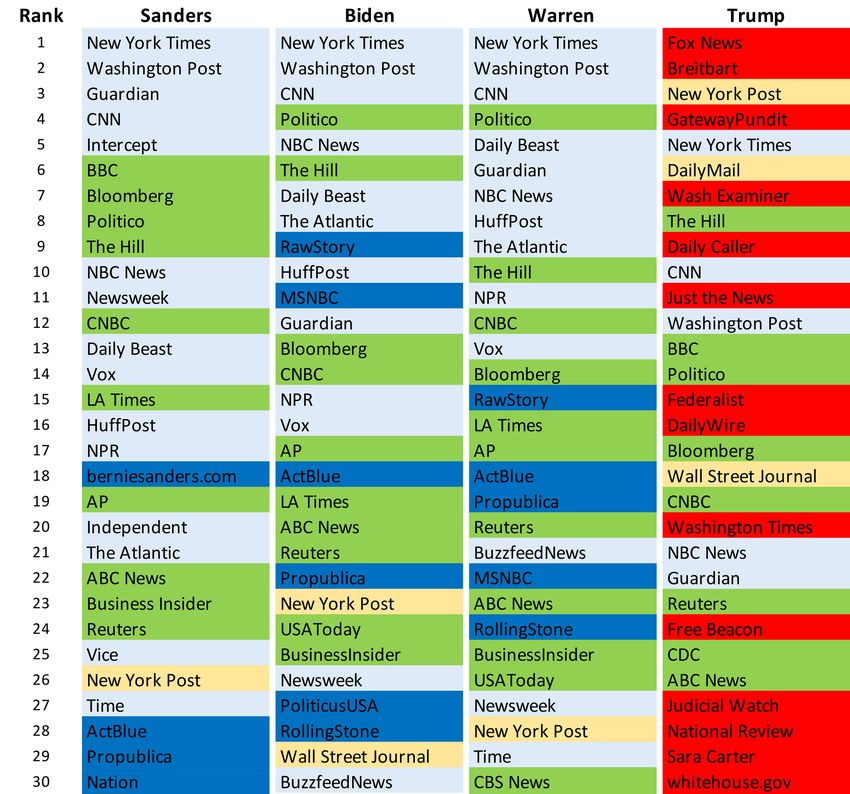
ROBERT FARIS • J U S T I N C L A R K • BRUCE ETLING • JONAS KAISER
HAL ROBERTS • CAROLYN SCHMITT • CASEY TILTON • YOCHAI BENKLER

   PARTISANSHIP, IMPEACHMENT,
   AND THE DEMOCRATIC PRIMARIES:
   AMERICAN POLITICAL DISCOURSE
   JANUARY-FEBRUARY 2020

   PUBLIC DISCOURSE IN THE U.S. 2020 ELECTION
This report is the product of a collaboration between the Public
Discourse in the U.S. 2020 Election project at the Berkman Klein Center
for Internet & Society and the Technology and Social Change project at
the Shorenstein Center on Media, Politics and Public Policy. The project
  was funded by grants from Craig Newmark Philanthropies, the Ford
            Foundation, and the Open Societies Foundations.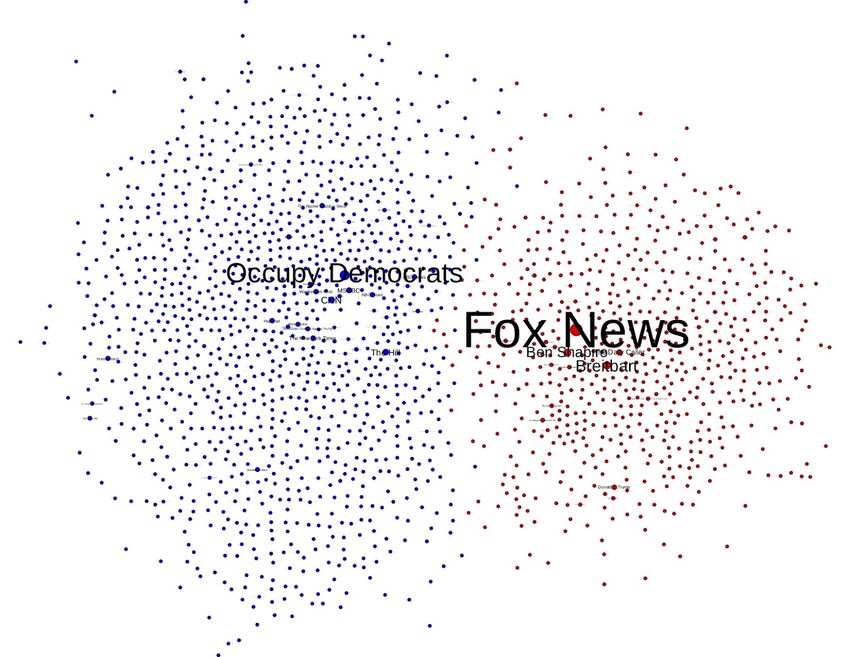
Table of Contents

Executive Summary                                                       2

Introduction                                                            5

Asymmetric Polarization & the Structure of Media Systems in the U.S.    8

Media Attention Among Political Partisans                              25

Political Public Discourse, January - February 2020                    29

   Perspectives and data sources                                       29
   January 2020                                                        31
      Open web media links                                             32
      Facebook                                                         42
      Candidate-aligned Twitter Cohorts                                44
   February 2020                                                       50
      Open web media links                                             50
      Facebook                                                         55
      Candidate-aligned Cohorts on Twitter                             56
   Teflon Joe and the Long Shadow of Burisma                            60

Conclusions                                                            65

                                                                            /
Executive Summary
              he decisions voters will make at the ballot box on November 3, 2020 will be in uenced in
              no small part by the media coverage of the candidates and issues, including the reporting
              by journalists, the media personalities and pundits on radio and television, text messages
              and campaign phone calls, podcasts, political ads, and for many, the incessant ow of
social media posts of friends and family. In this report, the rst of a series of reports that cover the
months running up to the November election, we track political discourse in the United States for
January and February of 2020, the period of time just before (Covid-19) began to dominate political
discourse. We also describe the longer-term structure of political media ecosystems in the United States
that shape public discourse by curating, amplifying, and propagating political stories and narratives to
distinct political audiences.

The agenda of political media in January and February 2020 centered on the impeachment of the
president, the Democratic primaries, and the killing of Qasem Soleimani. This agenda was picked up
throughout the media ecosystem, but there were stark di erences across the media camps in the
framing and narrative contours applied to these topics, presenting radically di erent depictions of the
underlying evidence, facts, and interpretation of events. These di erences between media spheres that
often extend beyond spin and emphasis re ect and reinforce the depth and strength of the divide in
American politics.

Mainstream media described in great detail the rationale for impeaching the president, while in
right-wing media the ‘call was perfect’ and the impetus for impeachment was a concocted charade, a
witch hunt, to illegitimately overturn the 2016 election. Mainstream media described a rash decision
by President Trump to order a missile strike on General Soleimani that was then sold to the American
public on the false pretenses of a clear and imminent threat of attack against United States embassies.
Conservative media hailed the killing as a decisive strike against adversaries that has unquestionably
increased American security and standing in the world.

While mainstream media coverage devoted similar levels of attention to the Democratic primaries and
the impeachment of the president in January, and a majority of their attention to the primary race in
February, politically engaged users on social media were more focused on partisan one-upmanship. For
Democrats, attention was directed at the impeachment and the missteps of Trump and his
administration, and in February, the intervention of Attorney General Barr and the Department of
Justice in the sentencing of Roger Stone. Republicans, in turn, focused their attention on
time-honored political foes: Nancy Pelosi and the Democratic leadership, Hillary Clinton, and the
hostile and biased mainstream media. The patterns of attention on both sides are consistent with a
view that negative partisanship plays a dominant role in American politics. Trump supporters on

                                                  [2]

                                                                                                           /
Facebook provided an exception to the pattern of negative coverage where celebratory videos of
appearances and events of Trump were popular.

Negative polarization spilled over into the Democratic primary race, which came down to a battle
between progressives pursuing a platform of aggressive action on healthcare, climate change, and social
and economic justice versus those that put regaining the White House above all else and saw a
moderate candidate as a better bet. The media coverage promoted by Sanders supporters placed major
focus on the candidate and his policy positions. In contrast, Biden supporters were oriented towards
negative coverage of Trump. The outcome of the Democratic race is in keeping with the tenet that
negative partisanship dominates American politics.

Conservatives in America appear to have survived the barrage of negative coverage from mainstream
media with their partisan perspectives and belief systems intact. This is not because conservative media
erected an impermeable barrier against negative coverage from the center and left. Politically engaged
conservatives were informed of the damaging coverage, but were unfailingly o ered a reinterpretation
and reframing of events and a plausible alternative narrative designed to preempt any second thoughts
about allegiance to party and president. In de ecting and reframing negative coverage, the tactics
employed by conservative media follow a well-developed pattern: downplay the validity of the story;
de ect attention to the other side; attack the integrity and motives of sources; reinforce distrust in
media outside of the right wing; and invoke a strong partisan framing to activate political identity.

The formidable narrative crafting power of conservative media is employed not as a mechanism for
accountability among its participants and leaders and not to police against disinformation and
substandard reporting. Instead, it is wielded as a bu er against external in uence and against deviance
from the party line. This leaves the system vulnerable to misleading and false reporting and to those
propagating conspiracies, such as the Gateway Pundit and True Pundit. Hyperpartisan media sources,
which thrive on outrage and frequently misinform their audiences, play a prominent role in
conservative media. On the left, partisan and hyperpartisan outlets play a much smaller role and less
frequently propagate stories uncon rmed by mainstream media.

The biggest change we observe in these rst two months of 2020 compared to the election cycle of four
years ago is the degree to which conservative media activists have shaped mainstream media coverage.
In 2016, right-wing media activists succeeded in in uencing mainstream coverage of Hillary Clinton,
particularly on the unsubstantiated allegations of wrongdoing associated with the Clinton
Foundation, which exacerbated and fed upon coverage of her emails and fueled suspicions of
corruption and dishonesty. In the current election cycle, conservative media activists rolled out the
same playbook that was so successful in 2016. This time, the corruption allegations were focused on
Joe Biden, his son Hunter, and their dealings with Ukraine and China. This story was picked up by
mainstream media in 2019, but the core allegation—that Joe Biden pressured Ukraine to remove a
prosecutor in order to protect his son—fell apart under scrutiny. By January 2020, while conservative

                                                  [3]

                                                                                                           /
media continued to push out exaggerated and false claims, the dominant mainstream framing of this
story had shifted to Donald Trump’s abuse of his presidential power for his own political gain, which
overshadowed the well-established and misguided actions of Hunter Biden to cash in on his father’s
name. The discredited allegations of corrupt dealings by Joe Biden were getting no play in mainstream
media. While conservative media continues to exhibit a remarkable capacity for reframing news
coverage to align with the beliefs and perceptions of its core audiences, in January and February of
2020, its power to shape mainstream media coverage was diminished compared to 2016. This is the
most notable change we observe and has the potential to alter the electoral calculus in the November
election.

                                                 [4]

                                                                                                        /
Introduction
     n November 2020, voters in America will decide whether Donald Trump is elected to a second
     term as president or whether the o ce is turned over to Joe Biden. Also at stake is control of the
     two houses of Congress. The decisions voters will make at the ballot box are shaped in no small
     part by the media coverage of the candidates: the reporting by journalists, the media personalities
and pundits on radio and television, text messages and campaign phone calls, podcasts, political ads,
and for many the incessant ow of social media posts of friends and family.

In this report, the rst of a series of reports that cover the months running up to the November
election, we track political discourse in the United States for January and February of 2020. Here, we
describe the structure of political media ecosystems in the United States and cover the period ending
just before the novel coronavirus (Covid-19) fundamentally reshaped public debate and the nature of
the election, and capture the dynamics of the Democratic primaries leading up to the emergence of Joe
Biden as the Democratic candidate. Our future reports will include substantial coverage and focus on
Covid-19, and in particular, how competing political narratives shape discussion of the pandemic and
the economic collapse it has wrought. By February, we are already seeing that discussion and
interpretation of the pandemic is highly polarized and asymmetric breaking along political lines,
consistent with our observations about the 2016 election and the rst year of the Trump presidency in
our earlier work. In this report, we bring our understanding of the shape of the political media
ecosystem up to date, and anchor our future reports in a picture of the American political media
ecosystem just before the pandemic. We show that, consistent with our observations of the past several
years, political narratives, facts, and falsehood are propagated through the asymmetrically polarized
American media ecosystems. The empirical basis for this report is the analysis of approximately 3.8
million stories published on more than 116 thousand media sources in addition to analyzing more
than 12.6 million Facebook posts and 1.8 million tweets. We monitor the cross-linking behavior of
these many media sources and track the attention they garner by politically engaged audiences on
Twitter and Facebook.

We show that the highly polarized and asymmetric political and media structures in the United States
continue to demonstrate remarkable stability and resilience. We describe how partisan media is able to
create and sustain political narratives that de ect and reframe bad political news, no matter how
blatant or damaging, and how conservative media created su cient cover for Trump to withstand
impeachment. In the current structures of political discourse in the U.S., with one side ruled by the
propaganda feedback loop, facts and evidence are no match for partisanship.

The political coverage in January and February revolves around two axes of contention. One axis lines
up two alternative paths for the Democratic Party: one focused on nding the most electable candidate

                                                   [5]

                                                                                                           /
to maximize the chances of winning in November, and the other to run on an ambitious progressive
platform to transform U.S. policy on health care, climate change, and social inequality. We know now
that the just-beat-Trump approach, embodied in the Biden campaign, won over the progessive
revolution approach, which was manifest most clearly in the Sanders campaign. The second axis of
contention, oriented around the Democratic and Republican contest in November, had already taken
shape while the Democrats worked through their primaries. For the Democrats, this took the form
primarily as a referendum on the job performance of President Trump. The Republican approach
appears so far to be a faithful replication of the 2016 election: disquali cation of the Democratic
candidate as corrupt, scandal-plagued, and in failing health.

In the deeply fractured American political landscape, partisans on both sides see this election as a
make-or-break battle for the future of the country. Many conservatives see this as a repeat of the “Flight
93 Election”—a last chance to save America from the radical left. For liberals and progressives, the
election seems like a battle to prevent further deterioration of democracy in America and a slide into
authoritarianism. As we will show in the patterns of media attention among politically engaged
Americans, the political fractures of the United States continue to be characterized more by negative
polarization—a deeply held dislike and distrust of the other side—than enduring loyalty to political
leaders and party.

Looked at from our current vantage point many months into the Covid-19 pandemic that has taken
more than 200,000 lives and thrown the country into a severe recession, the rst two months of the
year seem tame. Yet the events of the rst two months of 2020 represent an extraordinary time in the
American political sphere: the impeachment and eventual acquittal of President Trump; the killing of
Qasem Soleimani and the threat of war with Iran; the rapid acceleration and apparent resolution of the
Democratic primaries; and as February progressed, American political attention turning to the
emergence of what would turn out to be the worst public health crisis in a hundred years.

There have been two constants throughout: the irreconcilably partisan interpretation and reporting on
events from the disparate reaches of the media ecosystem, and the obsessive attention trained on the
antics of President Trump.

While the world has been turned on its head in 2020, the political and media systems that create, lter,
amplify, and propagate political news operate in the same manner they have for many years. For the
past ve years, media coverage and political discourse in the United States have revolved around Donald
Trump, beginning with his heterodox but ultimately successful campaign for presidency. The
investigations into the interactions between Russia and the Trump campaign and the e orts to
obstruct these investigations had already begun when Trump took o ce in early 2017 and consumed
the next two years, culminating in the release of the Mueller report in the spring of 2019. Several
months later, in September of 2019, at a time when political attention would normally be dominated
by the run-up to presidential primary elections, details emerged about the July 2019 phone call

                                                   [6]

                                                                                                             /
between President Trump and President Zelensky of Ukraine in which Trump asked for Ukraine to
open an investigation into Joe Biden and his son Hunter. The apparent abuse of o ce dissolved the
reluctance of House Democrats and Speaker Pelosi to initiate impeachment proceedings without GOP
support. The impeachment inquiry was launched by the House of Representatives on September 24.
Trump would eventually be acquitted by the Senate in early February, but this ensured that he would
be at the center of the stage in the political drama.

We are now many long months into the coronavirus pandemic that has overturned normal political
and social life around the globe. The bitter debates over the impeachment of President Trump that
  lled the airwaves and news columns in the fall and winter are a distant memory, as is the January 3
U.S. airstrike that killed Qasem Soleimani, the commander of Iranian Quds Force, and the retaliatory
strike on a U.S. airbase in Iraq that brought the U.S. and Iran dangerously close to war. The novel
coronavirus (Covid-19) has also overshadowed the presidential election cycle for much of 2020 at a
time when political attention has been usually xed on the race for the White House. A constant in
these extraordinary times is the omnipresent Trump as the center of attention, as the lightning rod of
hope and fear over navigating a course through this crisis, and as a source and target of political
partisanship and vitriol. Another constant is the intertwined political and media systems that have
provided parallel, alternative semiotic lters for these events that o er very di erent interpretations of
political events, facts, salience, impact, and consequence. These parallel systems have so far weathered
events unchanged, made possible by the onslaught of critical coverage of President Trump from
traditional media and the epistemic closure of the right, the orientation and actions of each sphere
serving to reinforce the bipolar structure of American media systems.

                                                   [7]

                                                                                                            /
Asymmetric Polarization and the Structure
of Media Systems in the U.S.
he mapping and analysis of political media ecosystems in the United States that we present
here extends and updates work that we carried out around the 2016 presidential election
and the rst year of the Trump presidency.1 Our ndings, many of which carry through to
today, build upon the core observation that American media is not only polarized but is
highly asymmetric. The structures and practices of conservative media, which have evolved over many
decades to reach their current state, are fundamentally di erent from the integrated media system that
includes media sources from the center to the left. The majority of attention from conservative
audiences is to media sources that play by partisan rules and serve primarily conservative audiences,
resulting in what we call the propaganda feedback loop. Attention from the left gravitates towards
traditional media sources and is grounded in the standards and practices of professional journalism.
In order to study the complex interactions of media in the United States, we collect data on the
interactions between media sources and employ network analysis tools to assess and visualize the
underlying structure of these systems. And while there is no single perspective that can fully capture
the nuances and dynamics of media, we combine several approaches that together o er a more
complete picture.
A key step that we draw upon throughout the analysis is the estimation of the position of media
sources on the ideological scale as measured by the sharing patterns of Twitter users.2 As a feature of the
network maps we present later, we assign each media source to one of ve quintiles according to their
estimated ideology score: left, center-left, center, center-right, and right. And in describing the
distribution of attention to media across the political spectrum, we divide media sources into 20 bins.
To estimate these media ideology scores, we start by calculating the relative position on the political
spectrum of approximately 15,000 Twitter users that were active between January 2019 and June 2019.
This estimation technique produces a continuum of ideology scores but no internal point of reference
to help us ascertain how these scores align with common understandings of political valence, e.g.,
where the center point is or how one might distinguish users on the right and left from those in the
center. In order to do so, we divide users into two groups, right of center and left of the center. The
center point is derived from the intersection of users that self-identify in their pro le as being either
liberal or Democrat on one side and conservative or Republican on the other. The nal step is to
1
Benkler et al., “Study: Breitbart-led right-wing media ecosystem altered broader media agenda”
https://www.cjr.org/analysis/breitbart-media-trump-harvard-study.php; Faris et al., “Partisanship, Propaganda, and Disinformation:
Online Media and the 2016 U.S. Presidential Election” https://cyber.harvard.edu/publications/2017/08/mediacloud; Benkler, Faris, and
Roberts, Network Propaganda https://global.oup.com/academic/product/network-propaganda-9780190923631?cc=us&lang=en&
2
Media ideology scores are available to download at https://cyber.harvard.edu/research/2020-election-study-resources-data
[8]
/tabulate the sharing of media sources by users on the right and compare that to users on the left to
generate a continuous metric on a -1.0 to 1.0 scale. The center point, 0.0, denotes an equal share of
users on both sides sharing a media source in a month. A score on the far left, -1.0, means that a media
source is shared only by users on the left, and a score of 1.0 would denote shares only by users on the
right. These proportions are used to create quintiles, which we use to describe the ideological position
of media sources and to color media sources on maps. For media sources in the center, stories are
shared at similar rates by users from the left and right, the center-right and center-left are shared at 2:1
and 1:2 ratios of right to left, respectively, and the right and left are stories that are shared at at least
ratios of 4:1 and 1:4. Reuters, for example, has a score near 0.0 and is therefore in the center. The NYT
has a score of -0.27, putting it in the center-left. The Wall Street Journal has a score of 0.21, which
places it just inside the threshold for in the center-right. Fox News is on the right with a score of 0.75.
Mother Jones and the Daily Kos, which have scores of -0.87 and -0.88, respectively, are in the left bin.
On the hyperpartisan left are Occupy Democrats (-0.96) and PoliticusUSA (-0.90). On the
hyperpartisan right, Breitbart (0.93), the Federalist (0.96), and the Gateway Pundit (0.97). We de ne
hyperpartisan media sources as those that almost entirely serve only one side of the spectrum. The
media ideology scores we use in the report are based on data compiled for the rst six months of 2019,
taking the average of the six monthly periods of sharing data. The ideology position of a selection of
major media outlets is shown in Figure 1, plotted against the number of media outlets that have cited
the media source in the 15 month period January 2019 through March 2020.
Figure 1. Position of media sources on ideological spectrum
[9]
/We next turn to the analysis and mapping of stories related to the election on the open web. The data
collection, analysis, and network maps were developed using the Media Cloud platform. Media Cloud
is an open platform for the analysis of online media that provides free access, through code, web tools,
and data, to over one billion stories from about 60,000 regularly crawled sources.3 We start by
compiling a corpus of more than 3 million election-related stories published starting January 1, 2019
using Media Cloud. The story collection process begins by running a seed query on the Media Cloud
archive for stories that include the name of any of the major candidates and mention of Republicans or
Democrats.4
In addition to these stories from the Media Cloud archive, we included all stories collected via a
separate process from Twitter that matched the same query. Building on this initial set of stories, we
then followed all the links from within the substantive text of these stories using an automated spider
and added stories that matched the same query. This recursive spidering process continued for 15
iterations, at which point an insigni cant number of new stories were found. This corpus of stories
served as the basis for analysis and is used to study the linking patterns among the more than 100,000
media sources. These open web media sources include a broad range of media sites, campaign sites,
nonpro t organizations such as think tanks and advocacy organizations, government sites, company
sites, and blogs.
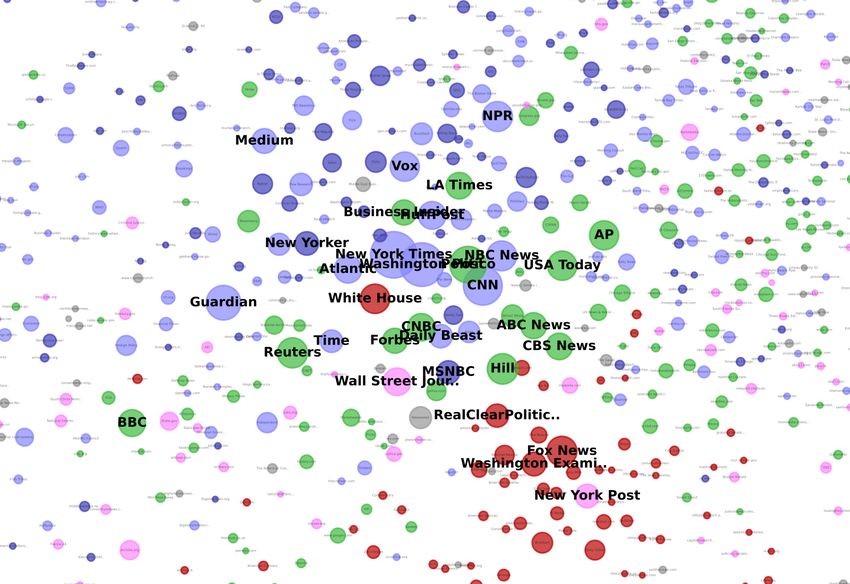
The rst network map we create is based on the cross-linking between media sources that cover politics
in the United States (Figure 2). The nodes in this open web map are media sources, and the size of the
nodes represents the number of media sources that link to each media source over the time period. The
relative prominence of media sources on these open-web network maps is a function of the judgments
by online media producers about which sources are worthy of citation. The architecture of the open
web map is based on the linking pattern between the media sources. For any pair of media sources, the
greater the number of other media sources that link to them both, the closer they are drawn together
by the model. The colors applied to the nodes on the map are based on the media source ideology
scores described earlier. Red denotes right; pink is center-right; green is center; light blue is center-left;
and dark blue is left.
3
https://mediacloud.org/
4
The query used to identify relevant open web stories, tweets, and Facebook posts is: trump OR clinton OR obama OR
repub* OR democrat* OR biden OR ( sanders AND ( bernie OR senator) ) OR ( harris AND ( senator OR kamala ) ) OR
( warren AND ( elizabeth OR senator ) ) OR buttigieg OR beto OR booker OR ( castro AND ( julian OR julián ) ) OR (
gabbard AND ( tulsi OR representative ) ) OR ( yang AND andrew ) OR klobuchar OR gillibrand OR ( bullock AND (
steve OR governor ) ) OR ( bennet AND ( michael OR senator ) ) OR blasio OR inslee OR hickenlooper OR ( delaney
AND ( john OR representative ) ) OR ( ryan AND ( tim OR representative ) ) OR ( williamson AND marianne ) OR
(bloomberg AND (michael OR mike OR mayor))
[10]
/Figure 2. Network map of media sources based on media links
Media ecosystems in the United States include two interconnected but distinct spheres. This is visible
when we observe the cross-linking behavior of media sources, as shown in Figure 2. The largest nodes
in this network map—each node represents a media source—are the sources that are most cited by
other media sources. Together, they produce a network structure that is guided by the decisions of
authors and editors: a distinctly media-driven view of these ecosystems and, in that sense, more
authoritative than other perspectives we will show that are based on the sharing behavior of social
media users. The physical location of media sources in this map is dictated by the commonality in the
inlinks from other media sources. Those nodes that receive inlinks from the same media sources are
drawn closer together; media sources decide which other media sources belong together.
The largest cluster of nodes sits on the left-hand side of the map and includes media sources from the
center, center-left, and left quintiles. The New York Times, Washington Post, and CNN are the most
prominent, followed by Politico, The Guardian, The Hill, and Reuters. Fox News anchors a cluster on
the right-hand side of the map and consists of media sources that are predominantly from the right
quintile.
[11]
/Compared to the center-left, there are very few media sources that belong to the center-right quintile.
A de ning feature of the American media ecosystem is the stunted center-right; compared to the other
segments, it is smaller and less prominent. By media inlinks, the Wall Street Journal is the top
center-right publication and is in the top 20 overall just after the AP, Hu Post, and Atlantic. The
unmistakably conservative orientation of the Wall Street Journal’s editorial board serves audiences on
the right, while its reporting—often critical of the Trump administration—caters more to the left than
the right. The location of the Wall Street Journal in the center-right is primarily a function of serving
the right and left with di erent products, not by publishing stories and perspectives that cut down the
middle. The New York Post, the other anchor of the center-right, although farther right than the Wall
Street Journal, is more popular on social media with its sensational tabloid journalism. Moreover, the
map shows that the New York Post has moved substantially to the right from the position it occupied
in the 2016 election in similar maps. While its engagement patterns on Twitter still mark it as a
center-right outlet, the patterns of linking from the other side have shifted its geographic location on
the map from somewhere between Fox News and the mainstream, and pulled it ever deeper into the
right-wing part of the ecosystem. When we investigate the top stories in January and February, it
becomes clear that the NY Post has published some highly partisan false narratives, such as the Hunter
Biden Burisma conspiracy or the “Deep State Snakes slither back into swamp” story attacking
witnesses at the Trump impeachment hearings. In contrast, the location of the Wall Street Journal on
the map shows it to be more closely embedded with media on center and center-left than the right. The
location of Real Clear Politics re ects the links to its coverage of polls coming from all sides, despite its
designation as a right media source based on Twitter sharing practices, which re ects the orientation of
the articles that they curate on the site.
Overall, the ideology scores are aligned with the architecture of this link-based network with a few
interesting anomalies. One is the White House, which by Twitter sharing patterns appears conservative
but occupies a central location in the map as media outlets link to the site as a primary source of news
from the executive branch. MSNBC is another media source that appears in an unexpected location.
MSNBC is located in a central location in the network as it not only serves the partisan left but also
acts as a source of legitimacy when its stories resonate with the right. Two relevant examples of the
latter are James Carville expressing pessimism over the prospects of Democrats winning back the White
House after the Iowa primaries5 and a 2014 story describing the unabashed and deeply troubling
racism of President Lyndon Johnson.6
Shifting our perspective to that of social media, we see broad similarities in the asymmetric polarization
of the ecosystem but a greater separation between the sides and greater in uence of partisan and
5
https://www.msnbc.com/the-beat-with-ari/watch/-wake-up-dem-vet-calls-for-party-to-be-more-relevant-diverse-after-iowa-chaos-78129
221946
6
https://www.msnbc.com/msnbc/lyndon-johnson-civil-rights-racism-msna305591
[12]
/hyperpartisan media sources. In the Twitter map (Figure 3), the size of the nodes represents the
number of users that share stories from that site. The edges, or links between the nodes, which
determine the structure of the network, represent the relationships among the nodes and are based on
the sharing patterns of Twitter users. We create a link between two sites each time a single Twitter
handle shares a story from each of those two sites on the same day. If a user shares stories from
Breitbart and the Daily Caller on the same day, or Vox and Slate, this signals shared attention to the
two media sources. The proximity of any two media sources on the map is determined by the number
of accounts that share both sites on the same day. The map is based on a sample of 1.8 million tweets
that matched the same query used for selecting open stories.
The asymmetric polarization is more pronounced when we view the media ecosystem based on activity
patterns on social media platforms. The attention patterns of social media users o er a distinctly
di erent vantage point of media preferences, removed from the standards and practices that in uence
the linking patterns of media sources. Although not representative of the electorate at large, the
attention patterns of social media users o er some insight into audience interests, particularly
politically engaged users. Not only is the relative prominence of many media sources di erent on social
media, but the separation of the two media spheres is much starker and more pronounced.
Figure 3. Network map of media outlets based on Twitter shares
The architecture of political activity on Facebook is represented by four di erent types of network
maps. Two network maps show the relationship of media sources, which appear as nodes on the maps.
In one map, the size of the nodes is based on the sum of all interactions to stories from these media
[13]
/sources (Figure 4). In the other map, the size of the nodes is based on the number of accounts that
share a link to stories from these media outlets (Figure 5). Two other maps depict the location and
prominence of the Facebook accounts that post content with which users interact, for example liking,
sharing, or commenting upon a post. In these maps, each node is an account. In one version, the sizing
of the nodes is based on total interactions (Figure 6). In the other, by number of subscribers (Figure 7).
We generate Facebook media source maps using a method similar to that of the Twitter maps. We start
by collecting all Facebook public posts from Crowdtangle that include the set of election topic terms
described above.7 In this paper, we rely on over 12.6 million Facebook posts from over 386,000
accounts that were gathered between January 2019 and September 2020 that include at least one link
and that are also in English. We include data from both groups and public pages. Public pages include
popular media outlets, brands, and high pro le individuals. These pages or groups typically have over
10,000 interactions but can include public pages or groups that Crowdtangle users have added. We
refer to these pages and groups collectively as “accounts” in this report. The Facebook entities that
account for the largest number of user interactions are the public pages of media outlets. The edges in
the data set, which re ect the relationship between media sources and determine the architecture of the
map, are accounts that link to any two media sources. To reduce the number of edges, we only include
those that occur on the same day (e.g., an account that includes posts that link to USA Today and
Bloomberg on the same day). We also remove obvious foreign language content and then limit the set
of posts to only those that include a link in the post.
We then convert the two-mode network of Facebook accounts and media source domains to a
one-mode network of media sources, where domains are close to one another on the network when
they have shared audiences on Facebook. In other words, the map shows overlap in media source
citation by accounts such that media sources that have similar audiences are grouped together.
As shown in Figures 4 and 5, the Facebook media source maps follow similar structural contours to the
link-based maps. Media sources from the center, center-left, and left comprise an integrated cluster that
gravitates towards the large traditional media outlets of the center-left. The right occupies a separate
region with Fox News as the principal node in the cluster. The two most in uential media outlets of
the center-right on Facebook, the New York Post and Daily Mail, are adjacent to the right-wing cluster.
On Facebook, the Wall Street Journal is less prominent that the Daily Mail. The sizing of the nodes in
the overall network, and within each cluster, vary substantially across the two media source maps. With
nodes sized by total interactions (Figure 4), the right appears more active on Facebook, and the Daily
Wire emerges as a major node of activity just after Fox News. The other view with nodes sized by the
number of accounts that link to a given media source (Figure 5), the center-left is more prominent in a
pattern that is closer to the open web linking map shown earlier, although conservative media still
represents a stronger counterbalance to the media on the left and center-left in the Facebook map.
7
Data from CrowdTangle, a public insights tool owned and operated by Facebook.
[14]
/Figure 4. Map of media sources based on total interactions on Facebook
Figure 5. Map of media sources based on unique links on Facebook
[15]
/The Facebook accounts maps (Figures 6 and 7) are created in a similar fashion to the media sources
map. We take the same set of election-related Facebook posts from Crowdtangle that include links to
media sources in their posts and transform that two-mode network of accounts and media sources into
a network where Facebook accounts are nodes and an edge is created between accounts each time two
accounts link to the same media source. Accounts that frequently link to the same media sources are
drawn closer together in the network. In the accounts maps, nodes are sized in two ways: by total
interactions to each account’s posts and by number of subscribers to the account. Nodes are colored
based on louvain community detection.8
Both accounts maps show a familiar pattern of polarization seen in the other maps. In the version with
nodes sized by total interactions (Figure 6), Fox News, along with Ben Shapiro and Breitbart, anchors
the right cluster, and the Occupy Democrats Facebook page anchors the left cluster, along with a
handful of o cial accounts from more mainstream news sources. The large number of interactions on
the public pages of Fox News, Ben Shapiro, and Breitbart is concentrated on content produced by the
respective media outlets. The account pages e ectively serve as cheering sections for the stories and
videos put out by Fox News, Breitbart, and the Daily Wire. A substantial portion of the interactions
on the Occupy Democrats page is also in reaction to their own content, including the a liated site
Washington Press. Unlike their conservative counterparts, the Occupy Democrats page also curates
and posts content from other media sources, which in turn garner a sizable number of interactions
from the more than 10 million followers of the Occupy Democrats page. This explains why Occupy
Democrats is both a primary location of activity on the left but not among the top sites in the media
source maps.
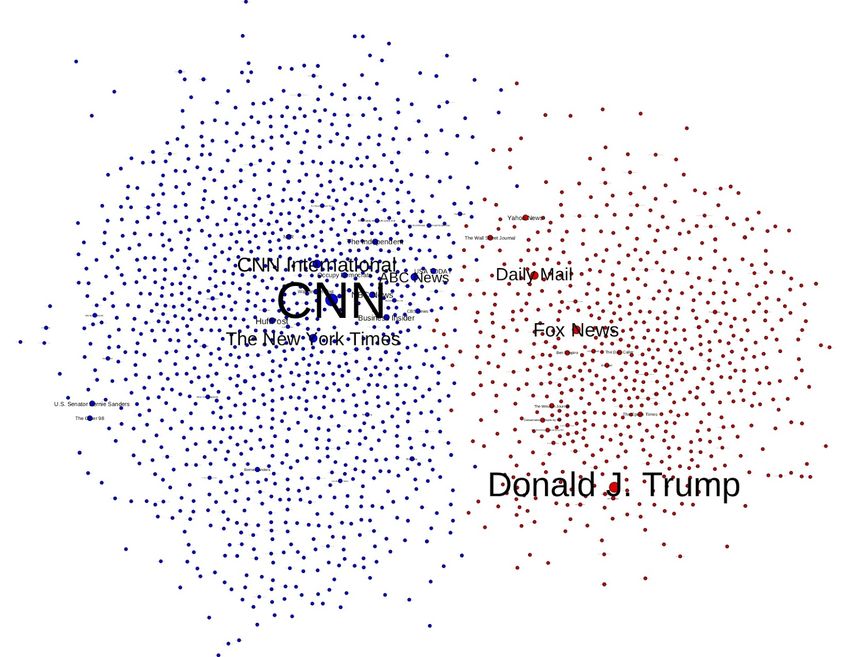
The accounts map with nodes sized by the number of subscribers reshu es the inferred prominence of
accounts on Facebook. Donald Trump’s account is a major node on the right sites but sits apart from
Fox News, the anchor of conservative media. On the left, CNN is the principal node followed by other
mainstream media organizations: the New York Times, ABC News, NBC News, and the Washington
Post. There is no single authoritative measure for assessing in uence and reach on Facebook, which
looks di erent according to the measure of in uence one chooses to use.
8
Blondel et al., “Fast Unfolding of Communities in Large Networks.” https://doi.org/10.1088/1742-5468/2008/10/P10008
[16]
/Figure 6. Map of Facebook accounts, nodes sized by total interactions
Figure 7. Map of Facebook accounts, nodes sized by subscribers
[17]
/Assessing activity on Facebook is complicated not only by the array of ways in which users interact
with content and one another on the platform but also by data limitations. Our visibility into
Facebook is based on the data provided through CrowdTangle. Developed as an independent tool for
tracking activity on Facebook, CrowdTangle was acquired by Facebook and is available free of charge
to news publishers and academic researchers.9 The data provided through the CrowdTangle web site
and API is limited to activity on public pages and groups. A CrowdTangle browser plug-in also
provides metrics that aggregate public and private activity, giving us the ability to compare the overall
level of private and public activity. CrowdTangle tabulates metrics on the various types of interactions
with posts on public pages and groups: likes, shares, comments, and a ective responses (love, sad,
angry, wow, haha, cares). These di erent types of engagement are summed up into an aggregate total
called interactions. The most common way in which researchers and digital media watchers report on
Facebook activity is total interactions. This sums up all the engagements by users associated with the
posts across di erent accounts that include a given resource, which might be the URL to a particular
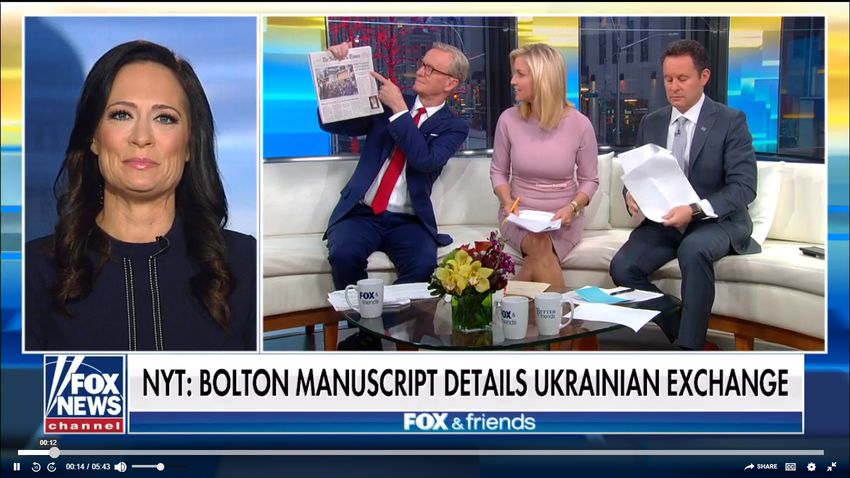
story or text that matches a search query. As an example, a popular story on October 9, 2020,
according to CrowdTangle data, is a Fox News story about House Speaker Nancy Pelosi proposing
legislation that would create a commission enabling Congress to remove a president based on the 25th
Amendment. The story had accrued just over 313,000 total interactions on public groups and pages
and a total 450,000 interactions when accounting for both public and private spaces. A majority of the
public interactions occurred on Facebook pages belonging to Fox News, contributing about 270,000
of the 313,000 interactions. This includes the main Fox News page and its more than 18 million
followers and Fox & Friends with more than 2 million followers. Other major sources of interactions
were the Facebook pages of Ami Horowitz, a documentary lmmaker and right-wing activist,
accounting for 11,000 interactions, and Bret Baier, supplying another 4,000 interactions. The
distribution of interactions from di erent pages are highly concentrated towards a handful of pages, a
pattern that is consistent for stories on Facebook. Interaction data re ect primarily the enthusiasm
among fans and loyalists of the pages pushing out content. For media stories, the single biggest source
of interactions is typically the media outlet’s main Facebook page, followed by any other pages a liated
with the outlet. The number of interactions with a Fox News story, for example, is driven primarily by
the interactions that occur on their several a liated pages. The same appears true of most media
sources. The total interactions metrics say less about the spread of the story across the platform (the
number of unique accounts linking to a story) and more about the level of interest, excitement, or
outrage it engendered among the media sources followers.
The numbers of interactions to posts on Facebook are impressive. However, we are unable to look
more deeply into these numbers with Crowdtangle. The source of engagements on the platform is
essentially a black box. Like all other researchers using these metrics to make assertions about the
popularity of in uence of di erent sites on Facebook, we have no idea how many accounts are
9
https://help.crowdtangle.com/en/articles/4201940-about-us
[18]
/responsible for these engagements, how many of them reside in the United States, and how many of
them are humans with enough genuine interest in a story about Nancy Pelosi and the 25th
amendment to move their mouse and engage with the content. Smart media promoters are doing what
they can to boost these numbers working either within or outside of the rules of the platform, and
Facebook is doing its best to counteract e orts to arti cially in ate this type of activity on their
platform. We don’t know who is winning. That doesn’t completely negate the usefulness of this data,
but it does mean we need to be cautious in the conclusions we draw from it.
Another way to assess the popularity of a story, video, or image on Facebook is to monitor how many
di erent Facebook pages and groups post the content. We use this approach as a complement to the
interaction data. This metric will better re ect the extent to which a story spreads across the Facebook
platform outside of the places that core supporters frequent. The metric we use is based on unique
posting of story links, such that each page or group only counts once even if they post a story many
times. This metric deliberately discounts the intensity of activity on the pages of media outlets. In this
study, we report both of these metrics. While both of them—total interactions and unique links—tell
us interesting things about Facebook activity, we don’t believe that either of these metrics alone fully
and accurately captures attention to news items on the platform.
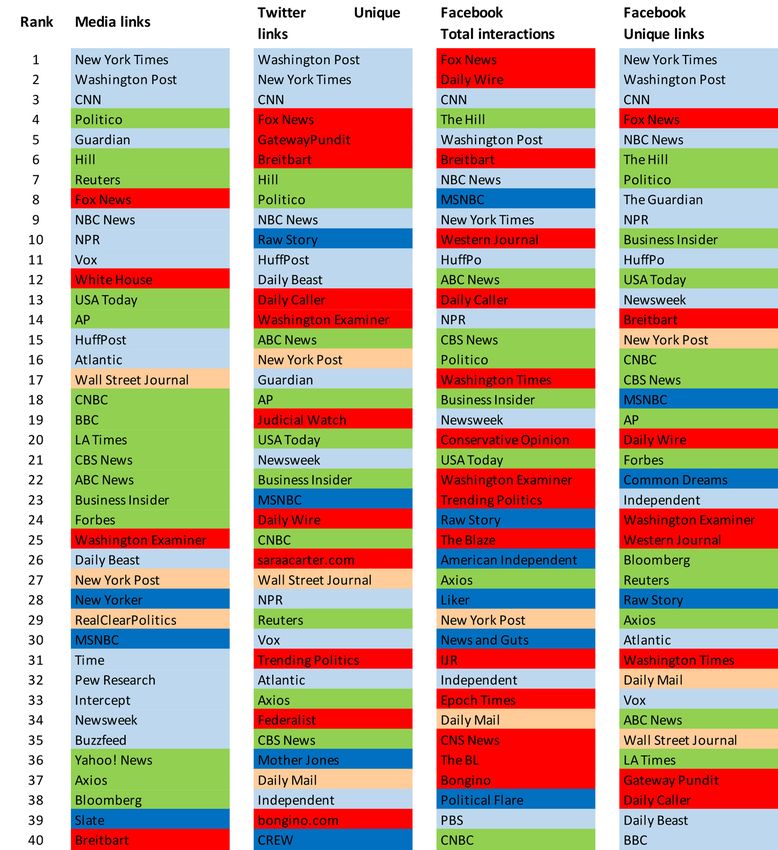
In Table 1, we see that there is a common core of key media sources that are important in the link
economy and on social media as well, including the New York Times, the Washington Post, CNN, Fox
News, Politico, The Hill, The Guardian, and NBC News. Another set, for example Vox, Reuters,
NPR, and The Atlantic, rank high among their peers (by inlinks) but lose ground on social media.
Others gain visibility on social media, notably Breitbart and the Daily Caller, two mainstays of
conservative media that are rarely cited in the link economy. The Gateway Pundit and Raw Story do
well on Twitter while Newsweek, the Daily Wire, Western Journal, and Common Dreams fare better
on Facebook.
[19]
/Table 1. Media sources ordered by media inlinks, unique links on Twitter, total interactions on Facebook,
and unique links on Facebook
[20]There is a marked di erence in the order of media sources based on the two Facebook metrics. Using
the unique links, the distribution of outlets and dominance of center and center-left publications is
more similar to the media inlinks perspective. However, the total interactions data depict a media
system with conservative media playing a more important role led by Fox News and the Daily Wire
with Breitbart and Western Journal also in the top ten. One does not need to doubt the enthusiasm
among conservative media audiences to be skeptical of this result. To take the interaction data at face
value suggests that levels of conservative engagement are substantially higher on Facebook than on
other platforms and that Facebook serves as a special vector for right-wing political energy that is not
replicated in its full e ect on other digital venues. We do not have access to data that would allow us to
con rm or discon rm this. In the absence of better data, and noting the importance of Facebook in
political discourse, we will report both metrics in this report.
Our data from the 2016 election showed a relatively high proportion of hyperpartisan clickbait on
Facebook, even compared to Twitter. This has changed signi cantly since then, with a decline in the
prominence of clickbait sites on Facebook but without diminishing the presence of conservative media
on the platform. Since 2016, Facebook has taken actions to reduce the amount of junk news on the
platform, and one of the results of this purge is that media sources on the platform have to work within
tighter guidelines. Some partisan media outlets have made accommodations in order to stay relevant on
Facebook. One example is Western Journal that was heavily penalized by Facebook and has since made
enough concessions to Facebook to remain on the platform.10 One of the media sources on the top
engagements lists, The BL, was removed from Facebook in December 2019 for running a network of
more than 600 accounts that arti cially promoted content from the Epoch Times.11
As described in prior work,12 these asymmetrically polarized media structures have evolved over many
decades to the current state in which red and blue America have segregated themselves into
functionally separate media worlds, one side informed primarily by large legacy media companies such
as the New York Times and major broadcast networks, CBS, NBC, ABC, NPR, and the other’s
worldview informed by Fox News and a range of conservative media sites such as Breitbart, Daily
Caller, and Gateway Pundit.
The measures of media attention we report in this study align with survey-based perspectives on media
consumption patterns and trust in media. A recent Pew study shows the strong reliance of those who
identify with the Republican Party on Fox News as a source of trusted news.13
10
https://www.nytimes.com/2019/08/21/us/facebook-disinformation- oyd-brown.html
11
https://www.nbcnews.com/tech/tech-news/facebook-says-pro-trump-media-outlet-used-arti cial-intelligence-create-n1105951
12
Benkler, Faris, and Roberts, Network Propaganda;
https://global.oup.com/academic/product/network-propaganda-9780190923631?cc=us&lang=en&
13
https://www.journalism.org/2020/01/24/u-s-media-polarization-and-the-2020-election-a-nation-divided/
[21]
/Figure 8. Trust and reliance on media by political identity. Source: Pew Research Center14
The distribution of attention to media sources across the political spectrum reveals the asymmetry in
U.S. media ecosystems, a pattern that is consistent across the link economy, Twitter, and Facebook.
Our earlier work has shown that media outlets' strategies and reporting are shaped by the media
ecosystem within which they operate.15 Partisan media oriented toward conservative audiences
function in a media ecosystem in which outlets compete for attention by serving identity-consistent
narratives and policing each other for deviation from that line. Partisan media on the left, because they
operate in a single larger media ecosystem with center-left and centrist outlets, operate in a media
ecosystem functioning under a “reality check” dynamic, where they compete for audiences in part by
o ering identity-consistent narratives, but they are more constrained to fact-based reporting by the
competitive pressures from other outlets in the same media ecosystem. This dynamic characterizes all
media in this larger part of the ecosystem, with di erent outlets trading o identity consistent narrative
and framing for practices consistent with mainstream professional journalistic ideals to di erent
extents and drawing di erent mixes of attention. Because of their prominence and capacity to
legitimate whatever they report, media sources occupying middle portions of the spectrum produce
reporting and opinion that gets attention from all sides of the spectrum. While always far from perfect,
14
https://www.journalism.org/2020/01/24/u-s-media-polarization-and-the-2020-election-a-nation-divided/
15
Benkler, Faris, and Roberts, Network Propaganda;
https://global.oup.com/academic/product/network-propaganda-9780190923631?cc=us&lang=en&
[22]
/media organizations that follow standard journalistic practices and operate in a media ecosystem where
their deviations from fact are policed by their direct competitors tend to report news more accurately
and o er a rmer grounding in facts to hold political leaders accountable for their actions and
statements. Partisan media on the right operates more consistently on a model that at best is reserved
for opinion pieces and editorials in the rest of the media ecosystem, and at worst functions in a
completely di erent framework, more akin to propaganda outlets in non-democratic countries than to
media, including media outlets with clear political a liation, in democratic countries. There are
left-oriented outlets in the United States that try to replicate this model, but they do not occupy a
similar standing in the center left portion of the media ecosystem as do their counterparts on the right.
Figure 9. Distribution of attention to media sources by ideological position by media inlinks, unique links
on Twitter, unique links on Facebook, and total interactions on Facebook.
Figure 9 shows how attention to media sources is distributed across the political spectrum using four
di erent metrics of attention: media links, unique shares on Twitter, unique shares on Facebook, and
total interactions on Facebook. In each of the four gures, the attention that accrues to each media
source is associated with the location of the media source on the ideology spectrum, divided into 20
bins, and attention is then summed across the media sources that occupy each bin. In the upper left
gure, we see that the distribution of media inlinks follows an asymmetric pattern. The eighth bin, the
center-left bin closest to the center, has the greatest number of media inlinks. The New York Times,
[23]
/Washington Post, and CNN—the top three recipients of media inlinks—are located in this bin. Among
the bins on the right, the greatest number of total media inlinks is in the farthest right bin, which is
occupied by Breitbart, Daily Caller, and the Federalist, among many others. Fox News, the single
largest target of media inlinks on the right is in the bin that is third from the right. The asymmetric
pattern holds when tracking link sharing on Twitter and Facebook, and interactions on Facebook. On
social media, the distribution of attention is more polarized and more asymmetric. In each of the
views, we see that conservative media is dominated by partisan sites. This includes many hyperpartisan
sites: media sources that cater almost entirely to one side. The center of attention and focus for the rest
of the media ecosystem is on media organizations governed by professional standards or partisan
media. There are some partisan media sources that primarily serve left-oriented audiences, for example,
Raw Story. Others fall into the hyperpartisan class, such as PoliticusUSA and Occupy Democrats, as
their attention draws almost exclusively from the left. An important di erence in partisan media on the
left and right is that partisan media generally, and hyperpartisan media in particular, plays a less
important part of the media diet of liberals and Democratic supporters. Partisan media on the left, by
virtue of being a minor player in a broader system of media sources including traditional center and
center-left media, are subject to the same systems of accountability. Their stories are scrutinized by
fact-checkers and other media outlets that have the respect and attention of their audiences. By
contrast, audiences on the right pay less attention to fact checking sites and tend to cite favorable fact
checks while ignoring those that are unfavorable.16 As a result, fact checking appears to exert practically
no e ect on the reporting of sites in that media ecosystem, a fact that helps to explain why
hyperpartisan sites can thrive in that media ecosystem in a way they have not managed to thrive on the
left.
This is the media architecture in the U.S. that has permitted one side to be convinced that Donald
Trump abused his o ce in his 2019 dealing with Ukraine and obstructed the House inquiry into his
conduct, while the other side concluded that this was a legitimate expression of presidential power.
These media structures inform and justify not only key public policy decisions but also the political
decisions of the electorate. In today’s public health crisis, these personal decisions impact personal
health and economic wellbeing, in some cases, literally life and death decisions. We show in the
following sections how the asymmetry polarized media in the U.S. propel public discourse related to
the 2020 election and guide collective understanding of current events.
16
We show evidence of this pattern in a companion report that covers March through May 2020.
[24]
/Media Attention Among Political Partisans
s we described earlier, the attention patterns of social media users o er insights into the
interests and preferences of politically and digitally active audiences and provide an
important alternative perspective not captured by the linking patterns of media outlets.
In order to track the attention of di erent political cohorts as another vantage point on
political discourse, we created sets of Twitter users that align with speci c candidates. To delineate
these user cohorts, we rely on their retweeting of candidates, which is a strong signal of political a nity.
Drawing on data collected during the month of October 2019, we randomly selected a set of 1000
users that had retweeted Biden, Sanders, Trump, or Warren at least twice during the month,
respectively, to generate four cohorts of Twitter users. Monitoring the media source sharing patterns of
these user cohorts, we see how attention to media sources di ers between Trump supporters on
Twitter and those of the major Democratic candidates.
Table 2 shows which media sources are most commonly shared among the di erent user sets. There is a
common set of media sources from the center and center-left that are among the most shared by all
groups on Twitter. Also on that list is one media source from the center-right: the New York Post.
Another set from the center, center-left, and left are not in the Trump list but are found in common
among the Sanders, Biden, and Warren sets, including NPR, AP, Hu Po, the Daily Beast, and Vox
(Table 3). The Trump set devotes much of its sharing to conservative news sites, outlets that receive
scant attention from the left. The concentration of attention from the politically engaged on the left is
primarily to center and center-left media sources and much less to sites on the left; moreover, the sites
identi ed as “left” to which Sanders or Warren supporters pay attention are action sites
(berniesanders.com; ActBlue) or ProPublica, joined in the case of Sanders supporters by the Nation.
Another interesting observation is that Biden supporters follow MSNBC more often than Warren
supporters, and Sanders supporters rarely tweet MSNBC stories. Observationally, this seems to
con rm that Sanders supporters perceived MSNBC as supportive of the mainstream of the
Democratic Party and opposed to Sanders. More broadly, media attention on the left is rmly
embedded in the reporting and journalism of the center and center-left, with a small portion of
attention devoted to hyperpartisan sites at the extreme end of the spectrum. Among the Biden,
Sanders, and Warren cohorts, there are strong similarities in their media choices, but there are also a few
notable di erences. The least surprising di erence is the strong showing of The Intercept among the
Sanders cohort as The Intercept has consistently provided coverage supportive of Sanders. The
Intercept is the fth most popular media source in the Sanders cohort. Biden and Warren supporters
were far more likely than Sanders supporters to share stories from PoliticusUSA, one of the only
hyperpartisan sites to gain signi cant attention among the Democratic cohorts.
[25]
/You can also read