Management's Discussion and Analysis - BioSyent Inc - Management's Discussion and Analysis
←
→
Page content transcription
If your browser does not render page correctly, please read the page content below
BioSyent Inc.

Management’s
Discussion and Analysis
For the years ended December 31, 2018 and 2017

March 19, 2019

Corporate Office
Suite 520
170 Attwell Drive
Toronto, Ontario, M9W 5Z5
Canada

Telephone 905.206.0013
Facsimile 905.206.1413
Email: info@biosyent.com
Web: www.biosyent.com
Table of Contents

1          Introduction

1          Forward-Looking Statements
1          Accounting Estimates and Accounting Policies
1          Non-IFRS Financial Measures

2          Overview, Vision, Strategy, and Products
2          Overview
2          BioSyent’s Vision
2          BioSyent’s Strategy
3          Evolution of Strategy
4          Pharmaceutical Business
6          Pharmaceutical Product Cycle
6          Pharmaceutical Product Pipeline
7          Pharmaceutical Business Structure
7          Legacy Business

8          New Capabilities and Awards

9          Key Performance Measures

10         Results of Operations for the quarter and year ended December 31, 2018 and 2017
10         Sales
12         Expenses
13         Earnings Before Interest, Taxes, Depreciation and Amortization (EBITDA)
15         Net Income After Tax (NIAT)
16         Earnings per Share (EPS)

17         Financial Resources and Liquidity

18         Risk Management

BioSyent                                          Management’s Discussion and Analysis – For the years ended December 31, 2018 and 2017   i
23         Disclosure of Outstanding Share Data

24         Commitments
24         Office Leases
24         Purchase Commitments

24         Disclosure Controls

24         Investor Relations Activities

25         Related Party Transactions
25         Key Management Personnel Compensation
25         Transactions with Directors

25         Legal Proceedings

BioSyent                                          Management’s Discussion and Analysis – For the years ended December 31, 2018 and 2017   ii
Introduction
The following discussion of BioSyent Inc.’s (“BioSyent” or the            (“IFRS”). The discussion of financial condition and results of
“Company”) operations, performance and financial condition is             operations should be read in conjunction with the Consolidated
based on the Company’s audited consolidated financial statements          Financial Statements, including the notes thereto. Additional
for the years ended December 31, 2018 and December 31, 2017               information relating to the Company, including the Consolidated
(“Consolidated Financial Statements”), which were prepared                Financial Statements and the accompanying notes can be found at
in accordance with International Financial Reporting Standards            www.sedar.com.

Forward-Looking Statements
This management’s discussion and analysis (“MD&A”) contains               uncertainties that are difficult to predict. Undue reliance should
or incorporates forward-looking statements within the meaning             not be placed on such statements. Certain material assumptions
of Canadian securities legislation (collectively, “forward-looking        are applied in making forward-looking statements and actual
statements”). These forward-looking statements relate to, among           results may differ materially from those expressed or implied in
other things, revenue, earnings, changes in costs and expenses,           such statements. Known and unknown factors could cause actual
capital expenditures as well as changes in other objectives, strategic    results to differ materially from those expressed or implied in the
plans and business development goals, and may also include other          forward-looking statements. Important assumptions, influencing
statements that are predictive in nature or depend upon or refer          factors, risks, and uncertainties are referred to in the body of this
to future events or conditions, and can generally be identified by        MD&A, in the press release announcing the Company’s financial
words such as “may”, “will”, “expects”, “anticipates”, “intends”,         results for the fourth quarters and years ended December 31, 2018
“plans”, “believes”, “estimates” or similar expressions. In addition,     and December 31, 2017 and in BioSyent’s annual and interim
any statements that refer to expectations, projections or other           financial statements and the notes thereto. These documents are
characterizations of future events or circumstances are forward-          available at www.sedar.com.
looking statements. These statements are not historical facts, but        The forward-looking statements contained in this MD&A are
instead represent only BioSyent’s expectations, estimates, and            made as at the date of this MD&A and, accordingly, are subject to
projections regarding future events.                                      change after such date. Except as required by law, BioSyent does
Although the Company believes the expectations reflected in such          not undertake any obligation to update or revise any forward-
forward-looking statements are reasonable, such statements are not        looking statements made or incorporated in this MD&A, whether
guarantees of future performance and involve certain risks and            as a result of new information, future events or otherwise.

Accounting Estimates and Accounting Policies
Effective as of January 1, 2018, the Company has adopted the              using historical experience and various other factors it believes to
requirements of IFRS 9, Financial instruments and IFRS 15,                be reasonable under the given circumstances. In the future, actual
Revenue from contracts with customers. Please refer to Note 3 of the      experience may differ from these estimates and assumptions.
Consolidated Financial Statements for a summary of changes to             BioSyent’s significant accounting judgments and estimates include
the Company’s accounting policies as well as recent accounting            recoverability of asset carrying values, impairment of trade and
pronouncements impacting the Company.                                     other receivables, income taxes, depreciation of equipment,
The preparation of the Company’s consolidated financial                   amortization of intangible assets, share-based payments, inventory,
statements requires management to make critical judgments,                and determination of the transaction price in revenue recognition.
estimates, and assumptions that affect the reported amounts of            For a more detailed discussion of changes to the Company’s critical
revenues, expenses, assets and liabilities, and the disclosure of         accounting estimates, please refer to Note 4 of the Consolidated
contingent liabilities, at the reporting date. On an ongoing basis,       Financial Statements.
management evaluates its judgments, estimates, and assumptions

Non-IFRS Financial Measures
This MD&A makes reference to certain non-IFRS measures.                   to complement those IFRS measures by providing a further
These non-IFRS measures are not recognized measures under                 understanding of the Company’s results of operations from
IFRS and do not have a standardized meaning prescribed by IFRS,           management’s perspective.
and are unlikely to be comparable to similar measures presented           Accordingly, these measures should not be considered in isolation
by other companies. When used, these measures are defined in              nor as a substitute for analyses of the Company’s financial
such terms as to allow the reconciliation to the closest IFRS             information reported under IFRS. Management uses non-IFRS
measure. These measures are provided as additional information            measures such as Earnings Before Interest, Taxes, Depreciation
                                                                          and Amortization (“EBITDA”), Compound Annual Growth

BioSyent                                             Management’s Discussion and Analysis – For the years ended December 31, 2018 and 2017       1
Rate (“CAGR”) and Trailing Twelve Months Earnings per Share in order to facilitate operating performance comparisons from (“TTM EPS”) to provide investors with supplemental measures period to period, prepare annual operating budgets, and to of the Company’s operating performance and thus highlight assess the Company’s ability to meet future debt service, capital trends in the Company’s core business that may not otherwise expenditure, and working capital requirements. The definition be apparent when relying solely on IFRS financial measures. and a reconciliation of EBITDA, as used and presented by the Management also believes that securities analysts, investors, and Company, to the most directly comparable IFRS measures follows other interested parties frequently use non-IFRS measures in the later in this MD&A. evaluation of issuers. Management also uses non-IFRS measures Overview, Vision, Strategy, and Products Overview BioSyent is a publicly traded specialty pharmaceutical company Hedley Technologies (USA) Inc., also wholly-owned subsidiaries which, through its wholly-owned subsidiaries, BioSyent Pharma of BioSyent, operate the Company’s legacy business, marketing Inc. (“BioSyent Pharma”) and BioSyent Pharma International biologically and health friendly non-chemical insecticides (the Inc., sources, acquires or in-licences and further develops “Legacy Business”). BioSyent’s issued and outstanding common pharmaceutical and other healthcare products for sale in Canada shares (the “Common Shares”) are listed for trading on the TSX and certain international markets. Hedley Technologies Ltd. and Venture Exchange under the symbol “RX”. BioSyent’s Vision BioSyent’s vision is to be the leading independent Canadian partnerships. These products are unique due to manufacturing healthcare company focused on commercializing innovative complexities, novel technologies, therapeutic advantages and/ products improving patient lives and supporting healthcare or strong, defendable intellectual property rights. The Company’s providers. strategy allows it to commercialize these products as brands BioSyent is independent and does not have access to large amounts acquired or licensed to it by partners. The Company intends for of capital or a corporate pipeline of products funded by large its products to be differentiated and to improve patient lives. The investments in research and development. BioSyent is focused Company works with, and supports, healthcare practitioners in on innovative products that are sourced through international achieving this objective. BioSyent’s Strategy BioSyent has four key elements to achieving its strategic objectives: 1. Expand the product portfolio 2. Build sales and marketing teams 3. Maximize revenue with international distribution 4. Maintain profitable growth BioSyent Management’s Discussion and Analysis – For the years ended December 31, 2018 and 2017 2
BioSyent has developed sourcing arrangements with partners based      by balancing its investment behind brands with brand revenue and
in the U.S. and Europe. The Company has a flexible format for         growth and by segmenting the market into immediate and long-
such arrangements.                                                    term growth opportunities. It pursues possible reimbursement
The Company seeks long-term buy-sell agreements or in-licensing       avenues for its products in both the private and public sectors.
arrangements with or without royalties or payments linked to          The Company uses various marketing techniques throughout
milestone events such as regulatory approvals or reimbursement by     the product life cycle, as it deems appropriate, including
formularies.                                                          healthcare practitioner detailing, direct to patient information,
                                                                      product differentiation materials, and expansion of patient and
The Company exercises diligence when sourcing new products.           healthcare practitioner support services to increase awareness of
Some of the steps in this process involve reviewing market data       product efficacy and safety. The Company employs a salesforce
and market trends, interviewing key healthcare practitioners or       of qualified sales professionals across Canada with experience in
medical advisory boards and obtaining opinions on reimbursement       pharmaceutical detailing to healthcare practitioners and hospitals.
possibilities with payers. Once the Company has decided to
proceed with a new product opportunity, it acquires or licenses       The Company focuses on medications that occupy a niche in
exclusive Canadian and/or international market rights to that         the market and are unique due to manufacturing complexities or
product. After the acquisition or in-licensing of the product,        novel technological and therapeutic advantages or are backed by
the Company manages the product through the regulatory and            strong partners holding defendable intellectual property rights.
product registration process and, once approved, commercializes       This strategy allows the Company to market these medications as
the product in Canada and/or international markets.                   brands it owns or licenses. By virtue of its strong growth record,
                                                                      the Company is able to attract partners for new products that have
The Company uses various means of reducing risk in the                niche positioning.
marketplace. The Company adopts a gradually accelerating
investment approach in promoting its products in the marketplace

Evolution of Strategy
The Company has not engaged in clinical trials due to the risks       Canada that require additional research and development work
associated with such research activities. From time to time, the      before being launched in the Canadian market. The Company
Company may acquire or in-license opportunities in late-stage         considers opportunities where there is a high probability that
development with which it, or its partners, have significant          additional research and development work is likely to extend the
prior experience. Such experience and competency of the               lifecycle of portfolio products. Such studies might include in vitro
Company and its partners give the Company the ability to gauge        or in vivo studies (including bio-equivalency studies, efficacy
risk in some depth. The Company may also seek in-licensing            studies, or safety studies).
opportunities for new products launched in countries outside of

BioSyent                                         Management’s Discussion and Analysis – For the years ended December 31, 2018 and 2017       3
Pharmaceutical Business
FeraMAX® 150 them with soft foods. This innovative product is based upon the
In keeping with its strategy, the same non-ionic polysaccharide-iron complex technology found in
Company has, through BioSyent FeraMAX®150.
Pharma, launched FeraMAX® Other oral iron products made from common ferrous salts
150 to the Canadian healthcare intended for infants and children either have an unpleasant heavy
market. FeraMAX® 150 is an metallic taste which deters patient compliance or they come in
oral hematinic indicated for the prevention and treatment of iron formulations containing alcohol which healthcare professionals
deficiency anaemia. This non-ionic polysaccharide-iron complex and caregivers prefer to avoid. The Canadian market launch of
formulation reduces adverse side effects common with other iron FeraMAX® Powder in May 2013 was the global introduction
formulations. Shipments of FeraMAX® 150 commenced in April of this product and provides BioSyent Pharma with a unique
2007. offering for international marketing partners. The Company has
FeraMAX® 150 continues to be a strong driver of growth in also launched the product in several international markets through
the Company’s domestic and international pharmaceutical distribution agreements.
business. In 2015, the Company developed and launched a new
Certified Vegan formulation of FeraMAX® 150. In 2016, the Aguettant System®
Company developed a 100mg formulation of FeraMAX® capsules In August 2012, BioSyent Pharma signed
(“FeraMAX® 100”) for distribution in certain markets outside of an exclusive Licensing and Distribution
Canada. Agreement (the “Aguettant Agreement”)
with Laboratoire Aguettant S.A.S.
Cathejell® (“Laboratoire Aguettant”). Pursuant to
In July 2011, BioSyent the Aguettant Agreement, the Company
Pharma received marketing in-licensed three pre-filled syringe (“PFS”)
2% lidocaine hydrochloride jelly, USP products which are medical syringes pre-filled with a specific
approval from Health
Canada for Cathejell®. Cathejell® was in-licensed by BioSyent dosage of medication and marketed to hospitals and acute care
Pharma from Pharmazeutische Fabrik Montavit. Shipments of settings.
Cathejell® commenced in May 2012. In April 2017, BioSyent The Aguettant System® for PFS offers a patented innovation
Pharma extended its in-license agreement with Pharmazeutische that can be used for a variety of injectable medications. The
Fabrik Montavit, giving BioSyent Pharma exclusive Canadian Aguettant System® for PFS features a needleless, glassless, sterile
rights to the Cathejell® product until March 31, 2024. plastic syringe with a ready-to-use dual tamper-evident seal. These
Cathejell® is an innovative pharmaceutical product that combines a products provide hospitals, clinics and healthcare professionals with
sterile gel with lidocaine in a unique collapsible applicator syringe improved patient safety as well as operational efficiencies.
providing a safe and effective solution for patients to ease the Laboratoire Aguettant has been providing innovative and patented
discomfort of a range of medical procedures. Cathejell® is indicated infusion delivery systems to hospitals for more than 100 years. The
for surface anesthesia and lubrication for various procedures Aguettant System® for PFS has been available since 2009 and is
including male and female cystoscopies, catheterizations and other used in several European countries including France, the United
endourethral operations, endoscopies, proctoscopies, rectoscopies, Kingdom and Belgium.
and tracheal intubations.
Cathejell® can also be used for the symptomatic treatment of pain Aguettant System® – Atropine Sulphate
in connection with cystitis and urethritis. Cathejell® has a unique One Aguettant System® urgent care product contains atropine
collapsible syringe design with a trauma-free applicator tip that sulphate, a commonly used drug in emergency situations and
makes it easy to use for healthcare professionals and makes the anaesthetic procedures. The Company launched this product in
application of the drug more comfortable for the subject patient. February 2015 as the first of three drugs for use in urgent care.
FeraMAX® Powder Aguettant System® – Phenylephrine Hydrochloride
In July 2012, BioSyent Pharma In May 2016, the Company received approval from Health Canada
received marketing approval for a new urgent care product, phenylephrine hydrochloride
from Health Canada for its injection, for use in Aguettant System® PFS in hospitals and
unique new oral iron supplement acute care settings. Phenylephrine hydrochloride injection is
FeraMAX® Powder. FeraMAX® Powder is the only oral iron indicated for the treatment of clinically important hypotensive
product available in Canada in a dissolvable powder and comes states, including overcoming peripheral vascular failure (shock, or
in pleasant tasting grape and raspberry flavoured crystals, which shock-like states), maintenance of blood pressure in the setting of
can be conveniently dosed by diluting them in water or mixing
BioSyent Management’s Discussion and Analysis – For the years ended December 31, 2018 and 2017 4anesthesia, drug-induced hypotension, or hypersensitivity with Cysview®
circulatory compromise. The Company commenced distribution In August 2015, BioSyent
of this product in November 2016. Pharma signed a Distribution
Regulatory work on a third urgent care PFS product was and Supply Agreement with
suspended by the Company in 2017 Photocure ASA granting BioSyent Pharma an exclusive license to
import, promote and sell the Cysview® product in Canada.
RepaGyn® Cysview® is a patented, innovative technology that aids in the
In October 2013, the diagnosis and management of non-muscle-invasive bladder cancer.
® Company signed an exclusive
It is designed to selectively target malignant cells in the bladder
Canadian Licensing and and induce fluorescence during cystoscopic procedures using a
Distribution Agreement with Farma-Derma s.r.l. (the “RepaGyn blue-light enabled cystoscope.
Agreement”). Pursuant to the RepaGyn Agreement, the
This technology can lead to a 25% improvement in the detection
Company distributes a women’s health product, RepaGyn®, which
of bladder cancer tumors as compared with traditional white
is an innovative vaginal suppository that has received approval from
light cystoscopy (Burger et al. 2013), leading to a reduced risk of
Health Canada. RepaGyn® helps relieve dryness and promotes
recurrence. Cysview® has been successfully marketed in the U.S.
healing of the vaginal mucosa. It is also recommended in situations
and Europe and was approved by Health Canada in January 2015.
where tissue repair is required after invasive vaginal surgeries and
The Company commenced the Canadian promotional launch of
biopsy procedures. RepaGyn® vaginal suppositories can be used
Cysview® in November 2015.
with or without local hormone therapy.
RepaGyn® is formulated with sodium hyaluronate, a naturally- Cardiovascular Products
occurring compound, and offers a hormone-free treatment In May 2016, the Company signed an exclusive Distribution
alternative proven to deliver symptom relief, restoration of pH Agreement with a European partner for two products in the
balance and tissue repair all in one ovule. cardiovascular therapeutic area for the Canadian market. These
RepaGyn® is supported by clinical evidence of both efficacy products have been approved in Europe and certain other markets
and symptom relief and has been recommended by doctors around the world and are expected to be launched in Canada upon
and successfully used by women in several European countries approval being granted by Health Canada. The Company has made
including Italy, France, Belgium, Switzerland, Denmark and Poland a submission to Health Canada seeking marketing approval of the
for over 10 years under the brand names Cicatridine®, Cicatridina®, products which is currently under review. If approved by Health
Cikatridina®, and Repadina®. Canada, these will be the Company’s first products launched in the
cardiovascular market in Canada.
Proktis-M®
In March 2014, the Company Women’s Health Product
entered into an in-licensing In November 2016, the Company signed an exclusive License and
Rectal Suppositories Sodium Hyaluronate
agreement for exclusive Supply Agreement with a European partner for a new prescription
marketing and distribution rights in Canada of Proktis-M® product in the women’s health therapeutic area for the Canadian
rectal suppositories with Farma-Derma s.r.l. Proktis-M® rectal market. The product has been approved in Europe and in certain
suppositories are designed to help the healing of the anus and other markets around the world and is expected to be launched
rectum. Proktis-M® rectal suppositories, which were launched by in Canada upon approval being granted by Health Canada. The
the Company in November 2014, have been studied and tested Company made a submission to Health Canada seeking marketing
in conditions such as operated severe internal hemorrhoids, anal approval of the product in 2017. The product is currently under
fissures, and prevention of radiation-induced proctitis. review by Health Canada.
Proktis-M® rectal suppositories are formulated with sodium
hyaluronate, a naturally-occurring compound, and offer a
temporary matrix to facilitate cell proliferation which enhances
wound healing. Proktis-M® rectal suppositories can be used on
their own or in combination with other products. Proktis-M®
rectal suppositories are supported by clinical evidence and
have been successfully used to treat men and women in several
European countries.
BioSyent Management’s Discussion and Analysis – For the years ended December 31, 2018 and 2017 5Pharmaceutical Product Cycle
The Company organizes its product lifecycle into six stages: (i) The Company currently has seven products in the growth stage
the in-license stage, (ii) the regulatory stage, (iii) the pre-launch (FeraMAX®150, Cathejell®, FeraMAX® Powder, RepaGyn®, and
stage, (iv) the launch stage, (v) the growth stage, and (vi) the Aguettant System® Atropine and Phenylephrine and Cysview®),
maturity stage. one product in the launch stage (Proktis-M®), and three products
in the regulatory stage subject to Health Canada approval (two
Cardiovascular Products and the Women’s Health Product).
Product Cycle Growth
Maturity
Launch
Pre-Launch
Marketing Maintain
Regulatory investment
Field staff training Life Cycle
Differentiate Develop selling aids Service HCP’s & Management
In-License Hospitals
Med. Advisory Detail HCP’s
Prepare Dossier • FeraMAX® 150
Board • Proktis-M®
• Cathejell®
File with Health
Identify Reimbursement • FeraMAX® Powder
Canada
Due Diligence Production • RepaGyn®
Approval
Negotiate • Aguettant System®
• 2 Cardio Products
Sign Deal • Cysview®
• Women’s Health Product
In Market
Health Canada
Filing/Approval
Pending
Pharmaceutical Product Pipeline
The Company is committed to expanding its product portfolio
and accelerating its product pipeline with a focus on innovative
products that are unique. The Company is currently in discussions
with several potential partners for new pharmaceutical product
opportunities. Although launched in markets outside of Canada,
some of these products may require some additional investment
before the Company seeks approval from Health Canada for the
Canadian market or other international government regulatory
bodies for international markets.
BioSyent Management’s Discussion and Analysis – For the years ended December 31, 2018 and 2017 6Pharmaceutical Business Structure
The Company has three pharmaceutical business units: (i) These three business units, collectively, the “Pharmaceutical
the Community and Women’s Health Business Unit which Business”, are supported by the Company’s Corporate
commercializes pharmaceutical products focused on improving Operations, including the finance, supply chain and logistics,
family and women’s health in Canada (the “Community medical and regulatory affairs, information technology, investor
Business”); (ii) the Hospital Business Unit which sells relations, business development, market access, human resources,
pharmaceutical and healthcare products to Canadian hospitals business intelligence, and legal functions. As the Company expands
and hospital specialists (the “Hospital Business”); and (iii) its product portfolio into new therapeutic areas, new specialty
the International Pharmaceutical Business Unit which sells business units may be established as part of the pharmaceutical
pharmaceutical products to markets outside of Canada (the business structure as and when considered appropriate.
“International Business”).
Core Pharmaceutical Business
Community Non-Core:
& Women’s Hospital International Legacy
Health Business
Corporate Operations
Finance Business Development
Supply Chain and Logistics Market Access
Medical and Regulatory Human Resources
Information Technology Business Intelligence
Legal
Legacy Business
Protect-It®
The Company continues to manufacture
and market Protect-It®, a bio-friendly, non-
chemical, food-safe grain insecticide. Protect-
It® was developed through collaborative
research between the Cereal Research Centre
of Agriculture and Agri-Food Canada. Protect-It® is used as a
preventative treatment against insect infestations in stored grains.
The Legacy Business provides an additional source of stable cash
flows for the Company allowing it to focus on its strategic areas of
growth in the Pharmaceutical Business.
BioSyent Management’s Discussion and Analysis – For the years ended December 31, 2018 and 2017 7New Capabilities and Awards In January 2018, Mr. Larry Andrews and Ms. Sara Elford were Medical Post, Profession Santé, CanadianHealthcareNetwork.ca, elected to the Company’s Board of Directors upon the retirement and ProfessionSanté.ca 2018 Survey on OTC Counselling and of two long-serving Directors, Messrs. Douglas Larson and Milton Recommendations). Wakefield. On May 29, 2018, Mr. Joseph Arcuri was elected to the On September 10, 2018, the Company announced the retirement Company’s Board of Directors at the Company’s Annual General of Mr. Alfred D’Souza as Vice President, Finance and Chief Meeting, replacing Mr. Paul Montador who retired from the Financial Officer of the Company after 12 years of service. The Board on the same date. Mr. Andrews, Ms. Elford, and Mr. Arcuri Company also announced the appointment of Mr. Robert J. each bring extensive experience and strong business acumen to March as successor to Mr. D’Souza in the role of Vice President, the Board. Finance and Chief Financial Officer. In April – December 2018, seven additional Canadian hospital sites On September 13, 2018, the Company adopted Cysview® for blue-light cystoscopy with the Company announced that it had been named to the shipping initial orders for the product to these new customers. A Growth 500 annual ranking of Canada’s total of nine hospital sites in Canada are now operational with fastest-growing companies (formerly Cysview®. known as the PROFIT 500) for the sixth In May 2018, the Company’s FeraMAX® consecutive year based on a five-year brand was named the #1 Doctor and revenue growth rate of 313% (2012 – 2017). Pharmacist recommended over-the- The Company was ranked the 228th fastest- counter oral iron supplement brand growing Company in Canada on the 2018 in Canada for the third consecutive Growth 500 list. year (EnsembleIQ Healthcare Group: Pharmacy Practice + Business,The BioSyent Management’s Discussion and Analysis – For the years ended December 31, 2018 and 2017 8
Key Performance Measures
Key performance measures for the quarter (“Q4”) and full year
(“FY”) ended December 31, 2018, 2017 and 2016 are summarized
in the tables below:
                                                                            Q4 2018           Q4 2017           Q4 2016             CAGR*

Sales                                                                      $ 5,910,965       $ 5,901,488       $ 5,009,668                  9%
Sales Growth %                                                                        0%              18%               30%                   -
Net Income Before Tax                                                      $ 2,168,171       $ 1,949,447       $ 1,561,090                  18%
Net Income Before Tax Growth %                                                      11%               25%               49%                   -
Net Income Before Tax Margin                                                        37%               33%               31%                   -
Income Tax (Current and Deferred)                                            $ 496,761         $ 492,219         $ 466,268                    -
Net Income After Tax                                                       $ 1,671,410       $ 1,457,228       $ 1,094,822                  24%
Net Income After Tax Growth %                                                       15%               33%               44%                   -
Net Income After Tax Margin                                                         28%               25%               22%                   -
Net Increase in Cash and Short-term Investments                            $ 1,820,309       $ 2,829,154       $ 2,336,003                    -
Basic EPS                                                                        $ 0.11             $ 0.10            $ 0.07                  -
Diluted EPS                                                                      $ 0.11             $ 0.10            $ 0.08                  -

* CAGR – Compound Annual Growth Rate – See “Non-IFRS Financial Measures”

Sales CAGR between Q4 2016 and Q4 2018 was 9%. Net Income
After Tax CAGR was 24% between Q4 2016 and Q4 2018.
                                                                            FY 2018           FY 2017           FY 2016             CAGR*

Sales                                                                     $ 21,527,028      $ 20,762,755      $ 17,922,270                  10%
Sales Growth %                                                                        4%              16%               16%                   -
Net Income Before Tax                                                      $ 7,546,806       $ 6,850,164       $ 5,869,855                  13%
Net Income Before Tax Growth %                                                      10%               17%               14%                   -
Net Income Before Tax Margin                                                        35%               33%               33%                   -
Income Tax (Current and Deferred)                                          $ 1,841,420       $ 1,643,887       $ 1,560,350                    -
Net Income After Tax                                                       $ 5,705,386       $ 5,206,277       $ 4,309,505                  15%
Net Income After Tax Growth %                                                       10%               21%               14%                   -
Net Income After Tax Margin                                                         27%               25%               24%                   -
Net Increase in Cash and Short-term Investments                            $ 5,086,666       $ 5,599,149       $ 4,023,810                    -
Basic EPS                                                                        $ 0.39             $ 0.36            $ 0.30                  -
Diluted EPS                                                                      $ 0.39             $ 0.36            $ 0.30                  -

* CAGR – Compound Annual Growth Rate – See “Non-IFRS Financial Measures”

Sales CAGR between FY 2016 and FY 2018 was 10%. Net
Income After Tax CAGR was 15% between FY 2016 and
FY 2018.

BioSyent                                          Management’s Discussion and Analysis – For the years ended December 31, 2018 and 2017       9
Results of Operations for the quarter and year ended December 31, 2018 and 2017
Sales
Sales Overview Business. Despite ongoing import permit issues experienced
during the year, the Company was able to ship several orders to
Q4 2018 vs. Q4 2017 its international customers in Q4 2018, which had been delayed
Total Company sales for Q4 2018 were $5,910,965. Despite being from earlier in the year. This quarterly decline in International
a record quarter for the Company, Q4 2018 sales increased only Business sales combined with modest growth in Q4 2018
marginally as compared to total Company sales for Q4 2017 of Canadian pharmaceutical sales, resulted in a 1% growth rate in the
$5,901,488. Pharmaceutical Business overall for Q4 2018 when compared to a
Canadian pharmaceutical sales for Q4 2018 were $5,035,460, growth rate of 18% in the Pharmaceutical Business for Q4 2017.
increasing 2% compared to Canadian pharmaceutical sales for Q4 Legacy Business sales for Q4 2018 were $25,307, decreasing 73%
2017 of $4,937,297. compared to Legacy Business sales for Q4 2017 of $95,274. Q4
Pharmaceutical sales in the International Business for Q4 sales are typically lower than the first three quarters of the year due
2018 were $850,198, decreasing 2% compared to International to the seasonality of the Legacy Business.
pharmaceutical sales for Q4 2017 of $868,917, which were Below is a summary of the Company’s sales by business for the
the highest quarterly sales ever recorded by the International eight most recently completed quarters:
Q4 2018 Q3 2018 Q2 2018 Q1 2018 Q4 2017 Q3 2017 Q2 2017 Q1 2017
Sales
Pharmaceutical Business 5,885,658 4,991,210 5,542,621 4,331,479 5,806,214 4,799,039 5,075,518 3,652,834
Growth% vs. prior year period 1% 4% 9% 19% 18% 15% 27% 3%
Legacy Business 25,307 268,283 366,802 115,668 95,274 604,561 560,887 168,428
Growth% vs. prior year period -73% -56% -35% -31% 10% 4% 54% -25%
Total Sales 5,910,965 5,259,493 5,909,423 4,447,147 5,901,488 5,403,600 5,636,405 3,821,262
Growth% vs. prior year period 0% -3% 5% 16% 18% 13% 29% 1%
FY 2018 vs. FY 2017 A decline in Legacy Business sales growth for FY 2018 also
Total Company sales for FY 2018 were $21,527,028, increasing 4% hampered the Company’s consolidated sales growth for the year.
compared to total Company sales for FY 2017 of $20,762,755. Legacy Business sales for FY 2018 were $776,060, decreasing
by 46% compared to Legacy Business sales for FY 2017 of
Canadian pharmaceutical sales for FY 2018 were $18,541,645,
$1,429,150. Environmental and commodity market conditions had
increasing 10% compared to Canadian pharmaceutical sales
an adverse impact on FY 2018 sales for the Legacy Business.
for FY 2017 of $16,856,703. This growth was generated across
the Company’s product portfolio with significant year-over- Sales Mix
year growth from the Company’s Hospital Business portfolio of
The Pharmaceutical Business accounted for 96% of total sales in
products. Despite significant growth, these growth stage Hospital
FY 2018 while the Legacy Business accounted for 4% of total sales.
Business products account for a notably lower percentage of the
This sales mix is in line with management’s focus on continuing
Company’s total Pharmaceutical Business as compared to more
to grow the Pharmaceutical Business while supporting the Legacy
established growth stage products in the Community Business.
Business in a limited way, though market conditions (discussed
While the Company’s core Canadian pharmaceutical business below) had an unusual adverse impact on Legacy Business sales in
continued to grow during the year, pharmaceutical sales in the FY 2018.
International Business for FY 2018 were $2,209,323, decreasing
11% as compared to International pharmaceutical sales for FY Legacy Business Sales Trend
2017 of $2,476,902. This decline in growth was due to delays Legacy Business sales for Q4 2018 were $25,307, decreasing by
experienced during the year in obtaining the necessary permits to 73% compared to Legacy Business sales for Q4 2017 of $95,274.
export product to a particular international market. This decline Legacy Business sales for FY 2018 were $776,060, decreasing
in International Business sales countered growth in Canadian by 46% compared to Legacy Business sales for FY 2017 of
pharmaceutical sales, resulting in a comparatively modest growth $1,429,150. Legacy Business customers are generally less responsive
rate of 7% in the Pharmaceutical Business overall for FY 2018 to marketing and promotion, with demand for grain insecticides
versus a growth rate of 16% in the Pharmaceutical Business for influenced more by weather conditions, prices of agricultural
FY 2017. inputs, the quality and quantity of the food grain harvest, and
BioSyent Management’s Discussion and Analysis – For the years ended December 31, 2018 and 2017 10the level of infestation of stored grain. Adverse conditions in the 2018. Historically, such year-to-year variability in sales volumes
largest market for Protect-It® negatively impacted sales during of Protect-It® is not unusual, having been experienced on a few
occasions in the past.
Pharmaceutical Sales Trend
Pharmaceutical Sales By Quarter
6,000,000
5,000,000
4,000,000
CAD
3,000,000
2,000,000
1,000,000
3,090,211
4,185,311
2,343,008
2,893,162
3,004,888
3,229,276
3,336,024
4,068,225
3,779,349
3,546,608
4,008,467
4,922,773
3,652,834
4,799,039
5,806,214
4,331,479
5,542,621
4,991,210
5,885,658
5,075,518
0
14 14 14 14 15 15 15 15 16 16 16 16 17 17 17 17 18 18 18 18
20 20 20 20 20 20 20 20 20 20 20 20 20 20 20 20 20 20 20 20
Q1 Q2 Q3 Q4 Q1 Q2 Q3 Q4 Q1 Q2 Q3 Q4 Q1 Q2 Q3 Q4 Q1 Q2 Q3 Q4
Quarter
International Sales Canadian Sales
Record pharmaceutical sales for Q4 2018 were $5,885,658, In the Hospital Business, Q4 2018 Canadian sales volumes (units)
increasing 1% compared to total pharmaceutical sales for Q4 of the Cathejell® product declined by 6% versus Q4 2017 while
2017 of $5,806,214, which increased 18% compared to Q4 sales volumes (units) of Aguettant System® PFS products increased
2016. Q4 2018 pharmaceutical sales increased by 18% over Q3 by 208% versus Q4 2017 as a result of a shortage in supply of
2018 pharmaceutical sales of $4,991,210, which is typical for the competing urgent care products in the market. This intermittent
Company’s fourth quarter sales. This seasonal pattern occurred as urgent care product shortage continued into 2019 and is expected
an increase of 21% in Q4 2017 versus Q3 2017 pharmaceutical to continue to positively impact sales of the Company’s PFS
sales and as an increase of 18% in Q4 2016 versus Q3 2016 products in 2019. Sales volumes (units) of the Company’s growth-
pharmaceutical sales. stage hospital product, Cysview®, also increased by 900% versus
Q4 2017 as seven new hospital sites implemented Cysview® during
Canadian Pharmaceutical Sales: 2018, with two of these sites going live in the fourth quarter.
Q4 2018 vs. Q4 2017 FY 2018 vs. FY 2017
Canadian pharmaceutical sales for Q4 2018 were $5,035,460, Canadian pharmaceutical sales for FY 2018 were $18,541,645,
increasing 2% compared to Canadian pharmaceutical sales for Q4 increasing 10% compared to Canadian pharmaceutical sales for
2017 of $4,937,297 which increased 12% compared to Q4 2016. FY 2017 of $16,856,703 which increased by 12% compared to
In the Company’s Community Business, Q4 2018 Canadian FY 2016.
sales volumes (units) of FeraMAX® 150 decreased by 5%, while In the Company’s Community Business, FY 2018 Canadian
FeraMAX® Powder sales volumes (units) increased by 1% versus sales volumes (units) of FeraMAX® 150 and FeraMAX® Powder
Q4 2017. Sales volumes (units) of the RepaGyn® product increased increased by 4% and 6%, respectively, over FY 2017 while sales
by 16% in Q4 2018 over Q4 2017. volumes (units) of the RepaGyn® product increased by 22% over
FY 2017.
BioSyent Management’s Discussion and Analysis – For the years ended December 31, 2018 and 2017 11In the Hospital Business, the Company’s established Cathejell® FY 2018 vs. FY 2017
product and Aguettant System® PFS products continued to grow Pharmaceutical sales in the International Business for FY 2018
in FY 2018 with sales volumes (units) increasing 10% and 133%, were $2,209,323, decreasing 11% as compared to International
respectively, versus FY 2017. Sales volumes (units) of Cysview® Business pharmaceutical sales for FY 2017 of $2,476,902 which
also increased by 333% versus a low base in FY 2017 as seven increased 60% compared to FY 2016. This decline in growth was
new hospital sites implemented Cysview® during 2018. A total due to delays in obtaining the necessary permits to export product
of nine hospital sites in Canada are currently using Cysview® for to the Company’s largest international market. Permits were
blue-light cystoscopy with a further eight hospital sites in various obtained in Q4 2018 and much of the order backlog was shipped
stages of implementation. While the Company has experienced a to customers in 2018. As the Company continues to manage the
long selling and implementation cycle for Cysview®, management additional distribution and regulatory complexities inherent to the
is encouraged by the rate of adoption and implementation of the International Business and to adapt its business model to changing
product by Canadian hospitals in the second half of 2018. market conditions, management expects the import permit issues
faced in 2018 to persist. As such, considerable variability in the
International Pharmaceutical Sales: level of International pharmaceutical sales from one quarter to the
Q4 2018 vs. Q4 2017 next is expected.
Pharmaceutical sales in the International Business for Q4 2018 In spite of this variability, the Company has recorded International
were $850,198, decreasing 2% compared to International pharmaceutical sales in each of the sixteen preceding quarters
Business pharmaceutical sales for Q4 2017 of $868,917 which as the distribution of FeraMAX® has been established in seven
increased by 75% compared to Q4 2016. The Company was able markets outside of Canada. Management is committed to growing
to obtain the required import permits for its largest international the International Business and expanding the number of export
market and shipped several customer orders in Q4 2018, which markets for its products outside of Canada. The International
had been delayed from earlier in the year. As a result, the Business accounted for 11% of total pharmaceutical sales in FY
International Business recorded its second highest ever quarterly 2018 compared to 13% in FY 2017.
sales in Q4 2018.
Expenses
Quarter ended December 31, % Change vs.
2018 2017 Prior Period
Cost of Goods Sold $ 1,409,893 $ 1,390,975 1%
Selling and Marketing $ 1,292,591 $ 1,390,004 -7%
General and Administration $ 1,161,101 $ 1,136,957 2%
New Business Development Costs $ 34,051 $ 46,810 -27%
Subtotal $ 3,897,636 $ 3,964,746 -2%
Finance Income $ (154,842) $ (12,705) 1119%
Total expenses, including the cost of goods sold (“COGS”) primarily due to selling and marketing expenses for Q4 2018 of
and excluding finance income, for Q4 2018 were $3,897,636, $1,292,591, decreasing 7% compared to selling and marketing
decreasing 2% compared to total expenses for Q4 2017 of expenses for Q4 2017 of $1,390,004. The Company incurred
$3,964,746. The ratio of total expenses to sales for Q4 2018 was comparatively higher selling and marketing expenses in Q4 2017
66%, lower than a ratio for Q4 2017 of 67%. This decline was versus Q4 2018 related to its launch-stage hospital products.
Year ended December 31, % Change vs.
2018 2017 Prior Period
Cost of Goods Sold $ 4,952,864 $ 4,788,085 3%
Selling and Marketing $ 5,264,814 $ 5,309,333 -1%
General and Administration $ 4,407,333 $ 4,205,835 5%
New Business Development Costs $ 107,457 $ 79,877 35%
Subtotal $ 14,732,468 $ 14,383,130 2%
Finance Income $ (752,246) $ (470,539) 60%
BioSyent Management’s Discussion and Analysis – For the years ended December 31, 2018 and 2017 12Total expenses, including the COGS and excluding finance based payments of 9% and 92%, respectively, contributed most
income, for FY 2018 were $14,732,468, increasing 2% compared significantly to the overall increase in general and administration
to total expenses for FY 2017 of $14,383,130. The ratio of total expenses. Additionally, the Company incurred a bad debt expense
expenses to sales for FY 2018 was 68%, lower than a ratio for FY of $67,462 related to a former customer outside of Canada, which
2017 of 69%. was included in general and administration expenses. These
This decline in total expenses in relation to sales was primarily increased expenses were partially offset by unrealized foreign
due to selling and marketing expenses for FY 2018 of $5,264,814, exchange gains on foreign-currency-denominated monetary assets
decreasing 1% compared to selling and marketing expenses for FY and liabilities for FY 2018 of $110,281 as compared to unrealized
2017 of $5,309,333. The Company incurred comparatively higher foreign exchange losses for FY 2017 of $60,443. Overall, general
selling and marketing expenses in FY 2017 related to certain and administration expenses remained consistent in relation to
launch-stage hospital products. Selling and marketing expenses sales at 20% of sales for both FY 2018 and FY 2017.
decreased in proportion to sales to 24% for FY 2018 as compared Finance income, including interest income and certain realized
to 26% for FY 2017 as these hospital products, namely Cysview® foreign exchange gains, for FY 2018 of $752,246 increased by
and the Aguettant System® PFS products, generated higher sales in 60% compared to finance income for FY 2017 of $470,539. As
FY 2018 versus FY 2017 while incurring proportionately lower a result of additional cash generation during the year, increased
selling and marketing expenses. investment in short-term GICs, and upward movement in interest
General and administration expenses for FY 2018 were $4,407,333, rates, interest income for FY 2018 of $326,103 increased by 153%
increasing 5% compared to general and administration expenses for as compared to interest income for FY 2017 of $128,740.
FY 2017 of $4,205,835. Increases in employee costs and share-
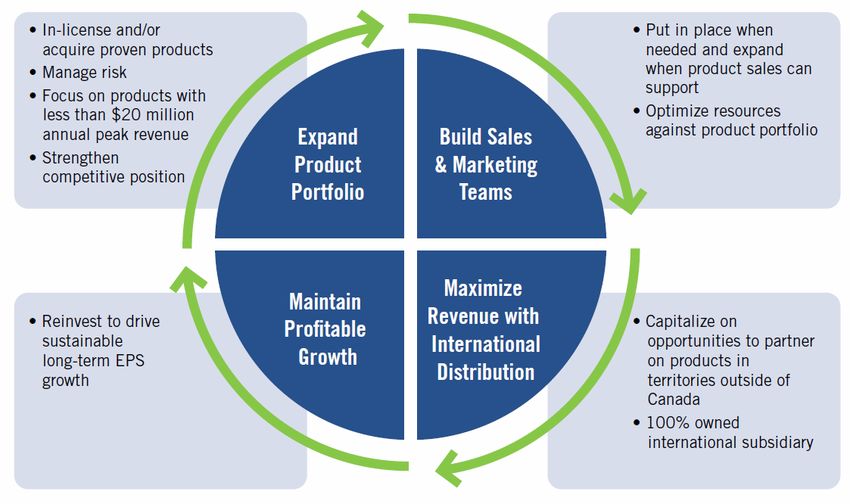
Earnings Before Interest, Taxes, Depreciation and Amortization (EBITDA)
EBITDA is a non-IFRS financial measure. The term EBITDA interest income or expense, income taxes, depreciation and
does not have any standardized meaning under IFRS and therefore amortization. A summary of the Company’s EBITDA for the
may not be comparable to similar measures presented by other quarter and year ended December 31, 2016, 2017, and 2018 is
companies. The Company defines EBITDA as earnings before provided in the graph below:
EBITDA for the Quarter and Year ended December 31
8,000,000
7,405,988
6,910,977
7,000,000 +7%
+17%
5,900,080
6,000,000
+15%
5,000,000
CAD
4,000,000
3,000,000
2,109,998
1,961,159
2,000,000
1,591,047
+8%
+23%
1,000,000
+58%
0
2016 2017 2018
Q4 EBITDA Full Year EBITDA
BioSyent Management’s Discussion and Analysis – For the years ended December 31, 2018 and 2017 13EBITDA for Q4 2018 of $2,109,998 increased by 8% compared Reconciliations of EBITDA to Net Income After Tax (NIAT) for
to EBITDA for Q4 2017 of $1,961,159. EBITDA for FY 2018 of the quarter and year ended December 31, 2018, 2017, and 2016
$7,405,988 increased by 7% compared to EBITDA for FY 2017 of are provided in the tables below:
$6,910,977.
RECONCILIATION OF EBITDA TO NIAT
FOR THE QUARTER ENDED DECEMBER 31
2018 2017 2016
Q4 EBITDA $ 2,109,998 $ 1,961,159 $ 1,591,047
Add: Interest Income 109,164 44,076 19,768
Less: Depreciation of Equipment (26,494) (26,766) (21,220)
Amortization of Intangible Assets (24,497) (29,022) (28,505)
Income Tax Expense (496,761) (492,219) (466,268)
NIAT $ 1,671,410 $ 1,457,228 $ 1,094,822
RECONCILIATION OF EBITDA TO NIAT
FOR THE YEAR ENDED DECEMBER 31
2018 2017 2016
Full Year EBITDA $ 7,405,988 $ 6,910,977 $ 5,900,080
Add: Interest Income 326,103 128,740 116,417
Less: Depreciation of Equipment (87,295) (91,563) (80,925)
Amortization of Intangible Assets (97,990) (97,990) (65,717)
Income Tax Expense (1,841,420) (1,643,887) (1,560,350)
NIAT $ 5,705,386 $ 5,206,277 $ 4,309,505
BioSyent Management’s Discussion and Analysis – For the years ended December 31, 2018 and 2017 14Net Income After Tax (NIAT)
NIAT for Q4 2018 of $1,671,410 increased by 15% compared in Q4 2018 versus Q4 2017, its operating expenses, including
to NIAT for Q4 2017 of $1,457,228 which increased by 33% COGS decreased by 2% during this period and its finance income
compared to Q4 2016. The Company’s NIAT margin for Q4 increased significantly, resulting in an increased NIAT margin for
2018 was 28%, increasing 3% compared to a NIAT margin for Q4 Q4 2018 overall.
2017 of 25%. While the Company’s sales increased only marginally
Sales and Net Income Before & After Tax
For the Quarter ended December 31
5,901,488 5,910,965
6,000,000
+18% 0%
5,009,668
5,000,000
+30%
4,000,000
CAD
3,000,000
2,168,171
1,949,447
2,000,000 +11% 1,671,410
1,561,090 +25% 1,457,228
+49% 1,094,822 +15%
+33%
1,000,000
+44%
-
Q4 2016 Q4 2017 Q4 2018
Sales Net Income Before Tax Net Income After Tax
Including currency translation losses of $24,167, total
comprehensive income for Q4 2018 was $1,647,213, increasing
13% compared to total comprehensive income for Q4 2017 of
$1,458,040.
BioSyent Management’s Discussion and Analysis – For the years ended December 31, 2018 and 2017 15NIAT for FY 2018 of $5,705,386 increased by 10% compared of 25%. While the Company’s sales increased by 4% for FY 2018
to NIAT for FY 2017 of $5,206,277 which increased by 21% versus FY 2017, its operating expenses, including COGS, increased
compared to FY 2016. The Company’s NIAT margin for FY 2018 by 2% during this period and its finance income increased by 60%,
was 27%, increasing 2% compared to a NIAT margin for FY 2017 resulting in an increased NIAT margin for FY 2018 overall.
Sales and Net Income Before & After Tax
For the Year ended December 31
21,527,028
20,762,755
+4%
20,000,000 +16%
17,922,270
+16%
15,000,000
CAD
10,000,000
7,546,806
6,850,164
5,869,855 +10% 5,705,386
+17% 5,206,277
5,000,000 +14% 4,309,505 +10%
+21%
+14%
-
2016 2017 2018
Sales Net Income Before Tax Net Income After Tax
Including currency translation losses of $15,638, total
comprehensive income for FY 2018 was $5,689,748, increasing
10% compared to total comprehensive income for FY 2017 of
$5,182,772.
Earnings per Share (EPS)
Below is a summary of the Company’s quarterly sales, NIAT, and
EPS for the eight most recently completed quarters:
Q4 2018 Q3 2018 Q2 2018 Q1 2018 Q4 2017 Q3 2017 Q2 2017 Q1 2017
Sales ($) 5,910,965 5,259,493 5,909,423 4,447,147 5,901,488 5,403,600 5,636,405 3,821,262
Net Income After Tax ($) 1,671,410 1,270,613 1,620,233 1,143,130 1,457,228 1,294,575 1,552,918 901,556
Earnings Per Share – Basic ($) 0.11 0.09 0.11 0.08 0.10 0.09 0.11 0.06
Earnings Per Share – Diluted ($) 0.11 0.09 0.11 0.08 0.10 0.09 0.11 0.06
Diluted EPS for Q4 2018 was $0.11, increasing $0.01 compared
with diluted EPS for Q4 2017 of $0.10.
Diluted EPS for FY 2018 was $0.39, increasing $0.03 compared
with diluted EPS for FY 2017 of $0.36.
BioSyent Management’s Discussion and Analysis – For the years ended December 31, 2018 and 2017 16Financial Resources and Liquidity
Working capital, defined here as the difference between current it invested $68,155 in property and equipment and $435,870 in
assets and current liabilities, increased by 25% from $20,087,611 intangible assets. The Company advanced loans of $175,000 to
as at December 31, 2017 to $25,138,174 as at December 31, 2018. certain management personnel under its Management Share Loan
Cash and short term investments of $24,425,101 accounted for Program. The Company also expended $606,193 to repurchase
97% of working capital as at December 31, 2018 compared to cash its own common shares for cancellation under a Normal Course
and short term investments of $19,338,435 accounting for 96% of Issuer Bid (“NCIB”) which commenced on December 10, 2018.
working capital as at December 31, 2017. The Company generates By comparison, in FY 2017, the Company generated cash of
sufficient cash and cash equivalents from its operations to supply $6,546,131 from operations and $110,858 upon the exercise of
the working capital it requires to meet its current growth and Company stock options, while investing $91,158 in property and
development activities. equipment and $549,317 in intangible assets. The Company also
During FY 2018, there was a net increase in cash and short advanced $393,860 under the MSLP in FY 2017.
term investments of $5,806,666 compared to a net increase of The graph below illustrates the company’s cash, cash equivalents
$5,599,149 during FY 2017. During FY 2018, the Company and short-term investments as of December 31, 2016, 2017, and
generated cash of $6,286,598 from operations and $100,924 from 2018 as well as the growth over the comparative prior year period:
financing activities upon the exercise of Company options while
Cash, Cash Equivalents and Short-term Investments at December 31
25,000,000 24,425,101
+ 26%
20,000,000 19,338,435
15,000,000
13,739,286 + 41%
CAD
+ 41%
10,000,000
5,000,000
0
2016 2017 2018
Total shareholders’ equity increased by 24% from $22,212,927 at The Company’s total assets at December 31, 2018 were
December 31, 2017 to $27,605,662 at December 31, 2018. This $31,188,491, representing a 24% increase over total assets of
increase is due to total comprehensive income of $5,689,748 $25,104,848 as at December 31, 2017. This was lower than an
generated by the Company in FY 2018, less the value of increase of 30% in total assets for FY 2017 from $19,248,183 at
common shares repurchased for cancellation under the NCIB December 31, 2016 to $25,104,848 at December 31, 2017.
of $745,880, plus the value of share-based payments during the The Company has no short-term or long-term debt; however,
year of $390,388, plus proceeds on the exercise of stock options the Company has credit facilities available with Royal Bank of
during the year of $100,924. By comparison, total shareholders’ Canada totaling $3,090,000, including a foreign exchange facility
equity increased by 33% from $16,726,716 at December 31, of $1,500,000, a credit card facility of $90,000, and a revolving
2016 to $22,212,927 at December 31, 2017 as a result of total demand credit facility of $1,500,000 which had not been utilized
comprehensive income of $5,182,772 generated during FY 2017 as of December 31, 2018. This credit facility bears interest at
plus the value of share-based payments of $192,581, plus proceeds a variable rate of Royal Bank prime plus 0.75% and has been
on the exercise of stock options during FY 2017 of $110,858. secured with a General Security Agreement constituting a first
BioSyent Management’s Discussion and Analysis – For the years ended December 31, 2018 and 2017 17ranking security interest of the Bank in the Company’s property.
The Company is subject to maintaining certain financial covenants
if the demand credit facility is drawn upon.
Risk Management
The Company’s risk management policies and financial results in any forward-looking statements. Accordingly, the Company
are presided over by the Company’s Audit Committee, which cautions the reader not to rely on reported financial information
reports to the Board of Directors of the Company (the “Board”). and forward-looking statements to predict actual future results.
The pharmaceutical industry in which the Company operates is This report and the accompanying financial information should
exposed to several risks due to a strict regulatory environment, an be read in conjunction with this statement concerning risks and
enhanced level of quality consciousness, competition from generic uncertainties. Some of the risks, uncertainties and events that may
drug companies and heightened intellectual property litigation. affect the Company, its business, operations and results are given in
The Company cannot predict or identify all risk factors nor can this section. However, the factors and uncertainties are not limited
it accurately predict the impact, if any, of the risk factors on its to those stated.
business operations or the extent to which a factor, event or any
such combination may materially change future results of the The Company has policies and practices mandated by the Board to
Company’s financial position from those reported or projected manage the Company’s risks. Such risks include the following:
1. Sourcing and Revenue Concentration
Some raw materials used in production are sourced from other pharmaceutical companies, the Company sells its products
a single supplier and the Company is exposed to the same primarily through a limited number of wholesalers and retail
business risks that the supplier may experience. In line with pharmacy chains.
2. Foreign Exchange Risk
The Company currently earns revenue in Canadian dollars future foreign exchange transactions, the Company uses dual
(“CAD”), U.S. dollars (“USD”), and Euros (“EUR”) and incurs currency deposits and forward contracts to manage foreign
costs in Canadian dollars, U.S. dollars, and Euros. Management exchange transaction exposure.
monitors the U.S. dollar and Euro net liability position on an The following tables present foreign exchange sensitivity analyses
ongoing basis during the year and adjusts the total net monetary for the assets and liabilities of the Company denominated in
liability balance accordingly. When it is appropriate to de-risk foreign currencies:
Foreign Exchange Sensitivity Analysis – USD
December 31, 2018 December 31, 2017
Description of Asset/(Liability) USD USD
Cash and cash equivalents 418,338 282,677
Trade receivables 79,577 64,160
Less: Accounts payable (609,106) (577,680)
Net Total (111,191) (230,843)
Foreign Exchange Rate CAD per USD at the end of the year 1.3641 1.2545
BioSyent Management’s Discussion and Analysis – For the years ended December 31, 2018 and 2017 18You can also read