Market Snapshot GROUP - PRIVATE CAPITAL INVESTMENT COLLIERS INTERNATIONAL - Q1 2018
←
→
Page content transcription
If your browser does not render page correctly, please read the page content below

COLLIERS
INTERNATIONAL

      P R I VAT E
      C A P I TA L
  I N V EST M E N T
       G R O UP

  Market
 Snapshot
Q1 2018
Investment in the Canadian commercial real estate market is surging due to
strong market fundamentals, immigration, and a low interest rate environment.
These broader trends paired with focused events of the quarter illustrate the
current state of the market and help determine where it is heading. Ongoing
changes in the market will continue to affect the commercial real estate
industry, influencing both trends and valuations.

     What has happened since January 1st?
     Regulatory, policy and political events that occurred in Q1 2018 will continue
     to shape the market throughout the year, presenting opportunities or risks to
     investors.

                      Toronto City                               The Ontario
                      Council voted to                           minimum wage
                      reduce property                            was increased to
                      taxes by 50%                               $14/hour (set to
                      for creative and                           be increased to
                      cultural hubs                              $15 by 2019)
                      This incentive will encourage              There were mixed feelings
                      landlords to lease to tenants              regarding this policy change,
                      in creative industries that have           as some argue it will lead to
                      been previously priced out of              increased spending and spur
                      the market.                                growth, while others argue
                                                                 employers will pull back on
                                                                 benefits and part-time jobs
                                                                 in order to improve
                                                                 profit margins.

                      Finishing up                               Doug Ford won
                      the 8th Inning                             the race for
                      of NAFTA                                   PC leader
                      Negotiations                               Doug Ford and his late
                                                                 brother Rob Ford supported
                      The U.S. dropped its harshest              the Scarborough subway
                      demand for 50% U.S.                        extension. Doug Ford currently
                      content on Canadian and                    supports the Relief Line but
                      Mexican automobile exports                 criticizes Sheppard, Finch
                      – a measure that would have                West and Eglinton LRT
                      disrupted supply chains                    measures. On June 7th, Ford
                      and sent ripples throughout                will go head to head with
                      the manufacturing sector.                  Kathleen Wynne (Liberal),
                      Negotiations and the possibility           Andrea Horvath (NDP) and Mike
                      of the dissolution of NAFTA                Schreiner (Green) for the 2018
                      will continue into Q2 2018,                Ontario provincial election.
                      pending further discussions
                      with U.S. President Donald
                      Trump.
The City of Toronto                                    CAD dollar worth
       increased its                                          $0.78 as of March
       development charges                                    31, 2018
       DC charges increased in response to                    Uncertainty surrounding NAFTA
       unprecedented price growth supported                   negotiations has further weakened
       by strong immigration, land scarcity and               the Canadian dollar, decreasing
       a low interest rate environment. The DC                2% since January 1, 2018.
       2018 study is currently under review
       and will lead to higher DC charges by
       the end of 2018.

Real Estate Investment Trends in 2018
     Emerging Technologies                           Investment in Land
     Technology will play a role in transforming     Overtaking Built Assets
     production systems, consequently
     changing the way our buildings are              As record high prices cannot achieve enough
     designed and transactions are executed.         yield based on cash flow projections for built
     Emerging technologies in real estate            assets, land sales will be the highest traded
     include artificial intelligence, drones,        asset class as investors must now take on
     blockchain, robotics and automation.            a development perspective.

     Steady Retail                                   Demand for Flexible,
     E-Commerce Performance                          High-Efficiency Space
     E-commerce continues to gain traction and       The collaborative economy is redefining how
     pose an increasing threat to physical stores.   space is designed and utilized, allowing for
     According to eMarketer, E-commerce will         co-working spaces and other short-term uses.
     account for 9% of total Canadian retail sales   The benefits of high-efficiency space
     in 2018 – an increase from 7.5% the             allow for costs savings in an increasingly
     previous year.                                  pricier market.
The Market
The Canadian economy has Uncertainty surrounding housing
adjusted since 2015 when lower market imbalances and U.S. trade
oil and commodity prices played a relations will remain throughout
Outlook hand in dropping the GDP growth
rate to just under 1%. Largely due
to fiscal and monetary stimulus,
2018. Previous and impending
interest rate hikes are likely to
slow spending. Rising interest rates
stronger consumer demand and spiked bond yields over the course
housing activity, the GDP growth of the quarter but overall remained
rate rebounded to 3.0% in 2017 unchanged from the beginning of
and is projected to slow to a more the year.
sustainable pace of 2.3% in 2018.
Overview of the Canadian Economy
Overview of of
Overview thetheCanadian
Canadian Economy
Economy
$2,050 Overview of the Canadian Economy 9.0%
$2,050 $2,050 9.0%
9.0%
$2,000 8.0%
$2,000 $2,000 8.0% 8.0%
$1,950 $1,950 7.0%
7.0%
$1,950 6.27% 6.27% 7.0%
$1,900 $1,900 6.27% 6.0% 6.0%
PERCENTAGE
$1,900 6.0%
(Billions)
$1,850 5.0%
(Billions)
BILLIONS
$1,850 5.0%
(Billions)
$1,800 4.0%
$1,850 5.0%
$1,800 $1,750 3.0% 4.0%
$1,800 $1,700
2.30%
2.0%
4.0%
$1,750 1.79%
3.0%
$1,750 $1,650 2.30% 1.0% 3.0%
$1,700 $1,600 2.30% 0.0%
2.0%
$1,700 2014 2015 2016 2017* 2018*
1.79%
2019* 2020* 2021* 2022*
2.0%
$1,650 1.79% 1.0%
$1,650 GDP GDP Growth Rate (from previous year) Unemployment Rate Inflation 1.0%
$1,600 0.0%
$1,600 0.0%
2014 2015 2016 2017* 2018* 2019* 2020* 2021* 2022*
2014 2015 2016 2017* YEAR
2018* 2019* 2020* 2021* 2022*
GDP GDP Growth Rate (from previous year) Unemployment Rate Inflation
*projected
GDP GDP Growth Rate (from previous year) Unemployment Rate Inflation
The BankTheofBank
Canada’s Benchmark
of Canada's Bond
Benchmark Bond Yields Yields
- Q1 2018– Q1 2018
2.40%
2.35%
2.30%
2.25%
PERCENTAGE
2.20%
The Bank of Canada's Benchmark Bond Yields - Q1 2018
2.15% The Bank of Canada's Benchmark Bond Yields - Q1 2018
0.024 2.10% 2.08% 2.09%
0.0209
0.0208
0.024 2.05%
0.0235 2.00%
0.0235
0.023 1.95% 1.96%
0.0196
0.023 1.90%
0.0225 1.89%
0.0189
0.0225 1.85%
0.022 2-Jan 9-Jan 16-Jan 23-Jan 30-Jan 6-Feb 13-Feb 20-Feb 27-Feb 6-Mar 13-Mar 20-Mar 27-Mar
0.022 DATE
0.0215
5 Year Bond Yield 10 Year Bond Yield
0.0215
0.021
Sources: International Monetary Fund, IMF Country Focus; Bank of Canada
0.021 0.0208 0.0209
0.0205 0.0209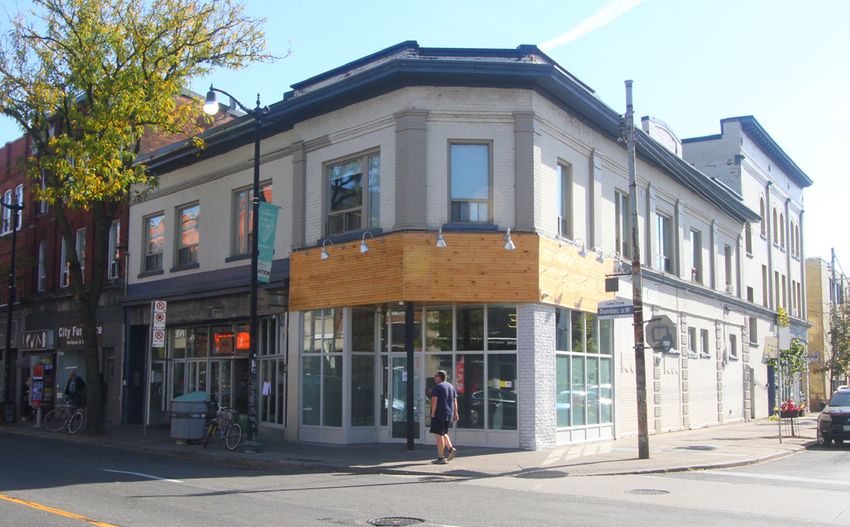
Canadian
Immigration
Immigration promotes GDP growth, offsets
an aging population and contributes to a        This buzz will likely continue as
skilled labour force – all of which support
a stable macroeconomic environment,
                                                Canada will be welcoming nearly
encourate investment, and increases the         one million immigrants over the
demand for space.
                                                next three years.

The large influx
of immigrants is a
contributing factor
to the real estate
market’s sustained
surge of activity
and record-breaking
price growth.

Between the 2011 to 2016 period, Ontario
attracted 39% of Canada’s 1.2 million
immigrants – a total of 472,170 people.
An estimated 75.6% of Ontario’s immigrants
settled in Toronto Census Metropolitan Area –
representing 29% of all Canadian immigrants.

                                                = 10,000 Immigrants

                                                = 2018 - 310,000

                                                = 2019 - 330,000

                                                = 2020 - 340,000
Immigration                                                Nearly 30% of all
                                                                           Canadian immigrants
                Statistics                                (2011 – 2016)    settled in Toronto CMA

             Of the 1.2 million
             immigrants who
             entered Canada, 39%
             settled in Ontario

             75% of Ontario’s
             immigrants settled in
             Toronto                                                         Ontario           British Columbia
                                                                             Alberta           Quebec        Rest of Canada

                Education                                                                            Of recent immigrants
                                                                            52.1%                    have a bachelor’s degree
                Immigrants contribute to Canada’s economy by                                         or higher*
                bringing their skills and high levels of educational
                attainment. Over half of recent immigrants have
                a bachelor’s degree or higher, as compared
                to just under one-quarter of the Canadian-
                born population. Recent immigrants are even
                more likely to hold graduate degrees, with 16.7%                                     Of recent immigrants
                having completed a master’s degree or doctorate,
                compared to 5.0% of Canadians.                              16.7%                    have a master’s degree
                                                                                                     or doctorate*

Sources: Ontario Ministry of Finance, Statistics Canada                   *2016 Census: Ages 25-64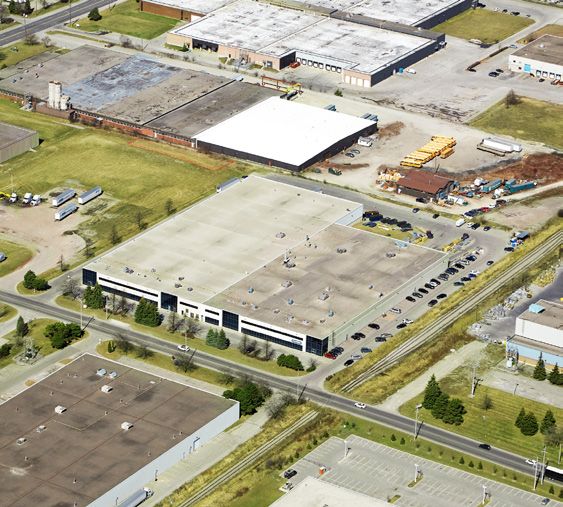
Focusing
on the GTA
                                                             Finishing up the first quarter of 2018,
                                                             the total number of transactions fell
                                                             from 598 in Q1 2017 to 556, all while
Investment Property                                          investment increased significantly. The
                                                             total dollar volume for each asset class
Sales for Q1 2018                                            increased year-over-year for Q1 2018,
                                                             with the exception of the hotel sector.
                                                             Office was the leading sector
                                                             in investment, overtaking residential
                                                             land this quarter. This was due to the
GTA Total Investment property                                50% interest sale of the Bay Adelaide
sales volumes in Q1 2018 reached                             Centre for $850M*.
$5.6 billion, a 22.4%                                        *See Notable Transactions for more details

increase in capital flows from the
same quarter the previous year

Quarterly Investment Comparison by Class*

                 Q1 2018               Q1 2017

*Inclusive of transactions above $1M   Source: Altus Group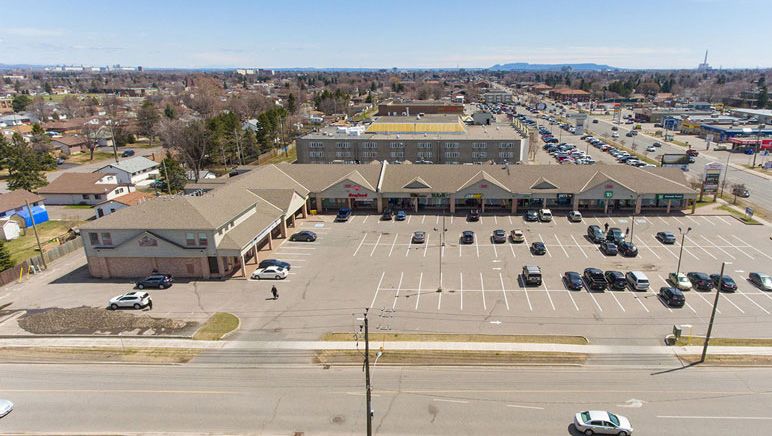
Private Capital Investment Group
Investment Transactions
of Q1 2018

   Sold                                                                                                                                                                       Sold

ADDRESS: 2881 Dundas Street West, Toronto                                                                                                                                   ADDRESS: 1781-1783 Avenue Road, Toronto
ADVISORS: Greg Peacock, Dayma Itamunoala                                                                                                                                    ADVISORS: David Williams, Rob Walkowiak, George Siotas, David Hoffman
SOLD FOR: $8.6M                                                                                                                                                             SOLD FOR: $4.75M

15,181 SF | 0.147 ACRES                                                                                                                                                     5,308 SF | 0.08 ACRES

Listings
                                                                                                                                       ADDRESS:                                                                      ADDRESS:
                                                                                                                                       20 Leslie Street, Toronto                                                     391 Victoria Avenue North, Hamilton
  Executive Summary                                                                                                                    49,996 SF | 0.97 ACRES
  Colliers International (the “Advisors”) have been retained on an exclusive basis by Invar Building Corporation (“Invar” or the
  “Vendor”) to offer for sale a 100% freehold interest in 1840 and 1842 Clements Road, Pickering, Ontario, Canada (“The Property”).
                                                                                                                                                                                                                     240,626 SF | 7.85 ACRES
                                                                                                                                       Investment opportunity with
  The Property is a multi-tenant building that is 92% occupied by two tenants with a weighted average remaining lease term of 4.1
  years. This Property is strategically located in an established industrial sector home to many companies of various industries.

  The Property is comprised of two separate units totaling 170,302 square feet including a two storey office component of 13,867
                                                                                                                                                                                                                     Repositioning opportunity
  square feet. The building was built in 1990 and expanded in 2001. Given the prime location, industrial based tenants benefit from
  being in both an established industrial neighbourhood and being in close proximity to Highway 401, the Pickering GO Train
  Station and the CN Train Station as well as a solid residential base.                                                                long-term development potential
  The Property is offered on a free and clear basis, providing an exceptional opportunity for investors to secure new mortgage
  financing at interest rates which continue to be near all-time lows and will benefit from positive leveraged and enhanced returns.

                                                                                                                                       ADDRESS:                                                                      ADDRESS:
                                                                                                                                       1840-1842 Clements Road, Pickering                                            636-646 Danforth Road, Toronto
                                                                                                                                       170,302 SF | 7.02 ACRES                                                       5,170 SF (GROUND FLOOR),
                                                                                                                                       Multi-tenant industrial investment                                            8 RENTAL APARTMENTS
                                                                                                                                                                                                                     (2ND FLOOR)
                                                                                                                                                                                                                     0.48 ACRES
                                                                                                                                                                                                                     Value-add retail opportunity

                                                                                                                                       ADDRESS:                                                                      ADDRESS:
                                                                                                                                       28 & 36 Halton Street, Toronto                                                595 Arthur Street West,
                                                                                                                                                                                                                     Thunder Bay
                                                                                                                                       21,368 SF | 0.6 ACRES
                                                                                                                                       Repositioning with development                                                27,315 SF | 2.2 ACRES
                                                                                                                                       opportunity
                                                                                                                                                                                                                     Value-add opportunity through
                                                                                                                                                                                                                     vacancy lease up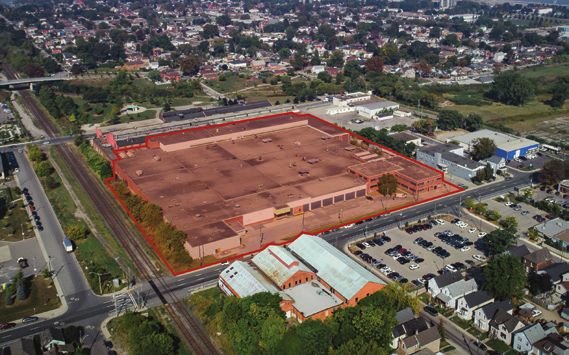
Notable Transactions
Residential Land
800 Hydro Road, Mississauga – $275M
The Ontario Power Generation sold their former coal-fired hydro plant measuring nearly 177 acres for
$274,770,000, representing a price per acre of $1,555,167. The province of Ontario, OPG and the City of
Mississauga developed a vision for the site called the “Inspiration Lakeview Master Plan” – a mixed-use
community with residential, employment and parkland space.

Residential Land
Seaton Lands, Pickering - $157M
Ontario Infrastructure and Lands Corporation is selling off bundles of the Seaton Lands – a 3,100 acre urban
development project. At the end of Q1, approximately 397 acres of land was sold to Mattamy Homes for
$156,670,176.60. This represented a price per acre of $394,238.

Office
The Bay Adelaide Centre, Toronto - $850M
Brookfield Properties sold a 50.0% interest share of the Bay Adelaide Centre to foreign investor, Dadco
Investments. The sale price of $850 million represents an adjusted price per square foot of $767,
approximately 10% higher than the Downtown Core’s Q1 2018 average of $699 for office properties.

Industrial
American Business Park, Mississauga- $90.6M
Cominar REIT’s sale of 3355 – 6300 American Drive to KingSett Capital was the largest industrial transaction
of the quarter in terms of sale price and total square feet. The business park totaling approximately 552,675
square feet closed for $90.6 million, representing a PSF of $164.

Retail
Dixie Outlet Mall, Mississauga – $181M
Sold as part of Cominar REIT’s $1.14 billion portfolio to Slate Asset Management, the Dixie Outlet Mall closed
for $180,908,000. The regional shopping centre measures approximately 420,000 square feet, representing a
price per square foot of $432. This was the largest retail transaction of the quarter in terms of purchase price
and square footage.

Multifamily
35 Valley Woods Road, North York – $51.9M
This was the largest multifamily transaction of the quarter in terms of sale price and total number of units.
The townhouse complex was sold to Realstar Group for $51.9 million, representing $384,444 per unit.

*Choice Properties REIT acquired CREIT for $6B
Choice Properties REIT will acquire all of CREIT’s assets and assume all its liabilities, including long-term
debt and residual liabilities. This merger will form Canada’s largest REIT with an enterprise value of $16
billion. The resulting enterprise will have a diversified portfolio of 752 properties with 69 million square
feet of gross leasable area.

*Blackstone Announces Acquisition of PIRET for $3.8B
Blackstone Property Partners will acquire Canada’s Pure Industrial Real Estate Trust in an all-cash transaction
valued at $3.8 billion - $8.10 per unit. Completion of the transaction is expected to occur sometime in Q2
2018. PIRET exclusively invests in industrial properties.

*Mergers & Acquisitions
Sources: Choice Properties REIT, Bisnow Toronto
MARKET CONTACT

413 offices in                                                                                                              GREG PEACOCK
                                                                                                                            Managing Director, Private Capital
69 countries on                                                                                                             Investment Group, Broker
                                                                                                                            Direct: +1 416 643 3786
6 continents                                                                                                                Greg.Peacock@colliers.com

                                                                                                                            REGIONAL AUTHORS
United States: 145
                                                                                                                            RACHEL LEVY
Canada: 28                                                                                                                  Senior Market Intelligence Analyst
Latin America: 23                                                                                                           Direct +1 416 791 7207
Asia Pacific: 86                                                                                                            Rachel.Levy@colliers.com
EMEA: 131
                                                                                                                            Colliers International | Toronto
$2.7B                                                                                                                       181 Bay Street, Suite 1400
                                                                                                                            Toronto, ON | Canada
US* in annual                                                                                                               +1 416 777 2200
revenue

2B
Square feet
under management

15,400
Professionals
and staff
*Based on 2017 year end performance

About Colliers International Group Inc.
Colliers International Group Inc. is an industry leading global real estate services company with more than
15,000 skilled professionals operating in 69 countries. With an enterprising culture and significant employee
ownership, Colliers professionals provide a full range of services to real estate occupiers, owners and investors
worldwide. Services include strategic advice and execution for property sales, leasing and finance; global
corporate solutions; property, facility and project management; workplace solutions; appraisal, valuation and tax
consulting; customized research; and thought leadership consulting.

Colliers professionals think differently, share great ideas and offer thoughtful and innovative advice that
help clients accelerate their success. Colliers has been ranked among the top 100 outsourcing firms by the
International Association of Outsourcing Professionals’ Global Outsourcing for 11 consecutive years, more than
any other real estate services firm.

colliers.com

Copyright © 2018 Colliers International.
The information contained herein has been obtained from sources deemed reliable. While every reasonable effort has been made to ensure
its accuracy, we cannot guarantee it. No responsibility is assumed for any inaccuracies. Readers are encouraged to consult their professional
advisors prior to acting on any of the material contained in this report.
You can also read