Misinformation in Germany during the COVID-19 pandemic
←
→
Page content transcription
If your browser does not render page correctly, please read the page content below
Misinformation in Germany during the COVID-19 pandemic

  Christina Leuker1,2*, Lukas Maximilian Eggeling1, Nadine Fleischhut1, John Gubernath1,2,
    Ksenija Gumenik1, Shahar Hechtlinger1, Anastasia Kozyreva1, Larissa Samaan1,3,
                                      & Ralph Hertwig1

              1
                  Max Planck Institute for Human Development, Berlin, Germany
                            2
                              Robert Koch-Institute, Berlin, Germany
                      3
                        Berlin School of Mind and Brain, Berlin, Germany

                            *Corresponding author (leukerc@rki.de)

Author contributions:
Conceptualization (main idea, theory): CL, RH, AK, NF
Funding acquisition: RH
Project administration: CL, NF
Methodology (design, operationalization): CL, LME, NF, SH, LS, AK, RH
Data collection: CL, LS, NF, JG
Data analysis: CL, JG
Writing – original draft: CL
Writing – review & editing: CL, AK, JG, RH

Acknowledgements. We thank Susannah Goss for editing the manuscript and survey
translation; our respondents for participating; and to members of the Center for Adaptive
Rationality at the Max Planck Institute for Human Development and the Science
Communication Group at the Robert Koch-Institute for fruitful discussions.
Competing Interests statement. All authors declare no conflict of interests.
Supplementary Material. Data, analysis code, details of all statistical analyses and survey
questions are provided online (https://osf.io/hz9yq/).

Ethics Approval: The Ethics Board at the Max Planck Institute for Human Development
approved of the study.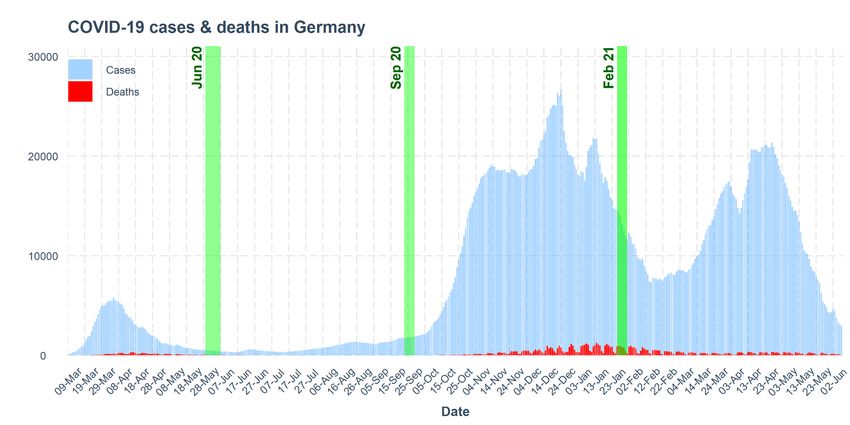
1

Abstract

During the COVID-19 pandemic, citizens have been exposed to vast amounts of mis- and

disinformation. This “infodemic” has undermined key behavioural and pharmacological

measures to contain the pandemic—for instance, by increasing vaccine hesitancy. In a

cross-sectional survey of residents of Germany, we investigated citizens’ perceptions of and

ability to deal with misinformation across three Waves of data collection in 2020/21 (Ntotal =

3324). We observed three main results. First, there was a strong increase in the perceived

prevalence of misinformation in classic and online media and in social interactions over the

course of the pandemic. Second, some—but by no means all—respondents knew how to

identify misinformation. Third, higher susceptibility to misinformation was associated with

support for the far-right AFD party, reliance on tabloids, neighbours and social media for

information and news, lower education, as well as migration background. To help people

navigate the challenges of the infodemic, we propose a two-pronged approach, namely, to

boost individuals’ abilities to discern false from accurate information, and to enrich citizens’

proximate environments (e.g., neighbourhoods with high rates of migration) with reliable,

accessible and high-quality information.

Keywords: perceptions of misinformation, susceptibility to misinformation, boosting, German

sample
2

Since early 2020, COVID-19 has dominated the information landscape in Germany, both in

private conversations and in the media. People in Germany have been exposed to an

overwhelming amount of information about the virus and ways to curb its spread: statistical

information on infections, mortality and vaccination rates; medical information on symptoms,

treatments and testing; policy information on restrictions and behavioural measures; and as

well as personal accounts of experiences, beliefs and opinions from individuals within

Germany and beyond. Unfortunately, people were also exposed to a large amount of false or

misleading information about these topics. It can be spread deliberately (disinformation) or

unintentionally (misinformation). Concerns over the amount of false and misleading

information being disseminated about COVID-19 are so high that several supranational

organisations have released a joint statement on the need to combat the “infodemic” that is

threatening measures to control the pandemic (WHO, UN, UNICEF, et al., 2020).

        Consequences of online mis- and dis-information can be far-reaching. For instance,

false information on COVID-19 can pose a severe threat to public and private health

(Roozenbeek et al., 2020)—be it the notion that the virus can be cured by injecting bleach,

that SARS-CoV-2 symptoms are no worse than the regular flu, or that COVID-19 vaccines

can lead to infertility in women. In addition, susceptibility to misinformation has been

associated with lower compliance with public health guidance (Freeman et al., 2020; Hornik

et al., 2021) and lower willingness to get vaccinated (Roozenbeek et al., 2020). Moreover,

misinformation also lowers the public’s trust in science (Plohl & Musil, 2021), journalism and

the mainstream media (Linden et al., 2021), and the government (Kim & Cao, 2016).

       Much disinformation is politically motivated, such as the idea that the COVID-19

pandemic is a pretext fabricated by the government to distract citizens from other issues.

Many false claims about COVID-19 have also been publicly shared by prominent political

figures. For example, Brazil's President, Jair Bolsonaro, has consistently made between 55

and 190 false statements per month about COVID-19 since March 2020 (Freitas, 2021;

Statista, 2021). Former U.S. President Donald Trump amplified online hoaxes about treating

the Coronavirus disease with sunlight and disinfectants, undermined public health measures
3
such as systematic testing with statements such as “If we stopped testing right now, we'd
have very few cases, if any,” and spread erroneous epidemiological conclusions—for
example, that “99% of COVID-19 cases are totally harmless” (Greenberg, 2020; Paz, 2020).
Political motivations, opposing ‘mainstream’ media or opinions may be why believing one
false claim often predicts belief in other false claims (Roozenbeek et al., 2020). Sometimes,
this is even the case when two claims are self-contradictory (Betsch et al., 2020; COSMO
Explorer, 2020).
False information is perceived to be highly prevalent, especially on social media and
online media. Roughly half of the respondents in surveys in the United Kingdom (OFCOM,
2020) and Germany (Leuker et al., 2020) reported being exposed to misinformation daily or
almost daily. A recent content analysis found that roughly one fourth of YouTube videos
about COVID-19 contain misinformation (Li et al., 2020).
Social media platforms have started to develop and apply interventions to fight
misinformation. For example, Twitter attaches a label and/or warning message to certain
tweets, shows warning messages before people share false or misleading information, or
turns off retweet, like and reply functions (Twitter Misinformation Policy, 2021). More
generally, their misinformation policy encompasses measures of varying force designed to
target information of varying risks of harm—from labeling something as disputed to removing
potentially dangerous content (e.g., the suggestion to inject bleach to cure the virus). TiKToK
reports using a similar policy (TiKToK’s H2 2020 Transparency Report, 2020). At the same
time, social media platforms have begun to work in partnership with the World Health
Organization (WHO) and national health authorities with the goal of amplifying their voices—
for instance, by placing official information in boxes at the top of a page, linking to this
information when users search for certain topics, verifying official accounts, and creating
emojis that foster the spread of information and motivate people to take up certain
behaviours, such as staying at home or getting vaccinated (e.g., #stayathome #vaccinated).4
These are credible and plausible interventions, though the size of their effects is difficult to
estimate in the absence of open data from social media companies.
Here, we explored perceptions of misinformation in Germany and sought to identify
further opportunities for interventions using a cross-sectional, quota-representative survey of
the German population at three timepoints in 2020/21 (June 2020, September 2020 and
February 2021, see also Figure 1). The goal was to identify key features of misinformation in
Germany during the pandemic from the perspective of people navigating it. In particular, we
focused on the following four issues:
First, we examined people’s perceptions of misinformation in Germany. How
frequently did people feel exposed to misinformation over the course of the pandemic? What
do people in Germany consider to be the primary sources and spreaders of misinformation?
Second, we assessed people's self-reported competences in dealing with
misinformation. How confident are they in their ability to detect false information? How do
they behave when they are uncertain about the accuracy of COVID-19-related information?
What kinds of cues do they deem relevant in discerning true from false information? What
intuitive verification strategies do they enlist?
Third, we explored people’s susceptibility to misinformation and conspiracy beliefs.
Specifically, respondents judged the extent to which they considered certain statements
(e.g., that the spread of the Coronavirus is related to 5G) to be true or false. Which
conspiracy beliefs were especially convincing?
Finally, we analyzed to what extent individual differences—in terms of demographic
characteristics, political preferences, information preferences (e.g., sources typically used to
access information on COVID-19), trust in the government and science, and risk
perceptions—were associated with propensity to believe misinformation.
To briefly foreshadow the results, we found: (1) The perceived prevalence of
misinformation has increased over the course of the pandemic. (2) People are aware of
several cues that can help to detect misinformation, though only a subset of respondents
reported using lateral reading strategies (e.g., cross-checking information on a different5 website rather than searching for reliability cues within a website). (3) The most believed false statements in our set include “a SARS-CoV-2 infection is no worse than the flu” and “the EU has approved dangerous vaccines”. (4) Higher susceptibility to misinformation was associated with reliance on tabloids, neighbours and social media, lower education and a migration background. Based on these results, we propose policy recommendations for combating misinformation in Germany. To help people navigate (mis-)information, we suggest both boosting individual skills (e.g., by making people aware of cues and strategies that help identify misinformation) and providing reliable information in people’s proximate environments (e.g., by providing face-to-face information on vaccines in neighbourhoods with low take up; or information in the native language). Methods Participants The present data (Ntotal = 3324) were obtained at three Waves of data assessment: early summer 2020 (29 May–7 June, 2020; NJune = 1110), late summer 2020 (23–29 September, 2020; NSept. = 1109), and winter 2021 (26 January–1 February, 2021; NFebr. = 1105) using the panel provider Respondi. Each sample is quota-representative of the German population with respect to an age range (18–69 years), gender, and federal state (see Supplementary Material S1 for demographic information). The data analyzed here come from a larger survey on information search surrounding the COVID-19 pandemic, for which respondents received a flat payment of €1.15 for an average of 23 minutes of their time (interquartile range = 16– 34 minutes) The Institutional Review Board of the Max Planck Institute for Human Development approved the surveys. Some preliminary results from the first Wave have been made available in German as part of a technical report on general information search (Leuker et al., 2020). Figure 1 shows the COVID-19 infection rates in Germany since March 2020, with the three Waves of data collection marked in green.
6

Figure 1. The three Waves of data collection mapped onto the evolution of COVID-19 infections
(rolling 7-day average) and deaths in Germany. Code and visualisation adapted from (Garrett et al.,
2021). Data on frequency of infections from the Robert Koch-Institute (RKI, 2021a).

Measures

Below, we report the variables employed in the current analyses (translated to English). All

original items (in German) along with their English translations are available in

Supplementary Material S2. Note that not all items were collected in all three Waves. The full

surveys for all three Waves, including questions that do not pertain to misinformation and are

not reported here, are posted on the Open Science Framework

(https://osf.io/hz9yq/?view_only=18465817fb32475ca9b731fe6aa34fb1).

Perceptions of misinformation. Respondents’ perceptions of the prevalence, topics, and

sources of misinformation were assessed by three multiple choice questions, worded as

follows: (1) How often per week do you currently come across information on the coronavirus

that you think is false or misleading? [several times a day, every day or almost every day,

several times a week, once a week, several times a month, rarely, never] (2) In your

experience, which topics does false or misleading information on the coronavirus typically

concern? Select all that apply. [list of topics such as “infection rates” or “progress in

treatments”]; (3) In your experience, which of the following institutions and individuals spread
7

false and misleading information about the Coronavirus? Select all that apply. [list of sources

such as “public-sector television”, “social media”, “global health organizations”].

Perceived competence in detecting misinformation. Participants’ self-reported ability to

detect and deal with misinformation was assessed by three multiple choice questions,

worded as follows: (1) How confident are you in your ability to detect false and misleading

information on the coronavirus? [very confident, somewhat confident, not very confident, not

confident at all]; (2) How can you tell that a piece of information could be false or misleading?

Select all that apply. [for a list of all indicators such as “The headline is sensationalist

('clickbait').”, see Figure 3a; not included in Wave 1]; (3) What do you usually do if you are

uncertain whether news or information on the coronavirus is true or false? Select all that

apply. [for a list of all strategies such as “I consult people in my social circle”, see Figure 3b].

Belief in misinformation. In Waves 2 and 3, we also assessed respondents’ beliefs in

misinformation by asking them to rate 12 (Wave 2) or 14 (Wave 3) statements as follows:

“There is much discussion of whether the public is fully informed about the truth on important

topics. Please indicate for each of the following statements on the coronavirus whether you

think it is true or false. [definitely false, probably false, don’t know, probably true, definitely

true].” We included items known to be true, such as “SARS-CoV-2 is a novel coronavirus

identified in early 2020 that is responsible for COVID-19 infections.” and items known to be

false, such as “All alleged “corona deaths” were actually due to other causes.” For each

respondent, we computed the proportion of false statements they believed to be definitely

true or probably true. True statements were reverse coded—here, not believing marks higher

susceptibility to misinformation. A full list of statements, with both their complete wording and

the brief labels used in our tables and figures, is provided in Supplementary Material S2. We

created the list of statements based on publicly available information on conspiracy

narratives and their corrections (Correctiv, 2020; Sessa, 2020) and used fact-checking

organisations’ conclusions on their veracity, based on the best available evidence to date, as

our ground truth (Correctiv, 2020; Sessa, 2020).
8
Next, we list survey items that we used as covariates/predictors in the regression
analyses.
Agreement with measures & role of the state. In all three Waves, we examined
respondents’ agreement with COVID-19 containment measures and the remit of the state by
asking: (1) Agreement with measures. What do you think of the official rules and measures
to contain the spread of the virus in Germany (e.g., physical distancing, closing shops,
schools and childcare facilities)? [fully inadequate; mostly inadequate; mostly adequate; fully
adequate] (2) Role of the state. To what extent do you agree with the following statements
about the role of the state? [fully disagree, somewhat disagree, neither agree nor disagree,
somewhat agree, fully agree] (a) The state can limit personal freedoms for the public good.
(b) The state can enforce social, political and economic restrictions to protect public welfare
under exceptional (humanitarian) circumstances. (c) The state can limit citizens’ freedom of
movement under exceptional (humanitarian) circumstances.
Trust. In Waves 2 and 3, we assessed respondents’ trust in various groups and institutions
by asking: Do you trust the following groups of people or institutions in dealing with the
coronavirus? [full trust, fairly high trust, neutral, fairly low trust, no trust at all] (a) scientists,
(b) federal government, (c) the Robert Koch-Institute, (d) the Federal Ministry of Health, (e)
doctors, (f) local government, (g) local health authorities.
Sources. In all three Waves, we assessed respondents’ preferred sources of information on
the coronavirus: How long, per day, did you use the following sources (including their
websites) to obtain information on the coronavirus in the last week? [not at all, less than 10
minutes/day, 31–60 minutes/day, 1–2 hours/day, more than 2 hours/day] (a) public-sector
television, (b) private-sector television, (c) regional newspapers, (d) national newspapers, (e)
tabloids, (f) government sources, (g) radio stations, (h) social media, (i) global health
organizations, (j) national health authorities, (k) scientific institutes, (i) local news (e.g.,
website of the place of residence), (j) podcasts, (k) friends and family, (l) neighbors, (m)
colleagues, (n) alternative sources (e.g., websites of independent organizations) [this
response option was not collected in Wave 1].9 Perceived and actual risk. A set of variables assessed respondents’ perceived and actual risk of infection: (1) Risk group (self). Do you belong to a risk group for developing severe COVID-19? [yes, no] (2) Risk group (social circle). Do you know anybody belonging to a risk group for developing severe COVID-19? (3) Infection (self). Have you been infected with COVID-19? [yes—confirmed; yes—but not (yet) confirmed; yes—and I have recovered; no—I don’t think so; no—confirmed; don’t know]; (4) Cases (social circle). Which of the following statements applies to COVID-19 infections in your social circle? Select all that apply. I know of ... [untested suspected cases; confirmed cases; recovered cases; deaths; hospitalized cases; people who have been vaccinated; no cases] (5) Seven-day incidence. To include a proxy for each respondent’s objective risk of infection at the time of survey completion, we used the number of new COVID-19 infections recorded over the last 7 days per 100,000 inhabitants (7-day incidence) in the respondent’s federal state. These data were retrieved from the Robert Koch-Institute’s COVID-19 dashboard (RKI, 2021a), which is based on the reports of local health authorities (RKI, 2021b), and matched to each respondent using the postcode they provided. Demographic information. We collected the following demographic information: (1) highest educational attainment [never graduated, secondary education (Hauptschule), secondary education (Realschule), A-level degree, dual education, university degree, doctorate]; (2) number of people in household, (3) income bracket [€1000 or less, €1000-1999, €2000- 2999, €3000-3999, €4000-4999, €5000-5999, €6000 or more; prefer not to answer]; (4) Migration background [parents migrated, born in Germany; migrated myself; no migration background] (5) Location: Please indicate the first four digits of your postcode (optional). (6) In Wave 3, we asked people for their political affiliation: The terms “left” and “right” are often used when labelling political attitudes. When it comes to your own political attitudes, where would you locate yourself on that scale? [7-point Likert scale with endpoints left, right]; (7) If elections would take place next Sunday, which party would you vote for? [list of parties]. The variables age, gender and federal state were available from the panel provider.
10

Analyses. We applied Bayesian Generalized Linear Models using Stan in R for regression

analyses with the brms package (Bürkner, 2017). In general, we report the mean of the

posterior distribution of the parameter or statistic of interest and two-sided 95% equal tail

credible intervals (CI) around each value. Our focus is on estimating the effects of particular

predictors and our analyses reflect this goal; in comparing the models and predictors,

however, the crucial issue is whether the CI includes 0 or not. If the interval around a given

coefficient does not include 0, there is a credible (positive or negative) association between

the variables in a given regression model.

Results

Perceptions of misinformation during the COVID-19 pandemic in Germany

The perceived prevalence of misinformation increased over the course of the pandemic. For

example, the proportion of respondents who reported seeing misinformation several times a

day almost doubled, from 9% in June 2020 to 17% in February 2021. Consistent with this,

8% of respondents reported never encountering misinformation in June, relative to just 4% in

February 2021 (see Figure 2).

   How frequently do you come acrossPerceived
                                     misinformation?
                                              frequency of misinformation
                             Never                          Once a week                          Several times a day
                             Rarely                         Several times a week
                             Several times a month          Every day or almost every day

   Febr. 2021     4            21               6       8                  23               21                 17
   Sept. 2020        5              23              8           9               22               18              15
   June 2020             8               27                 6          9               25               16             9
                0%                        25%                              50%               75%                           100%
                                                                    % of respondents

Figure 2. Perceived prevalence of misinformation across the three Waves.

The increase in the perceived prevalence of misinformation in Waves 2 and 3 relative to

Wave 1 was credible (bSept2020 = 0.36, CI = [0.19, 0.52]; bFebr2021 = 0.60, CI = [0.44, 0.76];

regression model using perceived frequency as a dependent variable and Wave as a

predictor).
11
Febr. 21 Sept. 20 June 2020
Topic (brief) (% selected) (% selected) (% selected)
Statistics 42.6 37.5 42.1
Origins of pandemic 42.3 50.2 61.1
Citizen behaviours 32.7 36.3 -
Vaccination benefits 30.1 - -
Vaccine development 29.1 38.3 -
Forecasts end of pandemic 28.0 26.9 -
Treatments 24.9 28.9 35.7
Vaccination risks 24.9 - -
Scientific findings 23.2 18.9 25.6
Health impact 22.4 17.8 20.1
Rules 21.5 16.0 14.7
International responses 18.8 21.3 -
Mental health impact 18.6 14.9 16.7
Vaccination strategy 18.5 - -
Health advice 18.4 21.6 24.3
Climate impact 18.2 17.8 18.6
Tests 18.1 19.4 -
Regional differences 16.7 15.9 -
Long Covid 16.6 14.9 -
Personal stories 15.4 13.4 11.3
Easing of restrictions 14.8 - -
Reinfection 14.5 16.1 -
Economic impact 14.0 10.3 9.9
Society 13.8 16.9 -
Travel warnings 13.2 16.7 -
Symptoms 12.7 12.7 15.3
Health system impact 12.1 10.7 7.2
Education system impact 11.4 11.4 11.2
Basic supplies 11.2 10.5 14.9
Risk factors 10.8 11.1 -
Financial advice 10.4 8.5 4.4
Legal advice 9.9 5.0 8.8
Risk groups 9.4 10.4 -
Basic services 7.5 8.1 6.7
Contact person 7.0 - -
New waves 6.9 9.2 -
Behavioural advice 6.8 7.2 8.0
Table 1. Perceived topics of misinformation by Wave of data collection, ordered by reported prevalence in Wave
3 (percentage selected). Respondents could select as many topics as they liked; the first page of the survey was
kept identical across Waves, with 19 topics; further topics were added in Wave 2 (total 32 topics) and Wave 3
(total 37 topics). The topic list was generated by the author team. Topics not included in a Wave are marked as
missing cells in the table.12
Consistent with earlier research, respondents identified social media as the main
source of misinformation, with 72% of respondents who reported having encountered
misinformation mentioning this source (between 68% in Wave 3 and 79% in Wave 1; see
Supplementary Material S3; Figure S3). As Table 1 shows, in all Waves, the major reported
topics of misinformation were the origins of the pandemic (MJune2020 = 61%, MSept2020 = 50%,
MFebr2021 = 42%) and statistics on, for example, the number of infections (MJune2020 = 42%,
MSept2020 = 38%, MFebr2021 = 43%). In Waves 2 and 3, prominent topics included citizen
behaviours in terms of compliance with measures (MSept2020 = 36%, MFebr2021 = 33%) and
information on vaccine development (MSept2020 = 38%, MFebr2021 = 29%). Note, however, that
the composition of topics changed across the three Waves, with new topics emerging (e.g.,
vaccine development). A complete list of the percentages of respondents who selected each
topic can be found in Table 1.
Perceived competence in detecting and dealing with misinformation
Across all three Waves, a majority of respondents felt confident in their ability to detect
misinformation: 78–87% reported being somewhat or very confident in each Wave. However,
perceived competence was slightly lower in Waves 2 and 3 than in Wave 1 (bSept2020 = -0.14,
CI = [-0.20, -0.08]; bFebr2021 = -0.14, CI = [-0.20, -0.08]). As Figure 3 (panel B) shows,
respondents were able to tell that a piece of information could be false by assessing the
trustworthiness of the source (61–65%), the consistency of the information between sources
(59–60%) and the provision of plausible evidence (56–59%). With the caveat in mind that
these are self-reports and that response options were provided to participants, these are
indeed effective strategies to identify misinformation.
In fact, lay people have been shown to be quite good at judging the reliability of
sources—so good that it has been suggested that lay peoples’ reliability judgments be added
as a cue to online sources (Pennycook & Rand, 2019).13
a) How confident are you in your ability to detect false and misleading
information on the coronavirus?
Confidence in detecting misinformation
Not confident at all Somewhat confident
Not very confident Very confident
June 2020 2 13 58 27
Sept. 2020 4 18 59 19
Febr. 2021 2 17 58 23
0% 25% 50% 75% 100%
% of respondents
Indicators
b) How can you tell that a piece of information could be false or misleading?
Sept. 2020 Febr. 2021
65
The source is not trustworthy. 61
60
The information is not consistent with other sources. 59
59
No plausible evidence is included. 56
53
The language is inappropriate, exaggerated, emotional and/or one−sided. 52
49
The source is biased/pursues its own interests. 48
47
The headline is sensationalist ('clickbait'). 47
36
The source is not reputable. 33
34
The source is unfamiliar to me. 31
22
The information has been flagged as unreliable by fact checkers. 21
0 25 50 75 100
% of respondents
(multiple responses possible)
c) Strategy
What do you usually do if you are uncertain whether news or information
on the coronavirus is true or false?
June 2020 Sept. 2020 Febr. 2021
54
I check the claim on search machines or fact−checking websites. 46
49
37
I ignore the information. 43
43
40
I check the source/author on search machines or independent websites. 37
35
25
I consult people in my social circle. 22
23
8
I share or use the information if it could be useful. 8
6
5
I share or use the information if the news is positive. 4
4
3
Other 3
3
0 25 50 75 100
% of respondents
(multiple responses possible)
Figure 3. Perceived competence in detecting and dealing with misinformation on COVID-19. (a) Confidence in
ability to detect misinformation by Wave. (b) Indicators of false or misleading information (multiple responses
possible; Waves 2 and 3 only). (c) Primary strategies used when encountering potential misinformation (multiple
responses possible).
The strategy of checking claims on independent websites is consistent with using a
lateral reading strategy by switching between websites; this strategy is also used by
professional fact checkers and is deemed both more accurate and less time consuming in14
identifying misinformation than staying within a webpage and looking for indicators such as
logos and domain names (Wineburg & McGrew, 2017).
How do people respond when they think that a piece of information could be false?
As Figure 3 (panel C) shows, many respondents said they would ignore the information (37–
43%). Few indicated that they would share it (4–8% across Waves and items), and a very
small subset of respondents in each Wave (3%) described other more idiosyncratic but
common-sense strategies, such as asking their doctor, talking to other well-informed
individuals, awaiting official statements (e.g., on the Robert Koch-Institute’s website), and
reporting the false information.
Belief in misinformation
We presented respondents in Waves 2 and 3 with a set of statements to be judged as true or
false. Overall, the belief in false claims was low (the median across statements and Waves
was 2, corresponding to the judgment that a false statement was “probably false”). The
distribution of responses per statement is shown in Figure 4. As the top panel shows, most
respondents across the two Waves ratedmost false statements as “definitely false”. For two
statements, relating to the vaccination causing infertility in women and False positives in
PCR testing, roughly half of the respondents (45% and 48%, respectively, endorsed the
midpoint option: “don’t know”; see Supplementary Material S4; Figure S4.4). This distribution
of data suggests that these statements were difficult to evaluate; we therefore removed them
from regression analyses aiming at predicting beliefs in misinformation because a higher
rating on those claims cannot be taken to reflect a stronger belief in misinformation.
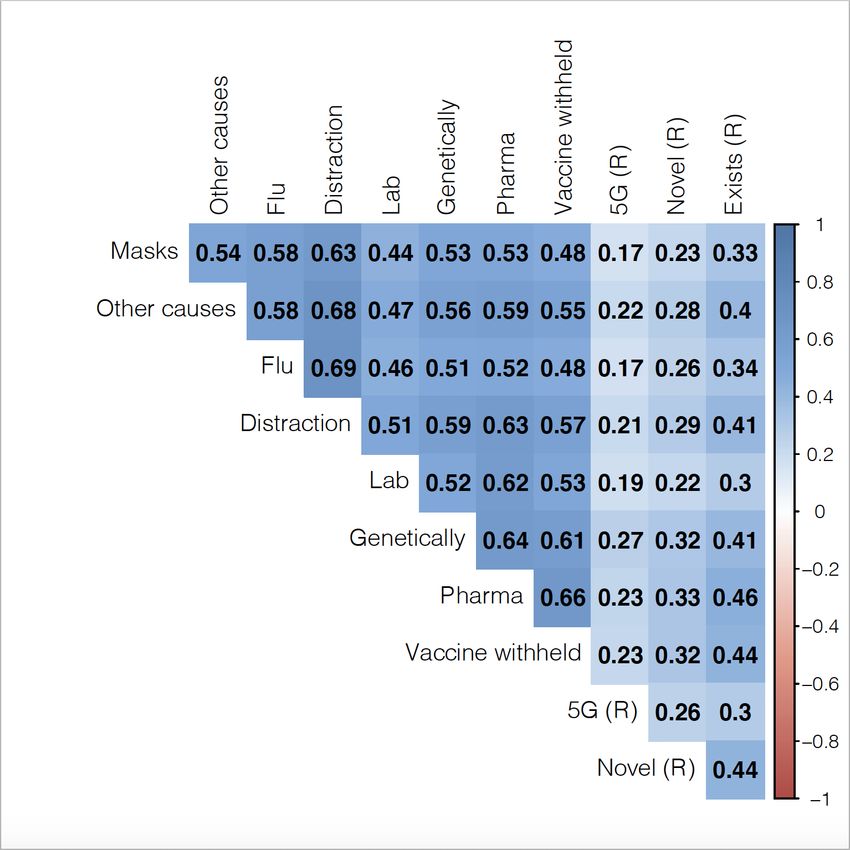
The most believed false claim was that an infection with SARS-CoV-2 is no worse
than the flu; between 17% (Wave 2) and 23% (Wave 3) or respondents believed this to be
“probably true” or “definitely true” (MSept2020 = 2.16, CI = [2.08, 2.25]; MFebr2021 = 2.08, CI =
[2.00, 2.17]). The least disputed claim was that the coronavirus exists (MSept2020 = 1.35, CI =
[1.33, 1.40]; MFebr2021 = 1.28, CI = [1.24, 1.33]; means are from posterior predictive
distributions of a Bayesian cumulative regression model using ‘believing in a statement’ [yes15
or no] as a dependent variable and the statement as a predictor; all values are reported in
Supplementary Material S4; Figure S4.3). Lastly, believing in one claim was moderately
associated with believing in other claims and, conversely, not believing in one claim was
associated with not believing in other claims (see Supplementary Material S4; Figure S4.5).
False statements
eld.
y withh
p u rp osefull
ents a re s.
mpanie
e s a nd treatm a c e u tical co
Vaccin pharm
tes peo
ple.
ated by anipula
vir u s was cre ti c a ll y m ns.
rona n gene infectio
The co v accinatio t a gainst
h e te c
T
do not
pro auses.
Masks other c
re due to
death s a tion.
Corona distrac
n a v ir us as a u.
ing coro n the fl
e rn m e nt is us n o wo rse tha
v ction is de.
The go −2 infe lab−ma
A R S−CoV S − C oV−2 is
A S A R es.
S s vaccin
e d d a ngerou
prov
has ap Definitely
1 Probably
2 Don‘t
3 Probably
4 Definitely
5
The EU false false know true true
True statements
(R)
exists.
C o ro navirus . (R )
The in 2020
rs t d e tected . (R )
l virus
fi d to 5G
− 2 is a nove − 2 is unrelate
CoV CoV Definitely
1 Probably Don‘t Probably Definitely
SARS− SARS− 2 3 4 5
read of false false know true true
The sp Belief in statement
Figure 4. Beliefs in misinformation across Waves 2 and 3. Lighter colour indicates stronger belief in
misinformation. Most statements were false (top panel); three were true (bottom panel)—such that a lower belief
in these statements indicates higher susceptibility to misinformation. The true statements were reverse coded (R)
in the analyses, such that higher values indicate a stronger belief in misinformation. Vertical lines indicate means.
Statements are ordered from lowest to highest average belief.
Individual differences: Who tends to believe in misinformation?
Next, we investigated which, if any, individual differences—in demographic characteristics
but also behaviours—predicted belief in misinformation. Figure 5 shows coefficients retrieved
from a multivariate binomial regression that modelled respondents’ belief in false statements
or disbelief in true statements (controlling for individual respondents using a random
intercept (1|respondent) and statement as a fixed effect; and with numeric predictors z-
scored prior to the analysis.). For Figure 5, we ran one regression for Wave 2 and Wave 316
each (beliefs in misinformation were not assessed in Wave 1). The same figure but with a
combined regression for Wave 2 and Wave 3 can be found in Supplementary Figure S6. All
coefficients for regressions per Wave and the combined regression are presented in
Supplementary Table S6. In the text, for brevity, we report coefficients for the combined
regression using Wave 2 and Wave 3 data simultaneously.
As Figure 5 shows, belief in misinformation was associated with lower trust in the
government (bcombined = -0.25, CI = [-0.39, -0.13]), lower trust in the Federal Ministry of Health
(bcombined = -0.24, CI = [-0.38, -0.11]) and lower trust in the Robert Koch-Institute (bcombined = -
0.22, CI = [-0.34, -0.11]). Note that in the separate regression analyses—even though the
effect is in the same direction—some of the credible intervals include or touch 0 (e.g.,
bSept2020,Robert Koch-Institute = -0.17, CI = [-0.35, 0.00], also indicated by the grey color).
Moreover, respondents who believed in misinformation were more likely to get their
information on COVID-19-related topics from their neighbours (bcombined = 0.26, CI = [0.17,
0.36]), tabloids (bcombined = 0.13, CI = [0.05, 0.22]) or social media (bcombined = 0.21, CI = [0.13,
0.30]). This is in line with previous findings identifying social media as the main driver in
spreading misinformation, as well as with our findings on the subjective sources of
misinformation identified by respondents.
Conversely, relying on public-sector television (bcombined = -0.15, CI = [-0.24, -0.05]) or
national newspapers (bcombined = -0.11, CI = [-0.19, -0.02]) for COVID-19-related information
was associated with lower belief in false information.
Personal experience with the infection might also moderate belief in misinformation.
Across waves, there was a positive association between having been infected (bcombined =
0.16, CI = [0.01; 0.33]) or knowing someone who was infected (bcombined = 0.17 , CI = [0.01;
0.33]) and beliefs in misinformation. However, these associations did not emerge reliably in
Wave 2 (although the effect was in the same direction, see Supplementary Figure S6),
perhaps because there were lower numbers of infections and known infections in total in
Wave 2. It is plausible that people who believed in misinformation did not adhere to
protective measures and were therefore more likely to be infected. Indeed, in line with earlier17
research, we found that people who agreed with current governmental restrictions were less
likely to believe in misinformation (b = -0.18, CI = [-0.26, -0.09]). Similarly, respondents who
did not object to the government curtailing personal freedoms were less inclined to believe in
misinformation (bcombined = -0.35, CI = [-0.44, -0.24]).
What role do demographic variables play in the propensity to believe misinformation?
Unsurprisingly, a higher level of education was associated with lower belief in misinformation
(bcombined = -0.21, CI = [-0.28, -0.14]). Having a migration background was associated with
higher belief in misinformation (bcombined = 0.43, CI = [0.25, 0.16])—perhaps because
immigrants find it more difficult to discern between reliable and unreliable sources (e.g.,
different German newspapers). We explored to what extent recency of immigration mattered:
Did a respondent’s parents or the respondent themselves immigrate to Germany? We found
a slightly stronger effect of being a first-generation (bcombined = 0.78, CI = [0.41, 1.14]) than a
second-generation immigrant (bcombined = 0.67, CI = [0.37, 0.97]). However, membership of
both groups was reliably associated with higher belief in misinformation than among
respondents without a migration background. The effect of age was inconsistent across
Waves (a positive association in Wave 2 and a negative association in Wave 3), so we do
not interpret it further.
Finally, voting intentions (assessed in Wave 3 only) were highly predictive of belief in
false information. There was a credible link between the intention to vote for the AFD, a right-
wing populist and in parts extremist political party, and belief in misinformation (bcombined =
0.53, CI = [0.19, 0.90]). At the same time, left/right wing self-placement was not credibly
linked with belief in misinformation—probably because the multiple political parties in
Germany do not map as easily onto the left/right divide as in the United States or the United
Kingdom (Grabow & Pokorny, 2018). The link between belief in misinformation and far-right
political leanings echoes findings from other countries showing that conservative ideology
plays a notable role in the endorsement of conspiracy theories (Linden et al., 2021; Miller et
al., 2016).18
Sept. 2020 Febr. 2021
Trust: Local health authorities
Trust: Doctors
Trust: Federal government
Trust
Trust: Scientists
Trust: Robert Koch−Institute
Trust: The Federal Ministry of Health
Trust: Local government
Source: Neighbors
Source: Tabloids
Source: Social media
Source: Private−sector television
Source: Alternative
Source: Scientific institutes
Source: Regional newspapers
Sources
Source: Podcasts
Source: Global health organizations
Source: Radio stations
Source: Colleagues
Source: Local news
Source: Government
Source: National health organizations
Source: Public−sector television
Source: Friends and family
Source: National newspapers
Infection (social circle)
Infection (self)
Risk
Seven−day incidence
Risk group (self)
Risk group (social circle)
Migration background (yes)
Dem.
Gender (female)
Age
Education (years)
Political leaning (left right)
Att.
Current measures (agreement)
Political intervention (agreement)
AFD
Die Linke
Party
CDU/CSU
SPD
FDP
Die Grünen
−0.4 0.0 0.4 0.8 −0.5 0.0 0.5
Coefficient on belief in misinformation
Figure 5. Regression analyses predicting individual differences in belief in misinformation in Waves 2 and 3. Dots
and error bars represent means and 95% (50%) highest density intervals of the posterior predictive distribution.
Dem. = demographic characteristics; Att. = attitudinal measures; Party = Political party respondent would vote for
in an upcoming election. Credible associations are shown in red. Results of a multivariate binomial regression
predicting belief in a statement from the covariates shown, controlling for individual respondents using a random
intercept (1|respondent) and statement as a fixed effect. Coefficients in the figure are based on one regression
per data collection. Political leaning and the political party a respondent would vote for in an upcoming election
were only assessed in Wave 3.
In sum, our data converge with findings from other studies on how belief in
misinformation is associated with, for example, trust in the government, support for freedom-
curtailing public health measures, and leaning toward a right-wing populist agenda. In
addition, we found close links between migration background and misinformation beliefs.
Interestingly, getting information on COVID-19 from one’s neighbours, but not friends, also
appeared to be associated with beliefs in misinformation.19
Discussion
In autumn 2020, the WHO and other supranational organisations (WHO, UN, UNICEF, et al.,
2020) joined force to publish a statement emphasizing that:
“Coronavirus disease is the first pandemic in history in which technology and social
media are being used on a massive scale to keep people safe, informed, productive
and connected. At the same time, the technology we rely on to keep connected and
informed is enabling and amplifying an infodemic that continues to undermine the
global response and jeopardizes measures to control the pandemic.”
Managing this infodemic is a crucial part of controlling the current and future pandemics, as
well as other global crises. States need to provide their citizens with accurate and reliable
information (e.g., on how to avoid infection or get vaccinated) but also actively combat
misinformation. Here, we aim to contribute to such efforts by beginning to measure the
misinformation problem in Germany: How widespread are beliefs in false information? Which
of the false statements presented were most persuasive? Which intuitive competences do
people have for dealing with misinformation? Who is especially prone to misinformation?
Our findings showed that the perceived prevalence of misinformation increased over
the three Waves of assessment (June 2020, September 2020 and February 2021).
According to our respondents, the topics most contaminated with misinformation are the
origins of the pandemic and statistics on the numbers of infections, hospitalisations and
deaths. In Wave 3, information on vaccines was also often perceived to include falsehoods.
Vaccine misinformation interferes with people's willingness to get vaccinated, particularly
when the misinformation is “scientific-sounding” (Loomba et al., 2021). These findings
paradigmatically illustrate how insidious misinformation can be for the individual believer but
also for the public good. Unfortunately, one of the more popular erroneous beliefs was that
the EU has approved dangerous vaccines. This belief, along with the belief that a20
coronavirus infection is no worse than the flu (see Figure 5) may thwart the goal of reaching
herd immunity.
In terms of individual differences, people with right-wing voting intentions, lower trust
in the government, the RKI and the Federal Ministry of Health, and lower levels of education
were more likely to believe in misinformation. These findings converge with findings from the
United Kingdom, Ireland, Mexico, Spain, and the United States (Roozenbeek et al., 2020).
The association with political leaning indicates that the information landscape of the COVID-
19 pandemic may be politically divisive and that the related misinformation and conspiracy
theories may be ideologically motivated and polarized, similarly to other politically divisive
topics, such as vaccination hesitancy or climate science denial (see also Rutjens et al.,
2021). Moreover, respondents with a migration background and those who got information
on the pandemic from their neighbours were more prone to believe in misinformation. These
findings are consistent with the idea that (mis-)information spreads differently in different
social clusters and milieus. In a similar vein, previous research has found geographic
clusters in vaccine refusal (Lieu et al., 2015). Vaccine refusal can also be impacted by beliefs
in misinformation (Roozenbeek et al., 2020), especially misinformation that creates fear
around the vaccine.
The good news is that a large proportion of our respondents were able to detect
misinformation for most of the statements. In addition, a large proportion of respondents
were able to identify cues that can help to detect misinformation (e.g., untrustworthy sources)
and strategies that can be used to determine the truth of a statement (e.g., cross-checking
sources).
Some limitations of our study warrant consideration: We relied on self-reports in
closed-ended questions (the “other” option with an open text field was used only
infrequently). Respondents may have given socially desirable answers (e.g., few said they
would share misinformation). Prior research has shown that even when people’s stated
preference is to share only accurate content, the actual decision to share information on
social media is often not related to accuracy (Pennycook et al., 2021). The authors attribute21
this to inattention rather than motivated reasoning (Pennycook & Rand, 2021). Still, our
finding that only a small fraction of respondents said that they would share false information
is consistent with earlier research: One study found that 0.1% of users were responsible for
sharing 80% of the fake news (Grinberg et al., 2019).
Another caveat is that the topic list we provided to respondents was updated across
the three Waves as the information landscape evolved. For example, we did not offer the
response option “risks and benefits of vaccinations'' in Wave 1 before vaccines became
available. We made sure, however, that the initial topic list was presented in all three Waves.
Lastly, although our samples are representative of residents living in Germany with respect
to age, gender and federal state, they are biased towards online-literate populations.
We close by outlining some directions for policy interventions that emerge from our
findings. First, we found that people who rely on their neighbours as a source of information
and/or people with a migration background as well as people with a lower education are, on
average, more likely to believe in misinformation. This speaks for designing COVID-19
prevention measures that target not only the individual but also their social environments
(calls to do so already exist, e.g. see Ärzteblatt, 2021). In this vein, public health authorities
in Germany have begun to roll out vaccination campaigns in neighbourhoods with low
vaccination rates by providing low-threshold, easy-to-understand information on the vaccine
directly on site in face-to-face conversation (dortmund.de, 2021) or through promotional and
educational videos targeting specific immigrant groups (e.g., Arabic speakers; (WDR, 2021).
Second, we found evidence for widespread use of efficient strategies for checking a
statement’s truth status. For instance, roughly half of our respondents described cross-
checking information on independent websites. Such lateral reading strategies have been
found to be a more accurate and less time-consuming way of identifying misinformation than
staying within a webpage and searching for potential truth indicators such as logos and
domain names (Wineburg & McGrew, 2017). Low-threshold training in the use of such
simple strategies as well as related boosting interventions (Hertwig & Grüne-Yanoff, 2017)—
e.g., teaching people to question underlying goals of a particular information source—are22 thus another entry point for policy interventions (see also Kozyreva et al., 2020). Relatedly, inoculation interventions aimed at instilling cognitive resilience and competences (e.g., van der Linden et al., 2020), as well as the widespread availability of easily accessible, understandable and high-quality information may help to reduce these uncertainties. Conclusion In sum, we propose a two-pronged approach to help people navigate on- and offline (mis- )information in Germany: interventions to boost individual information literacy (e.g., by educating people about simple cues and strategies for detecting misinformation) but also investments in the provision of understandable and high-quality information in people’s proximate environments. It is not a case of the more information the better—but of ensuring that reliable information is easily accessible in different places. The spread of misinformation about the coronavirus and vaccination can strongly impact how well countries around the globe are able to respond to the COVID-19 health crisis. How citizens consume and evaluate information is a key factor in the spread of misinformation. Investing in both the quality of the information ecology as well as in citizens’ competence to tell accurate from inaccurate information therefore promises high returns.
23

References

Ärzteblatt. (2021, March 23). Coronakonzepte für soziale Brennpunkte stärken.
    https://www.aerzteblatt.de/nachrichten/121876/Coronakonzepte-fuer-soziale-
    Brennpunkte-staerken
Betsch, C., Korn, L., Felgendreff, L., Eitze, S., Schmid, P., Sprengholz, P., Wieler, L.,
    Schmich, P., Stollorz, V., Ramharter, M., Bosnjak, M., & Omer, S. B. (2020). COVID-19
    snapshot monitoring (COSMO Germany) - wave 1 [Data set]. PsychArchives.
    https://doi.org/10.23668/PSYCHARCHIVES.4204
Bürkner, P.-C. (2017). brms: An R Package for Bayesian Multilevel Models Using Stan.
    Journal of Statistical Software, Articles, 80(1), 1–28. https://doi.org/10.18637/jss.v080.i01
Correctiv. (2020). Coronavirus-Faktenchecks: Diese Behauptungen hat CORRECTIV
    geprüft. Correctiv. https://correctiv.org/faktencheck/hintergrund/2021/06/22/coronavirus-
    faktenchecks-diese-behauptungen-hat-correctiv-geprueft/
COSMO Explorer. (2020). https://projekte.uni-erfurt.de/cosmo2020/web/topic/vertrauen-
    ablehnung-demos/30-verschwoerung/
dortmund.de. (2021, January 6). Mobile Impfteams sind vom 4. bis 6. Juni in der Innenstadt-
    Nord im Einsatz. Dortmund.de.
    https://www.dortmund.de/de/leben_in_dortmund/nachrichtenportal/alle_nachrichten/nach
    richt.jsp?nid=666707
Freeman, D., Waite, F., Rosebrock, L., Petit, A., Causier, C., East, A., Jenner, L., Teale, A.-
    L., Carr, L., Mulhall, S., Bold, E., & Lambe, S. (2020). Coronavirus conspiracy beliefs,
    mistrust, and compliance with government guidelines in England. Psychological
    Medicine, 1–13. https://doi.org/10.1017/S0033291720001890
Freitas, A. (2021, September 7). Em 920 dias como presidente, Bolsonaro deu 3324
    declarações falsas ou distorcidas. Aosfatos. https://www.aosfatos.org/todas-as-
    declara%C3%A7%C3%B5es-de-bolsonaro/
Garrett, P. M., White, J. P., Lewandowsky, S., Kashima, Y., Perfors, A., Little, D. R., Geard,
    N., Mitchell, L., Tomko, M., & Dennis, S. (2021). The acceptability and uptake of
    smartphone tracking for COVID-19 in Australia. PloS One, 16(1), e0244827.
    https://doi.org/10.1371/journal.pone.0244827
Grabow, K., & Pokorny, S. (2018). Das Parteiensystem in Deutschland ein Jahr nach der
    Bundestagswahl. Konrad-Adenauer-Stiftung eV.
Greenberg, J. (2020, September 22). 10 of Donald Trump’s big falsehoods about COVID-19.
    Politifact. https://www.politifact.com/article/2020/sep/27/10-donald-trumps-big-
    falsehoods-about-covid-19/
Grinberg, N., Joseph, K., Friedland, L., Swire-Thompson, B., & Lazer, D. (2019). Fake news
24
on Twitter during the 2016 U.S. presidential election. Science, 363(6425), 374–378.
https://doi.org/10.1126/science.aau2706
Hertwig, R., & Grüne-Yanoff, T. (2017). Nudging and Boosting: Steering or Empowering
Good Decisions. Perspectives on Psychological Science: A Journal of the Association
for Psychological Science, 12(6), 973–986. https://doi.org/10.1177/1745691617702496
Hornik, R., Kikut, A., Jesch, E., Woko, C., Siegel, L., & Kim, K. (2021). Association of
COVID-19 Misinformation with Face Mask Wearing and Social Distancing in a Nationally
Representative US Sample. Health Communication, 36(1), 6–14.
https://doi.org/10.1080/10410236.2020.1847437
Kim, M., & Cao, X. (2016). The Impact of Exposure to Media Messages Promoting
Government Conspiracy Theories on Distrust in the Government: Evidence from a Two-
Stage Randomized Experiment. International Journal of Communication Systems, 10(0),
20. https://ijoc.org/index.php/ijoc/article/view/5127
Kozyreva, A., Lewandowsky, S., & Hertwig, R. (2020). Citizens Versus the Internet:
Confronting Digital Challenges With Cognitive Tools. Psychological Science in the Public
Interest: A Journal of the American Psychological Society, 21(3), 103–156.
https://doi.org/10.1177/1529100620946707
Leuker, C., Hertwig, R., Gumenik, K., Eggeling, L. M., Hechtlinger, S., Kozyreva, A.,
Samaan, L., & Fleischhut, N. (2020). Wie informiert sich die Bevölkerung in Deutschland
rund um das Coronavirus? Umfrage zu vorherrschenden Themen und Gründen, dem
Umgang mit Fehlinformationen, sowie der Risikowahrnehmung und dem Wissen der
Bevölkerung rund um das Coronavirus. https://doi.org/10.17617/2.3247925
Lieu, T. A., Ray, G. T., Klein, N. P., Chung, C., & Kulldorff, M. (2015). Geographic clusters in
underimmunization and vaccine refusal. Pediatrics, 135(2), 280–289.
https://doi.org/10.1542/peds.2014-2715
Li, H. O.-Y., Bailey, A., Huynh, D., & Chan, J. (2020). YouTube as a source of information on
COVID-19: a pandemic of misinformation? BMJ Global Health, 5(5), e002604.
https://doi.org/10.1136/bmjgh-2020-002604
Linden, S., Panagopoulos, C., Azevedo, F., & Jost, J. T. (2021). The Paranoid Style in
American Politics Revisited: An Ideological Asymmetry in Conspiratorial Thinking. In
Political Psychology (Vol. 42, Issue 1, pp. 23–51). https://doi.org/10.1111/pops.12681
Loomba, S., de Figueiredo, A., Piatek, S. J., de Graaf, K., & Larson, H. J. (2021). Measuring
the impact of COVID-19 vaccine misinformation on vaccination intent in the UK and
USA. Nature Human Behaviour, 5(3), 337–348. https://doi.org/10.1038/s41562-021-
01056-1
Miller, J. M., Saunders, K. L., & Farhart, C. E. (2016). Conspiracy endorsement as motivated
reasoning: The moderating roles of political knowledge and trust. American Journal of25
Political Science, 60(4), 824–844. https://doi.org/10.1111/ajps.12234
OFCOM. (2020). Half of UK adults exposed to false claims about coronavirus.
https://www.ofcom.org.uk/about-ofcom/latest/features-andnews/half-of-uk-adults-
exposed-to-false-claimsabout-coronavirus
Paz, C. (2020, February 11). All the President’s Lies About the Coronavirus. The Atlantic.
https://www.theatlantic.com/politics/archive/2020/11/trumps-lies-about-
coronavirus/608647/
Pennycook, G., Epstein, Z., Mosleh, M., Arechar, A. A., Eckles, D., & Rand, D. G. (2021).
Shifting attention to accuracy can reduce misinformation online. Nature, 592(7855), 590–
595. https://doi.org/10.1038/s41586-021-03344-2
Pennycook, G., & Rand, D. G. (2019). Fighting misinformation on social media using
crowdsourced judgments of news source quality. Proceedings of the National Academy
of Sciences of the United States of America, 116(7), 2521–2526.
https://doi.org/10.1073/pnas.1806781116
Pennycook, G., & Rand, D. G. (2021). The Psychology of Fake News. Trends in Cognitive
Sciences, 25(5), 388–402. https://doi.org/10.1016/j.tics.2021.02.007
Plohl, N., & Musil, B. (2021). Modeling compliance with COVID-19 prevention guidelines: the
critical role of trust in science. Psychology, Health & Medicine, 26(1), 1–12.
https://doi.org/10.1080/13548506.2020.1772988
RKI. (2021a, June 23). 7-Tage-Inzidenzen nach Bundesländern und Kreisen.
https://www.rki.de/DE/Content/InfAZ/N/Neuartiges_Coronavirus/Daten/Fallzahlen_Kum_
Tab.html
RKI. (2021b, June 23). Antworten auf häufig gestellte Fragen zum Coronavirus SARS-CoV-
2. SARS-CoV-2 FAQs. https://www.rki.de/SharedDocs/FAQ/NCOV2019/gesamt.html
Roozenbeek, J., Schneider, C. R., Dryhurst, S., Kerr, J., Freeman, A. L. J., Recchia, G., van
der Bles, A. M., & van der Linden, S. (2020). Susceptibility to misinformation about
COVID-19 around the world. Royal Society Open Science, 7(10), 201199.
https://doi.org/10.1098/rsos.201199
Rutjens, B. T., van der Linden, S., & van der Lee, R. (2021). Science skepticism in times of
COVID-19. Group Processes & Intergroup Relations: GPIR, 24(2), 276–283.
https://doi.org/10.1177/1368430220981415
Sessa, M. G. (2020). COVID-19 Conspiracy Theories: Comparative trends in Italy, France,
and Spain. EU Disinfo Lab. https://www.disinfo.eu/publications/covid-19-conspiracy-
theories-comparative-trends-in-italy-france-and-spain
Statista. (2021, January 7). Brazil: Bolsonaro’s fake statements on the novel Coronavirus by
month 2020-2021. Statista. https://www.statista.com/statistics/1118867/bolsonaro-fake-
statements-coronavirus/You can also read