MOTU RESEARCH UPDATE - ISSUE 28 - NOVEMBER 2018 - NOVEMBER 2018 New ...
←
→
Page content transcription
If your browser does not render page correctly, please read the page content below
ECONOMIC AND PUBLIC POLICY RESEARCH

                           MOTU RESEARCH UPDATE - ISSUE 28 - NOVEMBER 2018
                                      New data tool scores countries on human rights performance
This year, the Universal Declaration of Human Rights marks its 70th anniversary, but despite progress in some areas, it remains difficult to measure or
compare governments’ performance. We have yet to develop comprehensive human rights measures that are accepted by researchers, policymakers and
advocates alike. With this in mind, Anne-Marie Brook, a policy fellow at Motu, and some colleagues from the USA started the Human Rights Measure-
ment Initiative (HRMI), the first global project to develop a comprehensive suite of metrics covering international human rights. Earlier this year, HRMI
released its beta dataset and data visualisation tools, publishing 12 metrics that cover five economic and social rights and seven civil and political rights.

Lack of human rights data
People often assume the UN already produces comprehensive data on nations’ human rights performance, but it does not, and likely never will. The
members of the UN are governments, and governments are the very actors that are obligated by international human rights law. It would be naïve to hope
for governments to effectively monitor and measure their own performance without political bias. There has to be a role for non-state measurement. We
hope that the data and visualisations provided by HRMI will empower practitioners, advocates, researchers, journalists and others to speak clearly about
human rights outcomes worldwide and hold governments accountable when they fail to meet their obligations under international law.

The HRMI pilot
HRMI has developed a new way of measuring civil and political human rights. This involves sending an expert survey directly to human rights
practitioners who are actively monitoring each country’s human rights situation. The survey asks respondents about their country’s performance on the
rights to assembly and association, opinion and expression, political participation, freedom from torture, freedom from disappearance, freedom from
execution, and freedom from arbitrary or political arrest and imprisonment.
Based on those survey responses, HRMI develops data on the overall level of respect for each of the rights. These data are calculated using a statistical
method that ensures responses are comparable across experts and countries, and with an uncertainty band to provide transparency about how confident
we are in each country’s placement. HRMI also provides information on who our respondents believed were especially at risk for each type of human
rights violation.

Australia’s Human Rights Performance
One way to visualise data on our website is to look at a country’s performance across
all 12 human rights for which we have released data at this time.
Looking at civil and political rights (in blue), Australia demonstrates high respect for
the right to be free from execution but does much worse on the rights to be free from
torture and arbitrary arrest. The HRMI survey respondents often attributed this poor
performance on torture and imprisonment to the treatment of refugees, immigrants
and asylum seekers, as well as Indigenous peoples, by the Australian government.
Looking across the economic and social rights (in green), Australia shows a range
of performance, doing quite well on the right to food, but performing far worse on
the right to work. (Data necessary to calculate a metric for the right to housing at
a high-income OECD assessment standard is currently unavailable for Australia.)

Freedom from torture across countries
Another way to visualise the HRMI data is to look at respect for a single right across
several countries. The graph below shows overall government respect for the right to
be free from torture and ill treatment in all 13 of HRMI’s pilot countries between
January and June 2017. Here, the middle of each blue bar (marked by the small
horizontal white lines) represents the average estimated level of respect for freedom
from torture, while the length of the blue bars demonstrate our certainty in our
estimates. For instance, we are much more certain regarding Mexico’s (MEX) low
score than Brazil’s (BRA) higher score. Due to this uncertainty and the resulting
overlap between the bars, there is only a 92% chance that Brazil’s score is better than
Mexico’s.
In addition to being able to say that torture is probably more prevalent in Mexico
than in Brazil, and how certain we are in that comparison, we can also compare the
groups of people that our respondents said were at greatest risk of torture. There is
much more to be learned from the visualisations and data on the HRMI website and
we encourage you to have a look for yourself.

 Director’s Letter, Publications and Events ....................................... 2                  Motu Publications ............................................................................ 6
 A New Zealand-focused global model for climate policy analysis .... 3                                 Regional complexity and growth ...................................................... 7
 Parenthood and the gender wage gap .............................................. 4                   Wellbeing and the living standards framework ................................. 8
 Our People ...................................................................................... 5   © 2018 Motu Economic and Public Policy Research Trust & the authors.
                                                                                                                                                                               ISSN 1175-0206
ECONOMIC AND PUBLIC POLICY RESEARCH

Director’s Letter
Over the last year Motu has undertaken an exciting range of important projects. The following examples illustrate their breadth and depth:
•    more than 75 external presentations, 14 externally published articles, 13 Motu Working Papers and, in several cases, significant media comment;
•    the completion of the pilot phase of the Human Rights Measurement Initiative (HRMI), including harnessing international enthusiasm and funding;
•    two major research papers on the gender wage gap that generated significant press attention;
•    research to increase the role that native forests can play in helping to bring economic, environmental and social benefits to Māori on the East Cape;
•    work with two National Science Challenges: the Deep South and Building Better Homes, Towns and Cities;
•    Shaping New Zealand’s Low-Emission Future, a project to help inform climate change policymaking and private-sector actions, and significantly
     benefit New Zealand’s longer-term development; and
•    ongoing work with Te Pūnaha Matatini, a Centre of Research Excellence focused on the characterisation and analysis of complex systems and networks.
With sadness, but no little pride, Motu has announced that Suzi Kerr has accepted a position as the Chief Economist at Environmental Defense Fund in
New York and will leave Motu in April 2019. Suzi’s new role is a recognition of everything she has built over the course of her distinguished career and an
acknowledgement of her world-class work. We have been blessed to have Suzi’s passion and intellect at Motu, and her role in our genesis is part of what
makes us the organisation we are today. That legacy will stay with us in how we look to build economic and public policy capacity in Aotearoa and in our
commitment to contributing strong, non-partisan research.
One of the great contributions Suzi made to Motu was in helping to hire Isabelle Sin back in the early 2000s. Izi was one of our first research analysts when
she was just out of Canterbury University, back when the organisation was getting started. She went on to gain an impressive doctorate from Stanford
before returning to Motu as a Fellow. This year, we promoted her to Senior Fellow, and watched as she was appointed to the Government’s Fair Pay Agree-
ment Working Group, and handled media, policymakers, politicians and researchers with incisive aplomb in relation to her gender wage gap research.
We also appointed a brand-new Senior Fellow. Niven Winchester worked at the Massachusetts Institute of Technology (MIT) for 10 years and wanted to
return home to New Zealand. His research focuses on analyses of climate, energy and trade policies using computable general equilibrium models. Niven
provides Aotearoa with much-needed expertise in modelling; in fact, his research on sports ranking systems was the catalyst for the change to the bonus
point system in Super Rugby in 2016.
In addition, we have employed two new Fellows this year. Lynn Riggs has extensive experience with large confidential data sets and researches health,
labour, education and financial economics. Élodie Blanc has also been working at MIT, and her research interests include agricultural economics, applied
econometrics, water modelling and crop modelling. We also welcomed new research analysts Ben Davies, Dom White and Sophie Hale, who are hitting
their paces well.
I am constantly amazed at how this unique organisation punches above its weight. It has been an honour and a privilege for me to be part of this journey.
Soon, however, it will be time for me to hand the baton to an Executive Director, with whom I look forward to working as I return to my role as an
enthusiastic Board member.

Lesley Haines, Interim Director

Motu Publications                                                                Public Policy Seminars
Motu is committed to making the results of its research on key issues            Motu’s Public Policy Seminar series provides a forum for informed debate
facing New Zealand accessible to public and private decision-makers and          on important public policy issues. Through the series, we aim to make
the general public.                                                              the latest economic research more accessible to inform policy debates in
                                                                                 New Zealand.
Subscriptions to our two publication series, the Motu Working Paper
Series and Motu Notes, are both available free from our website. You can         Our seminars are accessible to a wide audience, and are attended by
also sign up to receive all our work in a particular research area.              people from diverse backgrounds who want to stay informed on
                                                                                 economic, social and public policy research.
You can also sign up for events and our newsletters: Motu News
(bimonthly) and Motu Research Update (annual). If you like shorter,              The seminars are presented by Motu Senior Fellows and Affiliates, as well as
more regular updates, you may prefer Motu News; if you want more sub-            other top visiting academics from around the world. These seminars are free
stantive and less frequent updates, you will prefer Motu Research Update.        to the public, and there is no need to register to attend.

We also have a biannual bulletin designed to inform policy analysts and          Since the last newsletter, we have hosted a number of Public Policy
researchers of upcoming research and analysis.                                   Seminars. Presentation material from these seminars, including slides, is
                                                                                 available online.

                   To receive our email publications, or for invitations to Motu seminars, sign up at http://motu.nz/newsletter/.

                                                                     MOTU.ORG.NZ
ECONOMIC AND PUBLIC POLICY RESEARCH

                        A New Zealand-focused global model for climate policy analysis
As New Zealand joins with other countries to achieve net zero greenhouse gas emissions by later this century, it will come under increasing pressure from
changing economic opportunities and global consumer preferences, the emergence of potentially disruptive new technologies, natural resource constraints,
and evolving social and political drivers. New Zealand faces the challenge of developing its economy in ways that will not only be resilient to those future
pressures, but also sustain the well-being of both urban and rural communities as well as our natural environment.

High-quality modelling tools and data are essential for making robust decisions on New Zealand’s transition to a low-emission economy in a changing
and uncertain world. Drawing from a stocktake of modelling capability and needs in New Zealand developed in collaboration with a broad range of
experts, we have identified the need – and opportunity – to develop an integrated framework for climate change mitigation modelling in New Zealand.

WHAT IS A MODEL?
A model is a simplified representation of reality that focuses on the key factors and (cause-and-effect) relationships of a phenomenon. Models describe how
these factors are related, and the strengths of the different relationships. Constructing a model requires scientists to specify their assumptions explicitly,
identify the phenomena they are concerned with, explain their methodology and use data to calibrate the model. By capturing the key agents, elements,
processes and decisions, models enable complex systems and situations to be understood and complex problems to be solved.

People may think like a modeller when making a decision in a complex situation. They select certain key details, make assumptions about details they have
ignored, and apply judgement to inform their decisions. Scientists make these models more explicit.

WHY ARE THERE DIFFERENT MODELS?
Modelling climate change mitigation options requires, among other factors,
•    characterising farm-level production and alternative production techniques;
•    identifying the drivers of land-use change at national and regional scales;
•    resolving hourly electricity demand, intermittent electricity generation from wind and solar, and inter-annual variation in the availability of hydro-
     electricity;
•    characterizing the fleet of transportation vehicles and barriers to the adoption of electric vehicles; and
•    representing interactions among different sectors of the economy.

Different types of models can be required to answer different types of questions, to model different situations and to work at different levels of detail.
Such models typically apply different assumptions, face different limitations, and use different data, levels of detail, and methodologies. As the economic,
environmental and other impacts from changes in technologies, land-use, policies and practices may be too complex for any one model to capture fully,
using multiple models in combination can provide a more complete and robust understanding. In addition, cross-model comparisons can be used to
help validate the different models. Furthermore, models that represent one aspect of an economy in detail can be used to inform models with a broader
representation.

MODELS IN NEW ZEALAND
Under the Paris Agreement, New Zealand must transition toward a net-zero-emissions economy. As a matter of both near-term urgency and enduring
need, building on a sound foundation of existing work, improved modelling would assist New Zealand to design an effective portfolio of policies and mea-
sures to reduce emissions and manage the distributional effects on regions, sectors, communities and households. More specifically, models are required to
set emission-reduction goals, and in the shorter term, emission budgets, ETS caps and price safeguards. These decisions need to take into account changes
in technologies, policies and markets, both in New Zealand and internationally.

Earlier this year, Motu Economic and Public Policy Research convened two workshops in Wellington, New Zealand, bringing together some of the coun-
try’s most expert researchers in agriculture and resource economics, energy sector economics, and economy-wide modelling from government, research
institutions and industry organisations. The intent of the workshops was to begin designing a more strategic approach across the modelling community.

AN INTEGRATED FRAMEWORK
We believe we need to create an integrated framework for climate change mitigation modelling in New Zealand. This framework would regularly bring to-
gether a suite of models and a network of researchers to assess climate change mitigation policies. Core elements of the framework would include a central
repository of data, common input assumptions and scenarios, and a “dashboard” that synthesises results from different models, allowing decision-makers
to understand and apply the insights from the models more easily. The framework would also have several other benefits. First, it could be used to improve
linkages among models and ultimately allow each model to capitalise on the strength of other models in the framework. Second, enabling modellers to
access high-quality datasets and apply consistent assumptions and scenarios would improve transparency and facilitate comparison of model outputs.
Third, the framework would provide a centralised, formal channel for international collaboration.

Sustained investment in a modelling framework will create an “ecosystem” for climate change mitigation modelling in New Zealand. It would help to
ensure that New Zealand’s models are fit for purpose and ready to deploy when the policy demand becomes urgent.

                                                                     MOTU.ORG.NZ                                                                                 3
ECONOMIC AND PUBLIC POLICY RESEARCH

                                               Parenthood and the gender wage gap
In New Zealand, the gender pay gap has fallen over the past 20 years and it is now below 10%. Earlier research shows that a high proportion of the gender
pay gap can’t be explained by differences in observable information, such as age, education, occupation and industry, and nor is it due to differences in
productivity.

New Zealand is similar to the rest of the world in that the gender pay gap is larger among parents than people without children, although the reasons
for this are not entirely clear. Our research uses newly combined data to describe what happens to men’s and women’s employment and wages after they
become parents. It shows a strongly gendered labour response to parenthood: women dramatically decrease their employment and work fewer hours
if they are employed, whereas men’s employment and hours worked barely change. Mothers, particularly those with high incomes before parenthood,
experience lower monthly incomes and hourly wages than before they had children. These reductions are larger the longer they are away from paid work,
and persist for at least ten years. Furthermore, high-income women who return to paid employment soon after becoming parents experience dramatically
and persistently slower rates of income growth compared to before. They are therefore likely to have much lower lifetime earnings than similarly high-
income men who become fathers.

Changes in employment and earnings for women after giving birth are likely to be related to social norms as well as the ability to breastfeed. We need to
ask why so few men become the primary caregiver of their children?

Employment gaps
Our work shows that few men stop paid employment after having a child, but only three out of five first-time mothers do any paid work before their child’s
first birthday. Women with higher incomes and those with higher qualifications before parenthood return more quickly to work after childbearing and
maintain higher employment rates. Only 45% of mothers with no qualifications are employed ten years after their first baby, compared with over 60% of
those with a school or higher qualification and nearly 70% of those with a bachelor’s degree.

Women who became mothers when aged 25 to 34 have higher employment rates after having children than older women. The employment rate of those
who became mothers when aged under 25 is lowest (only 34% in their child’s second year). Before becoming mothers, Māori and Pacific women are far
more likely not to be employed than Pākehā (New Zealander of European descent) women, but this gap narrows in percentage point terms after they
become mothers. Pākehā mothers have a 59% employment rate in their child’s tenth year compared with 41% for Pacific mothers and 45% for Māori
mothers.

Monthly wage earnings
Monthly wage earnings are driven by a combination of hourly wages and monthly hours worked. They are important for a parent’s ability to support his
or her family and for lifetime earnings. Across every pre-parenthood income quartile, employed women experience decreases in monthly earnings when
they have children, while men do not. The decreases are larger for women who return to work more slowly.

Time out of employment matters more for high-income women, but even those who return to work quickly experience much slower income growth
after becoming parents. Prior to parenthood, these women were on a trajectory to be very high earners, and the dampening of their income growth helps
explain why relatively few women appear in the highest income brackets. Their fast return to employment does, however, increase their earnings lead
over their slower-returning colleagues. In contrast, low-income women who are employed experience small monthly income decreases with parenthood
and similar income growth rates before and after having children. However, this isn’t necessarily a positive sign, as it could merely indicate that they were
underemployed before motherhood.

In terms of ethnic differences, monthly income for Māori, Pacific Peoples and Asian mothers in paid employment is slightly higher in the second year after
their child’s birth than in the second year before it. Over the same period, employed Pākehā mothers experience the largest decrease in monthly income.

Work hours and wages
Employed mothers work a median of 27 hours, down from a pre-parenthood median of 40 hours. The longer a woman spends out of work the fewer hours
she works on average upon her return. Women who return to work in the first six months work a median of 30 hours, those who returned in months 7
to 12 work a median of 27 hours, and those who return after month 12 work a median of 22 hours. Men work a median of 41 hours both before and
after becoming parents.

It isn’t just a decrease in hours that contributes to the wage gap. Across our sample (which is not representative of the population and so differs from the
official gender wage gap), women earn 6.8% lower hourly wages than men of the same age and education. The wage difference is 5.7% between men and
women without children, but 12.5% between men and women who are parents.

When men become parents, their hourly wages aren’t significantly affected. Women, on the other hand, pay a price. Their hourly wages decrease by 4.4%
compared with the wages they could have expected without children. This wage penalty for motherhood varies substantially with how long the woman
stays at home. The longer they stay at home, the bigger the drop in their hourly wages. Only some of this drop in pay can be explained by mothers moving
to lower-paying industries and occupations.

Our research shows that parenthood exacerbates pre-parenthood gender wage gaps, with time out of work and reduced hours both playing major roles. We
believe that we won’t see equality in the labour market until it is just as common for a dad to stay home with the kids as it is for a mum. While many mothers
may want to take time away from work to raise their children, this should be a personal (or family) choice and not the result of traditional gender roles.
ECONOMIC AND PUBLIC POLICY RESEARCH

Our People                                                                 university. We also build capacity through the employment of up-and-
                                                                           coming research analysts and summer interns.
Comings and Goings
                                                                           In 2018, the research analyst team was joined by Ben Davies, Dom White
The culture and ethos of Motu have their beginnings in the way the         and Sophie Hale. We have also had several local and international interns
organisation was dreamed up by Suzi Kerr and Dave Maré as graduate         spend time at Motu.
students at Harvard in the 1990s. In 2019, Suzi Kerr will step down
as a Senior Fellow to become Chief Economist at the Environmental          Staff List
Defense Fund (EDF) in New York. This is an incredible achievement          Interim Director: Lesley Haines
for her and we wish her well amidst our own sadness. Suzi’s work with
EDF will build on the expertise she has developed while at Motu and is a   Senior Fellows: Arthur Grimes, David C. Maré, Dean R. Hyslop, Isabelle
unique opportunity for the contributions she has made to environmental     Sin, Niven Winchester, Suzi Kerr
economics in New Zealand to assume an even more global form. Suzi’s        Fellows: Angela Halliday, Anne-Marie Brooke, Catherine Leining, Élodie
career move can also be viewed as part of the gaining influence of Motu    Blanc, Levente Timar, Lynn Riggs, Trinh Le
on the international stage. We look to our continuing relationship with
Adam Jaffe as an inspiration for how we can work with our distinguished    Senior Research Associate: Adam B. Jaffe
alumni.                                                                    Research Analysts: Ben Davies, Dom White, Edmund Lou, Kate Preston,
Awards and Recognition                                                     Sally Owen, Sophie Hale

Motu is the top-ranked economics organisation in New Zealand. It is        Support Staff: Ceridwyn Roberts, Grant Coppersmith, Maxine Watene,
in the top ten global economic think tanks, according to the Research      Pela Arathimos
Papers in Economics (RePEc) website, which ranks all economists and        Board of Trustees
economic research organisations in the world based on the quantity and
quality of their research publications.                                    Bruce Wills (Chair), Adam B. Jaffe, David C. Maré, Jo Wills, Lesley
                                                                           Haines, Paul Reynolds, Peter O’Shea, Stephen Goldson.
In 2018, Motu was rated tenth in the world for climate change work
internationally and second for think tanks outside of Europe and North     Affiliates
America in the standardised Think Tank Rankings by the International
Center for Climate Governance.                                             Adolf Stroombergen, Andrew Coleman, Deborah Cobb-
                                                                           Clark, Grant Scobie, Jacques Poot, James Sanchirico, John
Capacity Building                                                          McDermott, Les Oxley, Lew Evans, Lynda Sanderson, Malathi
One of Motu’s crucial roles is to expand this country’s econom-            Velamuri, Philip McCann, Richard Fabling, Richard Newell, Robert
ic and policy capability. We have just launched a new scholarship for      MacCulloch, Sholeh Maani, Steve Stillman, Tim Maloney, Viv Hall.
rangitahi Māori who are just beginning quantitative economics at

                                                                  MOTU.ORG.NZ                                                                          5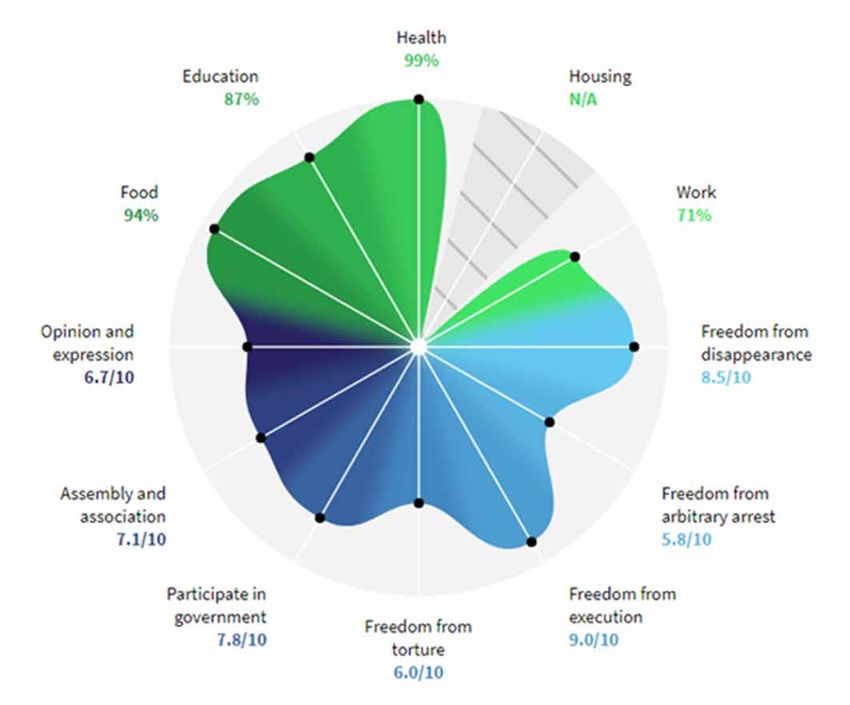
ECONOMIC AND PUBLIC POLICY RESEARCH

                                                     Motu publications in 2018
                        To see more of our publications, including presentations, please visit http://motu.nz/find-publications/.

Motu Working Papers                                                            Journal Articles
18-13 Alimi, O,, Maré DC, Poot J. 2018. “Who partners up? Educational          Apatov E, Grimes A. “Impacts of Higher Education Institutions on Local
assortative matching and the distribution of income in New Zealand.”           Population and Employment Growth”. International Regional Science
                                                                               Review. 2018.
18-12 Fabling R. 2018. “Entrepreneurial beginnings: Transitions to
self-employment and the creation of jobs.”                                     Fabling R, Grimes A, Timar L. “Natural selection: Firm performance fol-
                                                                               lowing a catastrophic earthquake” in: Borsekova K. & Nijkamp P. (eds.)
18-11 Fleming D, Preston K. 2018. “International agricultural mitigation       Resilience and Urban Disasters. London: Edward Elgar. 2018.
research and the impacts and value of two SLMACC research projects.”
                                                                               Fleming D, Grimes A, Lebreton L, Maré DC, Nunns P. “Valuing Sun-
(also a Ministry for Primary Industries publication)                           shine”, Regional Science and Urban Economics, 68, 268-276. 2018.
18-10 Hyslop D, Rea D. 2018. “Do housing allowances increase rents?            Gemmell N, Grimes A, Skidmore M. “Do local property taxes affect new
Evidence from a discrete policy change.”                                       building development? Results from a quasi-natural experiment in New
18-09 Fleming DA, Noy I, Pástor-Paz J, Owen S. 2018. “Public insurance         Zealand”. Journal of Real Estate Finance and Economics. 2018.
and climate change (part one): Past trends in weather-related insurance        Gibson J, Le T. “Improved modelling of spatial cost of living differences
in New Zealand.“                                                               in developing countries: A comparison of expert knowledge and tradi-
                                                                               tional price surveys.” Working Papers in Economics 18/08, University
18-08 Sin I, Dasgupta K, Pacheco G. 2018. “Parenthood and labour market
                                                                               of Waikato. 2018.
outcomes” (also a Ministry for Women report).
                                                                               Gørgens T, Hyslop D. “Equivalent representations of discrete-time two-
18-07 Grimes A, Wesselbaum D. 2018. “Moving towards happiness”.                state panel data models” Economics Letters, Vol 163 p65-67. 2018
18-06 Qasim M, Grimes A. 2018. “Sustainable economic policy and                Greenaway McGrevy R, Grimes A, Holmes M. “Two countries, sixteen
well-being: the relationship between adjusted net savings and subjective       cities, five thousand kilometres: How many housing markets?”. Papers in
well-being”.                                                                   Regional Science. 2018.
18-05 Clay KC, Bakker R, Brook A-M, Hill DW, Murdie A. 2018.                   Jaffe AB, Preston K. “Bibliometric Analysis of New Zealand Research
“HRMI civil and political rights metrics: 2018 technical note”.                Performance: Measurement and Classification Issues.” MBIE Working
                                                                               Paper. 2018.
18-04 Apatov E, Chappell N, Grimes A. 2018. “Is internet on the right
track? The digital divide, path dependence, and the rollout of New Zea-        Jefferson, OA, Jaffe AB, Ashton D, Warren B, Koellhofer D, Dulleck U,
land’s ultra-fast broadband”.                                                  Ballagh A, Moe J, DiCuccio M, Ward K, Bilder G, Dolby K, Jefferson
                                                                               RA. “Mapping the global influence of published research on industry and
18-03 Sin, I, Apatov E, Maré DC. 2018. “How did removing student               innovation” Nature Biotechnology, January 2018.
allowances for postgraduate study affect students’ choices?”
                                                                               Kerr S, Lubowski R, Heilmayr R. “Climate Teams: A New Model for
18-02 Jaffe AB, Chappell N. 2018. “Worker flows, entry, and productiv-         Investor-Host Climate Cooperation’ pp.73-76 in Stavins, Robert N., and
ity in New Zealand’s construction industry”.                                   Robert C. Stowe, eds. International Cooperation in East Asia to Address
18-01 Harris R, Le T. 2018. “Absorptive capacity in New Zealand firms:         Climate Change. Cambridge, Mass.: Harvard Project on Climate Agree-
measurement and importance”.                                                   ments.” 2018.
                                                                               Leining C. NZ Chapter in “ICIS Carbon Market Almanac 2017: Global
17-15 Sin, I, Stillman S, Fabling R. 2017. “What drives the gender wage
                                                                               Development and Outlook” 2017.
gap? Examining the roles of sorting, productivity differences, and dis-
                                                                               Sin I. “The Gravity of Ideas: How Distance Affects Translations” Econ
crimination”.
                                                                               J. 2017.
17-14 MacCulloch R. 2017. “Political systems, social welfare policies,
                                                                               Smart C, Grimes A, Townsend W. “Ethnic and Economic Determinants
income security and unemployment”.                                             of Migrant Location Choice” in: Biagi B, Faggian A, Rajbhandari I, Ven-
17-13 Fleming, DA, Grimes A, Lebreton L, Maré DC, Nunns P. 2017.               horst V. (eds.) New Frontiers in Interregional Migration Research, Ad-
“Valuing sunshine”.                                                            vances in Spatial Science, (The Regional Science Series). Springer, Cham.
                                                                               2018.
Motu Notes                                                                     Timar L, Grimes A, Fabling R. “Before a fall: Impacts of earthquake reg-
Motu Note #30 Stephenson et al. 2018. “Communities and climate                 ulation on commercial buildings”. Economics of Disasters and Climate
                                                                               Change, 2018.
change: vulnerability to rising seas and more frequent flooding”.
                                                                               Timar L, Grimes A, Fabling R. “That sinking feeling: The changing price
Motu Note #29 White et al. 2017. “Climate change and stormwater and
                                                                               of urban disaster risk following an earthquake”. International Journal of
wastewater systems”.                                                           Disaster Risk Reduction, 2018.

                                                                   MOTU.ORG.NZ                                                                             6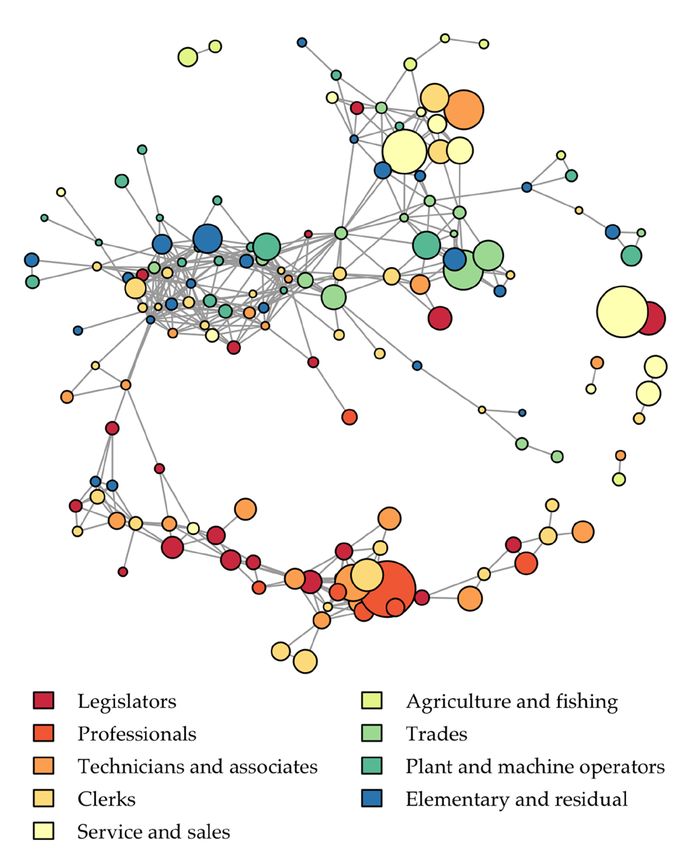
ECONOMIC AND PUBLIC POLICY RESEARCH

                                             Relatedness, complexity and local growth
Central government has committed to investing NZ$3 billion in regional economic development over the next three years. This commitment echoes
the European Union’s Cohesion Policy for raising regional wellbeing and avoiding regional disparities. Part of the Cohesion Policy encourages “smart
specialisation” in activities that build on local strengths. To economic geographers, smart specialisation is captured by the ideas of relatedness and econom-
ic complexity: regions should invest in complex, high-value activities that are related to their existing knowledge base.
We develop a measure of relatedness between economic activities and use this measure to estimate city and activity complexity in New Zealand. We also
evaluate the ability of relatedness and complexity to predict subsequent growth in local activity employment. Our analysis uses census employment counts
for 50 urban areas (“cities”) and 200 industry-occupation pairs (“activities”) in the years 1981, 1991, 2001 and 2013.

MAPPING RELATEDNESS
Firms engaged in related activities co-locate in order to benefit from labour market pooling, input sharing and knowledge spillovers. This means that,
on average, related activities tend to concentrate within the same cities. We capture this mutual concentration using weighted correlations of local
employment shares. These correlations are higher between activities that appear together more often than we would expect if activities were distributed
randomly according to their shares of national employment. Our approach extends discrete methods based on revealed comparative advantage used in
previous studies.
We use our relatedness estimates to create a map of “activity space,” a network in which nodes represent activities and with edges weighted by the
relatedness between activity pairs. The heaviest 500 edges in activity space are shown below, laid out so that related activities are close together and with
nodes coloured by occupation. Our network map reveals a densely connected cluster of activities associated with low-skill occupations, reflecting strong
co-location patterns. Activities associated with high-skill occupations are less tightly clustered.

ESTIMATING COMPLEXITY
Complex activities combine diverse sets of complementary knowledge and skills. As a result, complex activities are valuable but hard to establish; they
are not spatially transferable and tend to concentrate in large urban areas that facilitate deep divisions of labour. We estimate activity complexity using
numerical methods that capture the extent to which activities rely on specialized combinations of knowledge.
The most complex activities in our sample are associated with high-skill occupations in the professional service, telecommunications and finance industries.
By contrast, the least complex activities are associated with low-skill occupations in the retail and construction industries.

PREDICTING GROWTH
More complex activities experienced faster growth in our sample. On average, a one standard deviation rise in activity complexity is associated with a one
percentage point increase in employment growth per year. This effect falls to 0.89 percentage points when we control for activities’ average relatedness
with other activities in each city.
Our preferred model specification, which controls for time-varying city and
activity factors, explains 72% of the variation in local activity growth rates. On
average and across our entire sample, relatedness and complexity have a positive
joint effect on local employment growth. However, this effect is both statistically
and economically insignificant. Moreover, higher relatedness and higher complex-
ity together predict declines in activities that are locally under-represented relative
to their share of national employment. These results indicate that smart specialisa-
tion does not explain employment dynamics in our data.

CONCLUSIONS
Complex activities in our sample experienced faster growth between 1981 and
2013---especially in cities dense with such activities---but this growth was not
significantly stronger when related activities were more prevalent in the city. The
benefits of relatedness, which underlie a “smart specialisation” approach to lo-
cal economic development, were not evident in New Zealand during our sample
period. It remains an open question whether policies to strengthen local
relatedness and complexity have the potential to deliver such benefits in the future.

Acknowledgements: This work is funded through Te Pūnaha Matatini, and the
Building Better Homes, Towns and Cities National Science Challenge.

                                                                       MOTU.ORG.NZ
ECONOMIC AND PUBLIC POLICY RESEARCH
Motu’s Research and the “Wellbeing Budget”
In 2019, New Zealand will have its first explicit Wellbeing Budget. That Budget will build on Treasury’s work to develop a comprehensive Living Standards
Framework for policy-making.
Many aspects of Motu’s research can assist in understanding what might be important for government to consider in order to enhance wellbeing. In particular, a
series of studies funded through a Royal Society of New Zealand Marsden Fund grant provide information on what people see as being important for their own
wellbeing.
While there are many interpretations, the Oxford English Dictionary provides “welfare” as a one word definition of “well-being”. Our history has seen many
welfare-oriented budgets from governments of all stripes. Notable amongst these, of course, were the major welfare programmes introduced by the Liberal govern-
ment of the 1890s and the Labour government of the 1930s. So how might a “wellbeing” budget differentiate itself from one of these “welfare” budgets?
Globally, researchers use measures of subjective wellbeing as indicators of wellbeing across and within nations. These measures are often based on a question
that reads something like: “How do you feel about your life as a whole right now?”1 The worldwide Gallup Poll asks a similar question across approximately 150
countries. In the latest poll – topped by Norway – New Zealand ranks 8th in the world for average life satisfaction. We rate slightly above Sweden (9th) and
Australia (10th) and well above USA and UK (15th and 18th respectively). New Zealand’s high wellbeing ranking compares with our rank of 34th according to
Gross National Income per person.2
So what factors do New Zealanders value? Our research3 shows that factors which are associated with high subjective wellbeing include: having good health –
especially good mental health; being prosperous; and not being unemployed. As in many countries, adults who are under 30 years of age and adults over 60
years of age are more satisfied with life than middle-aged people. Women also tend to be a little happier than men. Other research shows that having good social
connections (e.g. someone to rely on in an emergency) is extremely important for people’s wellbeing.4
Prosperity is important to most people; even workers in the social services strike for more money! However, our research shows “a Wellbeing
that personal income is not the best indicator of prosperity. It turns out that people’s subjective wellbeing is more closely related
to what they can consume rather than what they earn. For instance, older people may have low incomes, but those who have
Budget might
saved over their working lives may still be able to afford an affluent lifestyle. identify specific
This observation indicates that Budget policies aimed at boosting wellbeing should not necessarily be directed at low income
target groups (e.g.
individuals per se; rather attention is better directed to those who cannot afford essentials. An example of expenditures that sole parent families)
might be redirected in a wellbeing budget are winter bonus payments to the over-65s which go to some people in need, but and specific target
which also go to people who are already living very comfortably. policy areas (e.g.
The observation that consumption expenditures are a better indicator of wellbeing than incomes can also be used to compare mental health) that
New Zealanders’ material wellbeing relative to that of people in other countries. Another Motu study5 used OECD PISA require the greatest
survey data for households’ durable goods possessions (e.g. for books, artworks, computers, dishwashers, cars and bedrooms).
Specifically, the households had to have a 15 year old in that household; hence comparisons are for families at a similar stage of attention to lift the
the life cycle. well- being of the
On this measure, New Zealand families ranked 3rd in the world in terms of average household possessions (behind USA and most deprived”
Canada and just ahead of Australia). Thus while our incomes are not world-beating, on average we can afford plenty of stuff!
However the same research showed a less rosy picture in terms of the distribution of resources across families. New Zealand ranked as a more unequal society than
most developed countries. We were on a par with Canada, USA and the UK and were much more unequal than many Western European countries and Australia.
Work within Superu6 shows that certain types of household are much more deprived than others. In particular, sole parent families with children are particularly
deprived. Recent work within Treasury7 identifies other groups that face particular hardships.
Based on this and other research, one can anticipate that a Wellbeing Budget might identify specific target groups (e.g. sole parent families) and specific target policy
areas (e.g. mental health) that require the greatest attention to lift the wellbeing of the most deprived.
One final observation is in order. There is now significant wellbeing-related research available on which to base policy. As always, however, well-designed evalua-
tions of policy interventions will be required to ensure that the money that is spent has a real payoff for those most in need.
1. This wording was used in the New Zealand General Social Survey in 2012, which was the source of the data used in Carver and Grimes (2016), referenced below.
2. Source: UNDP (using purchasing power parity figures).
3. Carver T. & A. Grimes. 2016. “Income or Consumption: Which Better Predicts Subjective Wellbeing?” Motu Working Paper 16-12.
4. Brown D., J. Woolf & C. Smith. 2012. “An empirical investigation into the determinants of life satisfaction in New Zealand”, New Zealand Economic Papers, 46(3), 239-251.
5. Grimes A. & S. Hyland. 2015. “A New Cross-Country Measure of Material Wellbeing and Inequality: Methodology, Construction and Results”, Motu Working Paper 15-09.
6. Superu. 2017. Families and Whānau Status Report, Wellington: Social Policy Evaluation and Research Unit.
7. Unofficial ‘work in progress’ from within Treasury on Multidimensional Wellbeing in NZ was presented to the Third International Conference on Wellbeing and Public
Policy, Wellington, September 2018.
Motu Research Update is the newsletter of Motu Economic and Public Policy Research Trust Web: motu.nz
Level 1, 97 Cuba Street, PO Box 24390, Wellington 6042, New Zealand Email: info@motu.org.nz
Phone: 64 4 939 4250 Fax: 64 4 9394251 Twitter: @moturesearchYou can also read